 Multi-family
3510 W 10th Ave Unit B · Kennewick, WA
Flood risk 1/10 · Minimal
- FEMA flood zone
- X
- Chance of flooding over 30 yrs
- 0.0%
- Est. flood insurance / yr
- $507 – $1,088
Fire risk 4/10 · Minor
- Est. fire insurance / yr
- $604 – $1,122
Heat risk 4/10 · Minor
- Hot days now (above 99°F)
- 7 days/yr
- Hot days in 30 yrs
- 14 days/yr
Wind risk 1/10 · Minimal
- Chance of severe wind over 30 yrs
- —
Air-quality risk 8/10 · Major
- Unhealthy air days now
- 14 days/yr
- Unhealthy air days in 30 yrs
- 15 days/yr
Risk factors via First Street. Map © Google.
Why this score? — see what drove the D+ grade
The composite is a weighted blend of 9 inputs, each scored 0–100. Each bar is that input's sub-score; the figure is the points it added to the 100-point composite (weight × sub-score).
- Cash flow +15.0/30.0
- ARV discount +7.5/15.0
- 1% rule +5.0/10.0
- DSCR +5.0/10.0
- Schools +4.6/10.0
- Livability +3.9/5.0
- Rent growth +3.3/5.0
- Condition / age +2.5/5.0
- Appreciation +0.0/10.0
$1,095
🖨 Deal sheet (PDF) 📄 Offer letter ✓ Due diligence
Multi-family units
County records classify this as Multi-Family (5+ Unit). Listing-text estimate: 1 unit. estimate disagrees with records
5+ unit building — per-unit beds/baths from public records are typically unavailable; the breakdown below (if shown) is an estimate from the listing text.
Listing remarks
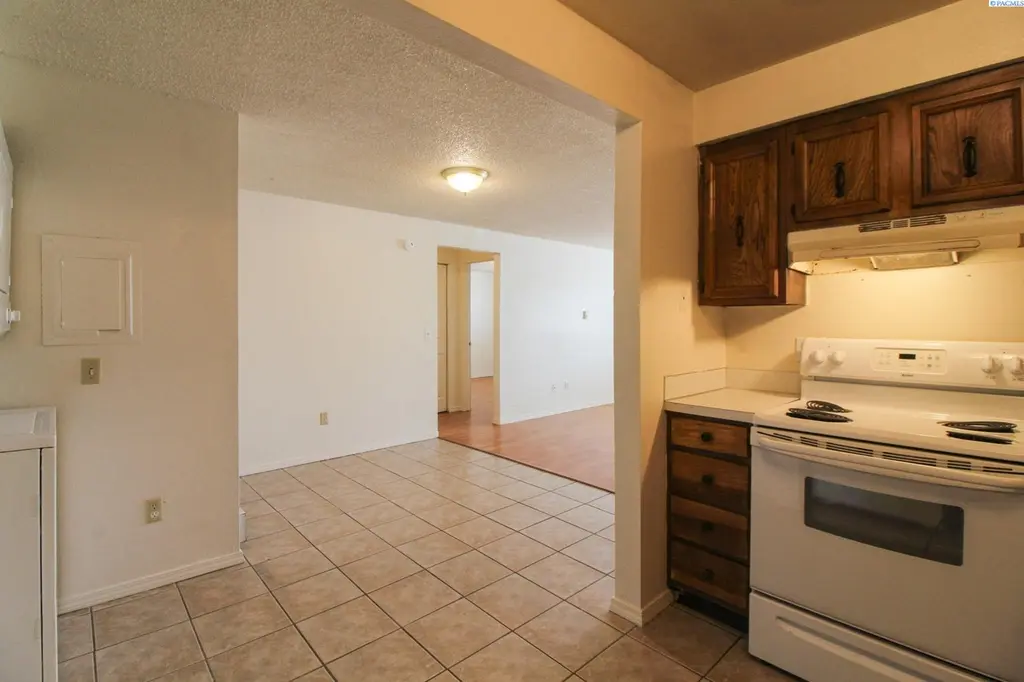
We do not accept 3rd party applications or viewing requests. 2 Bed, 1 Bath 830 sqft Home in Kennewick This inviting 2-bedroom, 1-bath home offers 830 square feet of comfortable living space designed for both functionality and ease. The kitchen features an abundance of cabinet storage, making it perfect for keeping everything organized and within reach. A stackable washer and dryer are included, adding everyday convenience right at home. Outside, you’ll enjoy off-street parking, providing added peace of mind and accessibility. Ideal for those seeking a practical and cozy living space, this home combines comfort with essential amenities in a well-designed layout. Interior: * 2 Bedroo
Key facts
- Off street parking
- Storage closet
- Tiled shower
Tags
Property features AI
Exterior
- Parking: No garage
- Home design: Single-family residence, site-built on owned lot; One-level home
- Construction: New construction
- Exterior features: Lot about 0.24 acres (approximately 10,454 sq ft); Zoned for single-family residential; Subdivision: SHORT PLAT
Interior
- Bathrooms: 1 full bathroom
- Interior features: No basement
Neighborhood map
What this means for you Summary
Snapshot
- This is a 2-bed/1.0-bath multifamily listed at $1k.
Deal economics
- At list price, monthly cash flow is $2k ($25k/yr) — positive.
- The deal already cash-flows at list — no discount required.
- Meets the 1% rule at list price ($3k rent vs $1k).
- Recommended offer: $1k (1.6% below list) — sets the bar for market timing.
- Cap rate 2267.1% vs local median 3.3% in Kennewick — top-decile yield for the area; either an underpriced asset or a hidden risk that comps aren't pricing in. Stress-test before assuming the spread holds.
Location & tenants
- Location reads 78/100 on livability (#131 in WA, #2,599 nationally) — a middle-class / working-renter tenant base. Strengths: commute A+, housing A+, health & safety A; Watch: amenities D+, crime F.
- Kennewick School District (urban): math 43% / reading 58% proficiency, ranked #141 of 291 in WA (top 48%) — acceptable for families but not a draw, mixed tenant base, ~2y average lease.
- Zoned schools: Lincoln Elementary School (435 students, 58% FRL); Highlands Middle School (750 students, 84% FRL); Southridge High School (1,641 students, 55% FRL) — zoned schools average 66% FRL vs 48% district-wide (18 pts higher); higher-poverty schools than district average — tighter screening recommended.
- Market conditions: Rents rising (+3.4%/yr); 292 active listings in the ZIP; 40 comparable units currently listed for rent nearby; rentals at typical pace (median 23d on market — plan ~3-4 weeks tenant-placement turnaround); 1,532 units permitted in Benton County in 2024 (389 in 5+ unit buildings).
- At $2,621/mo this rent would consume 50% of the median local household income ($63k/yr) (locally 2605% of renters already pay >50% of income on rent) — very limited rent-growth headroom before tenants either downsize or default.
Forward outlook
- Local home prices are declining (-3.0%/yr); year-one equity from $7 of loan paydown is wiped out by about $33 of value loss. Plan a longer hold.
- Benton County population projected at +32% by 2050 — long-run rental-demand tailwind backs the buy-and-hold thesis.
- At projected returns (-3.0% appreciation + 3.4% rent growth), your $307 cash investment doubles in ~1 year — after that, you're playing with house money.
Negotiation context
- It's been on market 26 days — a 2% lower offer ($1k) is reasonable based on typical stale-listing flexibility.
- 2 sale attempts with the ask held roughly flat each time — persistent listings suggest the price (not the market) is what's stuck; bring a comps-based counter.
Questions for the listing agent
- Built in 1977 — when were the roof, HVAC, electrical panel, plumbing, and water heater last replaced?
- Is there a deadline driving the sale (1031 exchange, divorce, estate, relocation)? That informs how much negotiation room exists.
- Schools are D-rated, which usually means shorter tenancies and higher turnover. Who's the typical renter profile here, and what's been the actual vacancy rate?
- Crime grade is F in this area — have there been break-ins, vandalism, or insurance claims at this property in the last 3 years? What carrier currently insures it and at what premium?
- The area grade is low — what's the realistic commute time and amenity access for the typical tenant pool here? Any planned neighborhood developments (good or bad) we should know about?
- What's the average days-on-market for RENTAL listings here right now (not sales)? A rising rental-DOM trend means longer vacancies and softer asking-rent achievability than the comps imply.
- What's the recent tenant-quality profile in this submarket — average credit score on applications, eviction rate, late-payment / NSF rate, and stable-employment percentage? A property-management company in the area should have these aggregated.
- How much new apartment / multifamily construction is in the pipeline within 1–3 miles? Heavy new supply (>2% of stock underway) typically softens rents 12–24 months out; light construction supports rent growth.
Investment metrics
- 1% rule
- 239.36% ✓
- Cap rate
- 2267.14%
- Cash-on-cash
- 8074.45%
- DSCR
- 360.27
- GRM
- 0.0
CMA / ARV
No comps found within radius.
Projected returns pro-forma
-3.0% appreciation · 3.39% rent growth · sell at horizon
- IRR
- —
- Equity multiple
- 432.47×
- Total profit
- $132,290
- Equity at exit
- $163
- IRR
- —
- Equity multiple
- 943.00×
- Total profit
- $288,819
- Equity at exit
- $95
Cash invested: $307 (down + closing). Projections, not guarantees.
Landlord ↔ Tenant lean methodology
- Overall (STATE)
- 28 Tenant-Leaning
- State Washington
- 28 Tenant-Leaning · D+8
- County
- — inherits STATE
- City
- — inherits STATE
ZIP-level market 99336
- Rents YoY
- 3.4%
- Active inventory
- 292
- Price-to-rent
- 0.1×
Monthly cashflow live
- Estimated rent
- $2,621 medium interval (Pro) →
- Mortgage (P&I)
- −$6
- Tax est. 1.5%
- −$1 /mo · $16/yr
- Insurance
- −$0
- HOA
- −$0
- Vacancy / Maint / Mgmt
- −$550
- Net cashflow
- $2,063
Break-even live
Sensitivity live
| Price | -10% $2,064 | -5% $2,063 | +0% $2,063 | +5% $2,063 | +10% $2,062 |
|---|---|---|---|---|---|
| Rent | -10% $1,856 | -5% $1,959 | +0% $2,063 | +5% $2,167 | +10% $2,270 |
| Rate | -1.0pp $2,064 | -0.5pp $2,063 | base $2,063 | +0.5pp $2,063 | +1.0pp $2,062 |
2-unit breakdown (identical units grouped — click to expand)
| Units | Beds | Baths | Est. rent |
|---|---|---|---|
| 2× units | 2 | 1 | $2,622 |
| #1 | 2 | 1 | $1,311 |
| #2 | 2 | 1 | $1,311 |
| Total (2 units) | $2,621 | ||
UW: 25.0% down · 7.5% · 30yr · 1.5% tax · 5.0% vac · 8.0% maint · 8.0% mgmt
Financing live
Cash to close
- Down payment
- $274
- Closing costs
- $33
- Reserves months
- —
- Total cash needed
- —
Loan-product check · same deal, 3 products live
Conventional
25% down · 7.5% · 30yr
- Down + closing
- —
- Monthly P&I
- —
- Monthly cashflow
- —
- DSCR
- —
- Eligible?
- —
Personal DTI + credit; lowest rate.
DSCR
20% down · 8.5% · 30yr
- Down + closing
- —
- Monthly P&I
- —
- Monthly cashflow
- —
- DSCR
- —
- Eligible?
- —
No personal income docs; deal must DSCR.
Hard money
10% down · 12.0% · 12mo
- Down + closing
- —
- Monthly P&I
- —
- Monthly cashflow
- —
- DSCR
- —
- Eligible?
- —
Short-term bridge; refi at stabilization.
Rent comps 40 comps
| Address | Beds | Baths | Sqft | Rent | $/sqft | DOM | Units | Dist |
|---|---|---|---|---|---|---|---|---|
| 3426 W 7th Ave Unit A130 Kennewick, WA | 2.0 | 2.0 | 1000 | $1,650 | $1.65 | 45d | 1 | 0.26mi |
| 3426 W 7th Ave Kennewick, WA | 2.0 | 2.0 | 1000 | $1,600 | $1.60 | 23d | 1 | 0.26mi |
| 3113 W 7th Ave Unit D110 Kennewick, WA | 2.0 | 2.5 | 1000 | $1,750 | $1.75 | 15d | 1 | 0.34mi |
| 3708 W 6th Ave Unit B Kennewick, WA | 2.0 | 1.0 | 918 | $1,325 | $1.44 | 45d | 1 | 0.34mi |
| 455 S Morain St Kennewick, WA | 2.0 | 1.0 | 775 | $1,950 | $2.52 | 45d | 1 | 0.41mi |
| 3611 W 17th Pl Unit A Kennewick, WA | 2.0 | 1.0 | 970 | $1,495 | $1.54 | 23d | 1 | 0.43mi |
| 400 S Morain St #7 Kennewick, WA | 3.0 | 2.5 | 1100 | $1,500 | $1.36 | 23d | 1 | 0.47mi |
| 337 S Johnson St Unit F Kennewick, WA | 1.0 | 1.0 | 550 | $875 | $1.59 | 23d | 1 | 0.53mi |
| 337 S Johnson St Unit A Kennewick, WA | 1.0 | 1.0 | 550 | $975 | $1.77 | 45d | 1 | 0.53mi |
| 325 S Johnson St Kennewick, WA | 2.0 | 1.5 | 1100 | $1,495 | $1.36 | 45d | 1 | 0.55mi |
| 3120 W 4th Ave Kennewick, WA | 2.0 | 1.0 | 963 | $1,550 | $1.61 | 15d | 1 | 0.56mi |
| 3120 W 4th Ave Unit 360 Kennewick, WA | 2.0 | 1.0 | 963 | $1,550 | $1.61 | 45d | 1 | 0.56mi |
| 3120 W 4th Ave Apt 120 Kennewick, WA | 2.0 | 1.0 | 963 | $1,625 | $1.69 | 15d | 1 | 0.56mi |
| 2652 W 15th Ave Kennewick, WA | 2.0–3.0 | 2.0 | 1152 | $1,599 | $1.39 | 15d | 5 | 0.60mi |
| E 6th Ave Kennewick, WA | 2.0 | 1.0 | 1100 | $1,500 | $1.36 | 45d | 1 | 0.66mi |
| 3703 W Kennewick Ave Kennewick, WA | 1.0–2.0 | 1.0 | 782 | $1,594 | $2.04 | 15d | 8 | 0.70mi |
| 500 S Conway Pl Unit 500 Kennewick, WA | 2.0 | 1.0 | 950 | $1,500 | $1.58 | 45d | 1 | 0.70mi |
| 12 S Morain St Kennewick, WA | 1.0–3.0 | 1.0 | 604 | $1,249 | $2.07 | 15d | 3 | 0.71mi |
| 130 S Conway Pl Kennewick, WA | 2.0 | 1.0 | 852 | $1,299 | $1.52 | 15d | 1 | 0.80mi |
| 4112 W 24th Ave Kennewick, WA | 1.0–2.0 | 1.0–2.0 | 681 | $1,875 | $2.75 | 23d | 4 | 0.84mi |
| 513 S Anderson St Kennewick, WA | 2.0 | 1.0 | 720 | $1,495 | $2.08 | 23d | 1 | 0.84mi |
| 4108 W Albany Ave Unit A-D Kennewick, WA | 2.0 | 1.5 | 945 | $1,395 | $1.48 | 45d | 1 | 0.88mi |
| 200 S Union St Kennewick, WA | 2.0 | 1.0–1.5 | 860 | $1,348 | $1.57 | 15d | 2 | 0.89mi |
| 119 S Conway Pl Kennewick, WA | 2.0 | 1.0 | 711 | $1,200 | $1.69 | 23d | 1 | 0.92mi |
| 9 N Waverly Pl Kennewick, WA | 1.0 | 1.0 | 600 | $1,222 | $2.04 | 15d | 2 | 1.14mi |
| 89 N Waverly Pl Apt E Kennewick, WA | 2.0 | 1.0 | 1000 | $1,250 | $1.25 | 45d | 1 | 1.17mi |
| N Johnson St Kennewick, WA | 2.0 | 1.5 | 1100 | $1,450 | $1.32 | 23d | 3 | 1.18mi |
| 440 N Volland St Kennewick, WA | 1.0–3.0 | 1.0–1.5 | 958 | $1,362 | $1.42 | 15d | 7 | 1.20mi |
| 4421 W Hood Ave Kennewick, WA | 2.0 | 1.5 | 942 | $1,412 | $1.50 | 15d | 3 | 1.27mi |
| 1816 W 21st Ave Unit C Kennewick, WA | 3.0 | 2.0 | 1120 | $1,495 | $1.33 | 15d | 1 | 1.27mi |
| 318 N Arthur St Kennewick, WA | 2.0–3.0 | 2.0 | 1113 | $1,675 | $1.50 | 15d | 1 | 1.27mi |
| 445 N Volland St Kennewick, WA | 1.0–2.0 | 1.0 | 735 | $1,294 | $1.76 | 15d | 7 | 1.29mi |
| 2525 W Grand Ronde Ave Kennewick, WA | 2.0–3.0 | 1.0–2.0 | 1044 | $1,345 | $1.29 | 15d | 4 | 1.30mi |
| 609 N Tweedt St Kennewick, WA | 2.0 | 1.0 | 950 | $1,295 | $1.36 | 15d | 1 | 1.32mi |
| 1702 W 7th Pl Unit B Kennewick, WA | 2.0 | 1.0 | 950 | $1,050 | $1.11 | 45d | 1 | 1.32mi |
| 1618 W 7th Pl Unit A Kennewick, WA | 2.0 | 1.0 | 920 | $1,050 | $1.14 | 45d | 1 | 1.34mi |
| 460 N Arthur St Kennewick, WA | 2.0 | 1.0–2.0 | 749 | $1,700 | $2.27 | 15d | 7 | 1.35mi |
| 1619 W 5th Ave Unit A Kennewick, WA | 2.0 | 1.0 | 981 | $1,450 | $1.48 | 23d | 1 | 1.36mi |
| 1608 W 14th Ave Unit 1614 Kennewick, WA | 2.0 | 1.0 | 750 | $995 | $1.33 | 23d | 1 | 1.37mi |
| 5100 W Clearwater Ave Kennewick, WA | 1.0–3.0 | 1.0–2.0 | 1068 | $1,614 | $1.51 | 15d | 6 | 1.42mi |
Listing history 19 events
-
2026-06-21days on market $1,095 Active 26 DOM
-
2026-06-18days on market $1,095 Active 23 DOM
-
2026-06-17days on market $1,095 Active 22 DOM
-
2026-06-16days on market $1,095 Active 21 DOM
-
2026-06-15days on market $1,095 Active 20 DOM
-
2026-06-14days on market $1,095 Active 18 DOM
-
2026-06-13days on market $1,095 Active 17 DOM
-
2026-06-10days on market $1,095 Active 15 DOM
-
2026-06-09days on market $1,095 Active 14 DOM
-
2026-06-08days on market $1,095 Active 13 DOM
-
2026-06-07days on market $1,095 Active 12 DOM
-
2026-06-05days on market $1,095 Active 9 DOM
-
2026-06-03days on market $1,095 Active 8 DOM
-
2026-06-02days on market $1,095 Active 7 DOM
-
2026-06-01days on market $1,095 Active 6 DOM
-
2026-05-31days on market $1,095 Active 5 DOM
-
2026-05-30days on market $1,095 Active 4 DOM
-
2026-05-26$1,095 Active
-
2026-05-26$1,095
ⓘ Source: listings_history table (triggers on properties + properties_extension) + one-shot
backfill from property_details.listing_events for pre-trigger history.
Climate risk First Street
- Flood 1/10 Low FEMA zone X · 0% chance over 30 yrs
- Wildfire 4/10 Moderate
- Heat 4/10 Moderate 7 d/yr ≥99°F today · 14 d/yr by 30 yrs out
- Wind 1/10 Low
- Air quality 8/10 Severe 14 unhealthy d/yr today · 15 by 30 yrs out
Nearby sold comps map
Loading sold comps map…
Walkable amenities ~0.75 mi
Loading nearby amenities…
Taxation est. · year 1
- Rental income
- $31,452
- − Mortgage interest
- −$61
- − Property taxes
- −$16
- − Insurance
- −$5
- − Repairs & maintenance
- −$2,516
- − Management
- −$2,516
- − Depreciation
- −$32
- Taxable income
- $26,305
- Est. tax owed @ 24.0%
- −$6,313
- After-tax cash flow
- $18,443/yr
For passive investors: Depreciation is non-cash, so a rental often shows a tax loss while cash-flowing — sheltering income. Rental losses are passive: they offset passive income freely, and up to $25,000/yr can offset ordinary (W-2) income if you actively participate and your MAGI is under $100k (phasing out to $0 by $150k); unused losses carry forward. On sale, claimed depreciation is recaptured at up to 25%, and gains may owe capital-gains tax (a 1031 exchange can defer both). Figures are a year-1 estimate at your 24.0% rate — not tax advice; consult a CPA.
Schools (NCES district)
- District
- Kennewick School District
- NCES district ID
- 5303930
- Math proficiency
- 43% ▼ -1.00%
- Reading proficiency
- 58% ▬ 0.00%
- Median HH income
- $54,191
- Composite
- 45.56/100
- National rank
- #5667
- State rank
- #141 of 291 in WA
Livability — Kennewick
- Score
- 78/100
- State rank
- #131
- US rank
- #2599
Category grades
Schools grade is shown separately in the Schools card above.
Census & demographics
- Census place
- Kennewick, WA
- County
- Benton County · 186,895 people
- City population
- 104,655
- Metro
- Kennewick-Richland, WA
- Population (ZIP)
- 50,735
- Household income
- $62,527
- Rent vs Own
- Severe rent burden
- 2605.0
Population outlook (Benton County) Hauer SSP2
- Today (2025)
- 219,421 people
- By 2030
- 233,813 · +6.6%
- By 2040
- 262,134 · +19.5%
- By 2050
- 290,100 · +32.2%
- By 2075
- 363,525 · +65.7%
- By 2100
- 418,667 · +90.8%
Race, ethnicity, and origin ACS 2023
- Neighborhood character
- Diverse neighborhood (Simpson 0.56)
- Race & ethnicity
- White 55% Hispanic / Latino 37% Two or more races 15% Black 3% Asian 2% Native American 1%
- Hispanic origin (detail)
- Mexican 31% Cuban 2%
- Common ancestry
- Portuguese 4% Slovak 3% Romanian 1%
- Foreign-born
- 16% · Canada, Jamaica
- Languages at home
- 68% English-only · Spanish 29% Arabic 1%
Political lean MEDSL · Benton
- 2024 margin
- Strong R (+21.9) · D 37.7% · R 59.6% · Other 2.7%
- 2008→2024 swing
- +4.2pp toward D · 2008: -26.1pp · 2024: -21.9pp
- All cycles
- 2024: R+21.9 2020: R+21.0 2016: R+26.6 2012: R+27.0 2008: R+26.1
Not yet ingested
- Civics
- —
Market trends
- HPI YoY
- ▼ -408.26%
- Current HPI
- 256.1143
- Rent YoY
- ▲ 3.39%
- Metro
- Kennewick-Richland, WA
- State GDP YoY
- ▲ 4.65%
- F500 in state
- 22
Industry mix (Fortune 500 HQ in WA)
| Industry | F500 HQs | Revenue |
|---|---|---|
| Retail | 2 | $269B |
|
||
| Technology / Retail | 1 | $638B |
|
||
| Technology | 1 | $245B |
|
||
| Telecommunications | 1 | $38B |
|
||
| Food / Beverage | 1 | $36B |
|
||
| Automotive / Trucks | 1 | $34B |
|
||
Price history
+0.0% since first listed2 events — show timeline
- 2026-05-26 Listed $1,095 PACMLS
- 2026-05-26 Listed for Rent $1,095 APPFOLIO
Cash-flow waterfall
monthlySold comps — $/sqft
last 12 mo · ≤1 miLoading sold comps…