20745 Deuster Ln · Porter Heights, TX
Flood risk 3/10 · Minor
- FEMA flood zone
- X (unshaded)
- Chance of flooding over 30 yrs
- 0.2%
- Est. flood insurance / yr
- $507 – $1,088
Fire risk 2/10 · Minimal
- Est. fire insurance / yr
- $1,222 – $2,270
Heat risk 8/10 · Major
- Hot days now (above 110°F)
- 7 days/yr
- Hot days in 30 yrs
- 24 days/yr
Wind risk 8/10 · Major
- Chance of severe wind over 30 yrs
- 99.0%
Air-quality risk 3/10 · Minor
- Unhealthy air days now
- 3 days/yr
- Unhealthy air days in 30 yrs
- 3 days/yr
Risk factors via First Street. Map © Google.
Why this score? — see what drove the D+ grade
The composite is a weighted blend of 9 inputs, each scored 0–100. Each bar is that input's sub-score; the figure is the points it added to the 100-point composite (weight × sub-score).
- ARV discount +15.0/15.0
- Cash flow +14.5/30.0
- DSCR +4.4/10.0
- 1% rule +4.1/10.0
- Livability +3.2/5.0
- Rent growth +2.9/5.0
- Schools +2.8/10.0
- Condition / age +2.5/5.0
- Appreciation +0.0/10.0
$199,000
🖨 Deal sheet (PDF) 📄 Offer letter ✓ Due diligence
Listing remarks
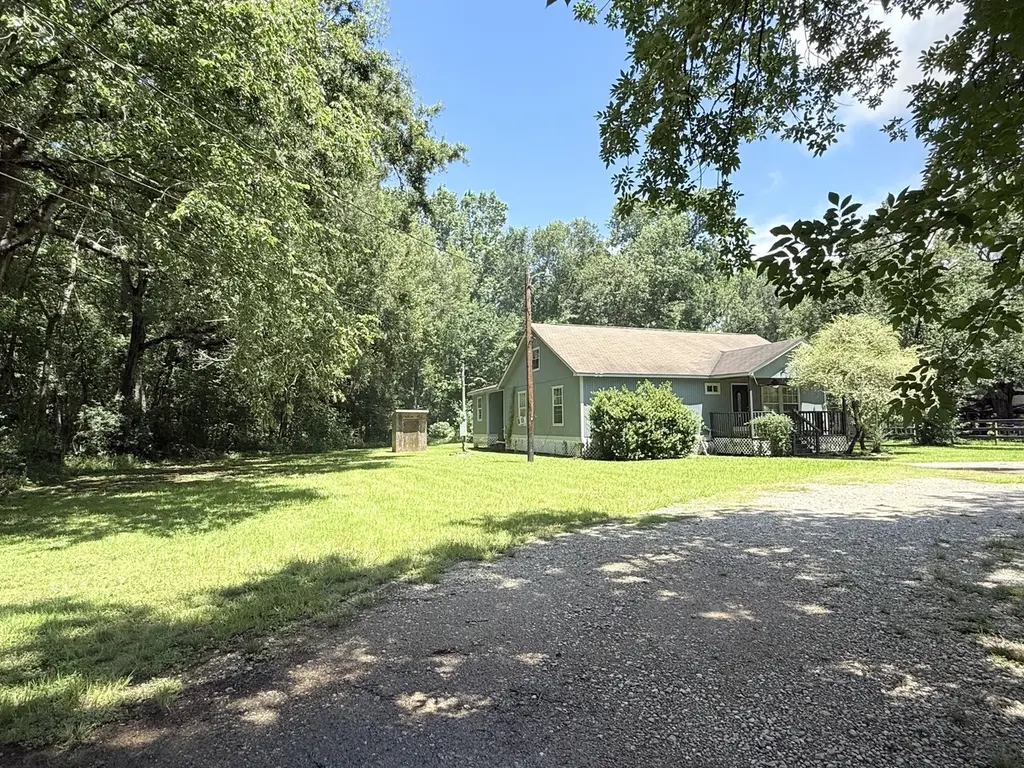
Exceptional investment opportunity in the rapidly growing Porter area! Situated on a generous 40,075-square-foot lot, this property is located in a thriving corridor surrounded by new residential and commercial development, offering outstanding long-term potential. With no restrictions and endless possibilities, this property is ideal for investors, builders, or anyone seeking a redevelopment opportunity. The existing home requires renovation, making it a perfect fixer-upper, rental project, or teardown for new construction. The expansive lot provides ample room to build, expand, or create a custom project tailored to your vision. Whether you're looking to renovate, redevelop, or hold for f
Key facts
- 0.92 acre lot
- Built 2010
- Listed 5 days
Neighborhood map
What this means for you Summary
Snapshot
- This is a 2-bed/2.0-bath single-family listed at $199k.
Deal economics
- At list price, monthly cash flow is $44 ($524/yr) — positive.
- The deal already cash-flows at list — no discount required.
- To meet the 1% rule (rent ≥ 1% of price), the offer needs to be $182k (8.5% below list).
- Recommended offer: $182k (8.5% below list) — sets the bar for 1% rule.
- Cap rate 6.6% vs local median 2.5% in Porter Heights — top-decile yield for the area; either an underpriced asset or a hidden risk that comps aren't pricing in. Stress-test before assuming the spread holds.
Location & tenants
- Location reads 65/100 on livability (#663 in TX) — a middle-class / working-renter tenant base. Strengths: crime A+, employment A+, cost of living A+; Watch: amenities F, commute F, health & safety F.
- New Caney ISD (suburban): math 31% / reading 32% proficiency, ranked #570 of 826 in TX (top 69%) — families likely to look elsewhere, expect single-tenant / working-renter base with shorter leases.
- Zoned schools: White Oak Middle (math 38% / reading 32%, grade F, #842 of 1,662 statewide, top 51%, 834 students, 75% FRL); New Caney H S (math 24% / reading 31%, grade F, #1,183 of 1,632 statewide, top 73%, 2,428 students, 78% FRL) — zoned schools average 76% FRL vs 57% district-wide (20 pts higher); higher-poverty schools than district average — tighter screening recommended.
- Market conditions: Rents rising (+1.6%/yr); 955 active listings in the ZIP; 2 comparable units currently listed for rent nearby; solid renter incomes; 13,259 units permitted in Montgomery County in 2024 (1,402 in 5+ unit buildings).
Forward outlook
- Local home prices are declining (-3.0%/yr); year-one equity from $1k of loan paydown is wiped out by about $6k of value loss. Plan a longer hold.
- Montgomery County population projected at +65% by 2050 — long-run rental-demand tailwind backs the buy-and-hold thesis.
Negotiation context
- Only 5 days on market — expect competitive offers; lowballing is unlikely to land.
Risks & watch-outs
- Climate carrying-cost: severe wind risk, 99% chance of damaging wind over 30y; extreme-heat days projected 7→24/yr by 2055 (HVAC capex compounding) — expect insurance premiums to compound above CPI over the hold.
Questions for the listing agent
- Is there a deadline driving the sale (1031 exchange, divorce, estate, relocation)? That informs how much negotiation room exists.
- Schools are F-rated, which usually means shorter tenancies and higher turnover. Who's the typical renter profile here, and what's been the actual vacancy rate?
- The area grade is low — what's the realistic commute time and amenity access for the typical tenant pool here? Any planned neighborhood developments (good or bad) we should know about?
- What's the average days-on-market for RENTAL listings here right now (not sales)? A rising rental-DOM trend means longer vacancies and softer asking-rent achievability than the comps imply.
- What's the recent tenant-quality profile in this submarket — average credit score on applications, eviction rate, late-payment / NSF rate, and stable-employment percentage? A property-management company in the area should have these aggregated.
- How much new for-sale + rental construction is in the pipeline within 1–3 miles? Heavy new supply typically softens prices + rents 12–24 months out; constrained supply supports both.
Investment metrics
- 1% rule
- 0.91% ✗
- Cap rate
- 6.56%
- Cash-on-cash
- 0.94%
- DSCR
- 1.04
- GRM
- 9.1
CMA / ARV
- ARV (on-the-fly)
- $268,840
- Comps found
- 8
Show comp detail 8 sales within ~0.75 mi
| Address | Dist | Beds/Ba | Sqft | Sold | Price | $/sf | Match |
|---|---|---|---|---|---|---|---|
| 21015 Voyage Ln | 0.62mi | 3/2.5 (+1) | 1,952 (+4%) | 6mo | $249,900 | $128 | 53 |
| 21022 Voyage Ln | 0.64mi | 3/2.5 (+1) | 1,952 (+4%) | 6mo | $259,900 | $133 | 52 |
| 21019 Voyage Ln | 0.62mi | 3/2.5 (+1) | 1,678 (-11%) | 6mo | $234,900 | $140 | 41 |
| 21014 Voyage Ln | 0.63mi | 3/2.5 (+1) | 1,678 (-11%) | 6mo | $239,900 | $143 | 41 |
| 20521 Lakeside Dr | 0.69mi | 3/2.0 (+1) | 2,047 (+9%) | 12mo | $250,000 | $122 | 37 |
| 20290 Youpon Ln | 0.71mi | 3/2.0 (+1) | 1,612 (-14%) | 2mo | $299,000 | $185 | 37 |
| 21002 Voyage Ln | 0.63mi | 3/2.5 (+1) | 1,678 (-11%) | 12mo | $257,900 | $154 | 36 |
| 20561 Lakeside Dr | 0.67mi | 3/2.0 (+1) | 1,749 (-7%) | 20mo | $275,000 | $157 | 36 |
Match score weights: distance 35% · size 25% · config 20% · recency 20%. Top-matched comps best support the ARV.
Projected returns pro-forma
-3.0% appreciation · 1.65% rent growth · sell at horizon
- IRR
- -16.3%
- Equity multiple
- 0.43×
- Total profit
- $-31,865
- Equity at exit
- $29,672
- IRR
- -10.6%
- Equity multiple
- 0.39×
- Total profit
- $-33,749
- Equity at exit
- $17,206
Cash invested: $55,720 (down + closing). Projections, not guarantees.
Landlord ↔ Tenant lean methodology
- Overall (STATE)
- 87 Strongly Landlord-Friendly
- State Texas
- 87 Strongly Landlord-Friendly · R+5
- County
- — inherits STATE
- City
- — inherits STATE
ZIP-level market 77365
- Home prices YoY
- -33.0%
- Rents YoY
- 1.6%
- Active inventory
- 955
- Price-to-rent
- 9.1×
Monthly cashflow live
- Estimated rent
- $1,820 medium interval (Pro) →
- Mortgage (P&I)
- −$1,044
- Tax from tax record
- −$268 /mo · $3,214/yr
- Insurance
- −$83
- HOA
- −$0
- Vacancy / Maint / Mgmt
- −$382
- Net cashflow
- $44
Break-even live
Sensitivity live
| Price | -10% $156 | -5% $100 | +0% $44 | +5% $-13 | +10% $-69 |
|---|---|---|---|---|---|
| Rent | -10% $-100 | -5% $-28 | +0% $44 | +5% $116 | +10% $187 |
| Rate | -1.0pp $144 | -0.5pp $94 | base $44 | +0.5pp $-8 | +1.0pp $-60 |
UW: 25.0% down · 7.5% · 30yr · 1.5% tax · 5.0% vac · 8.0% maint · 8.0% mgmt
Financing live
Cash to close
- Down payment
- $49,750
- Closing costs
- $5,970
- Reserves months
- —
- Total cash needed
- —
Loan-product check · same deal, 3 products live
Conventional
25% down · 7.5% · 30yr
- Down + closing
- —
- Monthly P&I
- —
- Monthly cashflow
- —
- DSCR
- —
- Eligible?
- —
Personal DTI + credit; lowest rate.
DSCR
20% down · 8.5% · 30yr
- Down + closing
- —
- Monthly P&I
- —
- Monthly cashflow
- —
- DSCR
- —
- Eligible?
- —
No personal income docs; deal must DSCR.
Hard money
10% down · 12.0% · 12mo
- Down + closing
- —
- Monthly P&I
- —
- Monthly cashflow
- —
- DSCR
- —
- Eligible?
- —
Short-term bridge; refi at stabilization.
Rent comps 2 comps
| Address | Beds | Baths | Sqft | Rent | $/sqft | DOM | Units | Dist |
|---|---|---|---|---|---|---|---|---|
| 16658 Moss Ln Porter, TX | 3.0 | 2.0 | 1402 | $1,750 | $1.25 | 26d | 1 | 0.60mi |
| 21019 Voyage Ln Porter, TX | 3.0 | 2.5 | 1678 | $1,795 | $1.07 | 45d | 1 | 0.65mi |
Listing history 11 events
-
2026-06-21days on market $199,000 Active 5 DOM
-
2026-06-18days on market $199,000 Active 2 DOM
-
2026-06-17statusdays on market $199,000 Active 1 DOM
-
2026-06-16days on market $199,000 Coming Soon 13 DOM
-
2026-06-15days on market $199,000 Coming Soon 12 DOM
-
2026-06-13days on market $199,000 Coming Soon 10 DOM
-
2026-06-09days on market $199,000 Coming Soon 6 DOM
-
2026-06-08days on market $199,000 Coming Soon 5 DOM
-
2026-06-07days on market $199,000 Coming Soon 4 DOM
-
2026-06-04remarks 699-char remark
-
2026-06-04$199,000 Coming Soon 1 DOM
ⓘ Source: listings_history table (triggers on properties + properties_extension) + one-shot
backfill from property_details.listing_events for pre-trigger history.
Tax reassessment forecast TX · Resets to sale price
- Current annual tax
- $3,214 · $268/mo
- Projected year-2 tax
- $3,642 · $303/mo
- Expected delta
- +$427/yr (+$36/mo · 13.3%)
ⓘ Screening estimate from a state-policy table — verify with the county assessor before closing.
Climate risk First Street
- Flood 3/10 Moderate FEMA zone X (unshaded) · 20% chance over 30 yrs
- Wildfire 2/10 Low
- Heat 8/10 Severe 7 d/yr ≥110°F today · 24 d/yr by 30 yrs out
- Wind 8/10 Severe 99% chance of damaging wind over 30 yrs
- Air quality 3/10 Moderate 3 unhealthy d/yr today · 3 by 30 yrs out
Nearby sold comps map
Loading sold comps map…
Walkable amenities ~0.75 mi
Loading nearby amenities…
Taxation est. · year 1
- Rental income
- $21,844
- − Mortgage interest
- −$11,147
- − Property taxes
- −$3,214
- − Insurance
- −$995
- − Repairs & maintenance
- −$1,747
- − Management
- −$1,747
- − Depreciation
- −$5,789
- Taxable loss
- −$2,797
- Est. tax savings @ 24.0%
- +$671
- After-tax cash flow
- $1,195/yr
For passive investors: Depreciation is non-cash, so a rental often shows a tax loss while cash-flowing — sheltering income. Rental losses are passive: they offset passive income freely, and up to $25,000/yr can offset ordinary (W-2) income if you actively participate and your MAGI is under $100k (phasing out to $0 by $150k); unused losses carry forward. On sale, claimed depreciation is recaptured at up to 25%, and gains may owe capital-gains tax (a 1031 exchange can defer both). Figures are a year-1 estimate at your 24.0% rate — not tax advice; consult a CPA.
Schools (NCES district)
- District
- New Caney ISD
- NCES district ID
- 4832400
- Math proficiency
- 31% ▼ -16.00%
- Reading proficiency
- 32% ▼ -6.00%
- Median HH income
- $55,380
- Composite
- 27.97/100
- National rank
- #6857
- State rank
- #570 of 826 in TX
Livability — Porter Heights
- Score
- 65/100
- State rank
- #663
- US rank
- #12479
Category grades
Schools grade is shown separately in the Schools card above.
Census & demographics
- Census place
- Porter Heights, TX
- County
- Montgomery County · 663,713 people
- Metro
- Houston-The Woodlands-Sugar Land, TX
- Population (ZIP)
- 46,418
- Household income
- $95,702
- Rent vs Own
- Severe rent burden
- 1016.0
Population outlook (Montgomery County) Hauer SSP2
- Today (2025)
- 713,896 people
- By 2030
- 805,263 · +12.8%
- By 2040
- 992,708 · +39.1%
- By 2050
- 1,179,590 · +65.2%
- By 2075
- 1,628,084 · +128.1%
- By 2100
- 1,937,880 · +171.5%
Race, ethnicity, and origin ACS 2023
- Neighborhood character
- Diverse neighborhood (Simpson 0.59)
- Race & ethnicity
- Hispanic / Latino 46% White 44% Two or more races 15% Black 5% Asian 3%
- Hispanic origin (detail)
- Mexican 39% Puerto Rican 1%
- Common ancestry
- Lithuanian 4% Slovak 2% Romanian 2%
- Foreign-born
- 18% · Canada
- Languages at home
- 59% English-only · Spanish 36% Other Indo-European 2% Russian/Polish/Slavic 1%
Political lean MEDSL · Montgomery
- 2024 margin
- Solid R (+45.5) · D 26.8% · R 72.3%
- 2008→2024 swing
- +7.2pp toward D · 2008: -52.7pp · 2024: -45.5pp
- All cycles
- 2024: R+45.5 2020: R+43.8 2016: R+51.4 2012: R+60.7 2008: R+52.7
Not yet ingested
- Civics
- —
Market trends
- HPI YoY
- ▼ -111.46%
- Current HPI
- 225.9903
- Rent YoY
- ▲ 1.65%
- Metro
- Houston-The Woodlands-Sugar Land, TX
- State GDP YoY
- ▲ 3.95%
- F500 in state
- 110
Industry mix (Fortune 500 HQ in TX)
| Industry | F500 HQs | Revenue |
|---|---|---|
| Energy | 16 | $1,198B |
|
||
| Technology | 5 | $198B |
|
||
| Engineering / Construction | 4 | $72B |
|
||
| Energy Services | 3 | $60B |
|
||
| Utilities | 3 | $41B |
|
||
| Healthcare | 2 | $330B |
|
||
Price history
3 events — show timeline
- 2026-06-04 Coming Soon $199,000 HARMLS
- 2006-08-28 Sold (Public Records) — Public Records
- 1990-10-19 Sold (Public Records) — Public Records
Property tax history
+19.1%/yrLatest (2025): $3,214 · +9.7% YoY. Source: county tax records.
Cash-flow waterfall
monthlySold comps — $/sqft
last 12 mo · ≤1 miLoading sold comps…