 🏷️ Likely Rental
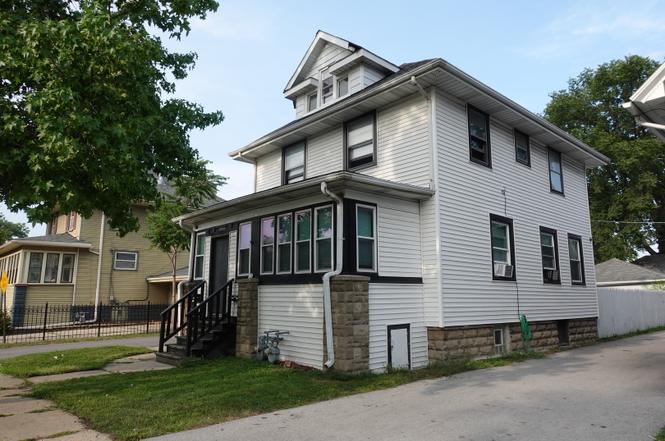
12715 S Greenwood St · Blue Island, IL
Flood risk 6/10 · Moderate
- FEMA flood zone
- X (unshaded)
- Chance of flooding over 30 yrs
- 0.74%
- Est. flood insurance / yr
- $473 – $860
Fire risk 1/10 · Minimal
- Est. fire insurance / yr
- $804 – $1,492
Heat risk 3/10 · Minor
- Hot days now (above 101°F)
- 7 days/yr
- Hot days in 30 yrs
- 15 days/yr
Wind risk 2/10 · Minimal
- Chance of severe wind over 30 yrs
- —
Air-quality risk 4/10 · Minor
- Unhealthy air days now
- 4 days/yr
- Unhealthy air days in 30 yrs
- 6 days/yr
Risk factors via First Street. Map © Google.
Why this score? — see what drove the B- grade
The composite is a weighted blend of 9 inputs, each scored 0–100. Each bar is that input's sub-score; the figure is the points it added to the 100-point composite (weight × sub-score).
- Cash flow +30.0/30.0
- 1% rule +10.0/10.0
- DSCR +10.0/10.0
- ARV discount +7.5/15.0
- Livability +3.9/5.0
- Rent growth +2.5/5.0
- Condition / age +2.5/5.0
- Schools +1.6/10.0
- Appreciation +0.0/10.0
$105,000
🖨 Deal sheet 📄 Offer letter ✓ Due diligence
Multi-family units
County records classify this as Multi-Family (2-4 Unit). Listing-text estimate: 1 unit. estimate disagrees with records
Listing remarks MLS
Great location on this vinyl sided two flat in the historical area of Blue Island. Tenant occupied first floor, vacant second floor, hardwood floors under carpets, window air conditioning units, full basement with storage and half bath, two car detached garage, new windows in first floor enclosed front porch. "See the possibilities."
Key facts
- Spacious backyard
- 3,441 sq ft lot
- 2 garage spots
Tags
Neighborhood map
What this means for you Summary
Snapshot
- This is a 4-bed/2.0-bath multifamily listed at $105k.
Deal economics
- At list price, monthly cash flow is $1k ($13k/yr) — positive.
- The deal already cash-flows at list — no discount required.
- Meets the 1% rule at list price ($2k rent vs $105k).
- Recommended offer: $103k (1.5% below list) — sets the bar for market timing.
- Cap rate 18.8% vs local median 6.5% in Blue Island — top-decile yield for the area; either an underpriced asset or a hidden risk that comps aren't pricing in. Stress-test before assuming the spread holds.
Location & tenants
- Location reads 77/100 on livability (#159 in IL, #2,964 nationally) — a middle-class / working-renter tenant base. Strengths: commute A+, cost of living A+, housing A+; Watch: employment C-, schools F, crime F.
- Chsd 218 (suburban): math 14% / reading 20% proficiency, ranked #454 of 620 in IL (top 73%) — low school quality limits family demand, transient renter base, plan for 1-2y turnover.
- Market conditions: 43 active listings in the ZIP; 7 comparable units currently listed for rent nearby; rentals at typical pace (median 15d on market — plan ~3-4 weeks tenant-placement turnaround); 6,272 units permitted in Cook County in 2024 (4,658 in 5+ unit buildings).
Forward outlook
- Local home prices are declining (-3.0%/yr); year-one equity from $726 of loan paydown is wiped out by about $3k of value loss. Plan a longer hold.
- At projected returns (-3.0% appreciation + 3.0% rent growth), your $29k cash investment doubles in ~3 years — after that, you're playing with house money.
Negotiation context
- It's been on market 17 days — a 2% lower offer ($103k) is reasonable based on typical stale-listing flexibility.
- 3 sale attempts since 11y ago; this cycle's ask has dropped $33k (24%) from the opening price — seller is motivated, your offer sets the floor, not the list.
- Current owner paid $63k; list at $105k implies a 67% gain — meaningful room to come down on a strong offer.
Risks & watch-outs
- Watch-outs: built in 1909 — expect roof / HVAC / electrical / plumbing capex.
- Climate carrying-cost: major flood risk — expect insurance premiums to compound above CPI over the hold.
Questions for the listing agent
- Built in 1909 — when were the roof, HVAC, electrical panel, plumbing, and water heater last replaced?
- Is there a deadline driving the sale (1031 exchange, divorce, estate, relocation)? That informs how much negotiation room exists.
- Schools are F-rated, which usually means shorter tenancies and higher turnover. Who's the typical renter profile here, and what's been the actual vacancy rate?
- Crime grade is F in this area — have there been break-ins, vandalism, or insurance claims at this property in the last 3 years? What carrier currently insures it and at what premium?
- What's the average days-on-market for RENTAL listings here right now (not sales)? A rising rental-DOM trend means longer vacancies and softer asking-rent achievability than the comps imply.
- What's the recent tenant-quality profile in this submarket — average credit score on applications, eviction rate, late-payment / NSF rate, and stable-employment percentage? A property-management company in the area should have these aggregated.
- How much new apartment / multifamily construction is in the pipeline within 1–3 miles? Heavy new supply (>2% of stock underway) typically softens rents 12–24 months out; light construction supports rent growth.
Investment metrics
- 1% rule
- 2.19% ✓
- Cap rate
- 18.75%
- Cash-on-cash
- 44.50%
- DSCR
- 2.98
- GRM
- 3.8
CMA / ARV
- ARV (on-the-fly)
- $685,388
- Comps found
- 1
Show comp detail 1 sale within ~0.75 mi
| Address | Dist | Beds/Ba | Sqft | Sold | Price | $/sf | Match |
|---|---|---|---|---|---|---|---|
| 12517 Elm St Unit 2 | 0.31mi | 3/2.0 (-1) | 1,723 (+6%) | 14mo | $725,000 | $421 | 59 |
Match score weights: distance 35% · size 25% · config 20% · recency 20%. Top-matched comps best support the ARV.
Projected returns pro-forma
-3.0% appreciation · 3.0% rent growth · sell at horizon
- IRR
- 41.5%
- Equity multiple
- 2.78×
- Total profit
- $52,456
- Equity at exit
- $15,656
- IRR
- 47.7%
- Equity multiple
- 5.60×
- Total profit
- $135,227
- Equity at exit
- $9,078
Cash invested: $29,400 (down + closing). Projections, not guarantees.
Landlord ↔ Tenant lean methodology
- Overall (STATE)
- 43 Moderately Tenant-Leaning
- State Illinois
- 43 Moderately Tenant-Leaning · D+7
- County
- — inherits STATE
- City
- — inherits STATE
ZIP-level market 60406
- Home prices YoY
- -26.8%
- Active inventory
- 43
- Price-to-rent
- 3.8×
Monthly cashflow live
- Estimated rent
- $2,299 high interval (Pro) →
- Mortgage (P&I)
- −$551
- Tax est. 1.5%
- −$131 /mo · $1,575/yr
- Insurance
- −$44
- HOA
- −$0
- Vacancy / Maint / Mgmt
- −$483
- Net cashflow
- $1,090
Break-even live
UW: 25.0% down · 7.5% · 30yr · 1.5% tax · 5.0% vac · 8.0% maint · 8.0% mgmt
Financing live
Cash to close
- Down payment
- $26,250
- Closing costs
- $3,150
- Reserves months
- —
- Total cash needed
- —
Loan-product check · same deal, 3 products live
Conventional
25% down · 7.5% · 30yr
- Down + closing
- —
- Monthly P&I
- —
- Monthly cashflow
- —
- DSCR
- —
- Eligible?
- —
Personal DTI + credit; lowest rate.
DSCR
20% down · 8.5% · 30yr
- Down + closing
- —
- Monthly P&I
- —
- Monthly cashflow
- —
- DSCR
- —
- Eligible?
- —
No personal income docs; deal must DSCR.
Hard money
10% down · 12.0% · 12mo
- Down + closing
- —
- Monthly P&I
- —
- Monthly cashflow
- —
- DSCR
- —
- Eligible?
- —
Short-term bridge; refi at stabilization.
Rent comps 7 comps
| Address | Beds | Baths | Sqft | Rent | $/sqft | DOM | Units | Dist |
|---|---|---|---|---|---|---|---|---|
| 2640 Vermont St Unit 1 Blue Island, IL | 3.0 | 1.5 | 1500 | $2,200 | $1.47 | 1d | 1 | 0.48mi |
| 2336 122nd St Unit 2 Blue Island, IL | 3.0 | 1.0 | 1340 | $1,900 | $1.42 | 20d | 1 | 0.71mi |
| 13308 Old Western Ave Unit 2 Blue Island, IL | 3.0 | 1.5 | 1350 | $2,200 | $1.63 | 11d | 1 | 0.76mi |
| 13308 Old Western Ave Unit 2 Blue Island, IL | 3.0 | 1.5 | 1350 | $2,200 | $1.63 | 22d | 1 | 0.76mi |
| 2261 136th St Blue Island, IL | 4.0 | 2.0 | 2230 | $2,500 | $1.12 | 16d | 1 | 1.25mi |
| 11706 S Artesian Ave Chicago, IL | 3.0 | 2.5 | 1299 | $3,400 | $2.62 | 1d | 1 | 1.29mi |
| 12111 S Justine St Chicago, IL | 3.0 | 1.5 | 1800 | $2,400 | $1.33 | 15d | 1 | 1.44mi |
Listing history 14 events
-
2026-04-28status Pending
-
2026-04-21price $105,000
-
2026-04-12status Temporarily No Showings
-
2025-08-10historical
-
2025-08-06$138,200 Active
-
2015-09-24soldstatus $63,000
-
2015-09-15soldstatus $63,000 Closed Sale 349-char remark
Show marketing remark (349 chars)
Great location on this vinyl sided two flat in the historical area of Blue Island. Tenant occupied first floor, vacant second floor, hardwood floors under carpets, window air conditioning units, full basement with storage and half bath, two car detached garage, new windows in first floor enclosed front porch. "See the possibilities."
-
2015-09-08status Pending 349-char remark
Show marketing remark (349 chars)
Great location on this vinyl sided two flat in the historical area of Blue Island. Tenant occupied first floor, vacant second floor, hardwood floors under carpets, window air conditioning units, full basement with storage and half bath, two car detached garage, new windows in first floor enclosed front porch. "See the possibilities."
-
2015-08-24status Contingent (Do Not Show) 349-char remark
Show marketing remark (349 chars)
Great location on this vinyl sided two flat in the historical area of Blue Island. Tenant occupied first floor, vacant second floor, hardwood floors under carpets, window air conditioning units, full basement with storage and half bath, two car detached garage, new windows in first floor enclosed front porch. "See the possibilities."
-
2015-08-08price $65,000 349-char remark
Show marketing remark (349 chars)
Great location on this vinyl sided two flat in the historical area of Blue Island. Tenant occupied first floor, vacant second floor, hardwood floors under carpets, window air conditioning units, full basement with storage and half bath, two car detached garage, new windows in first floor enclosed front porch. "See the possibilities."
-
2015-07-06price $79,900 349-char remark
Show marketing remark (349 chars)
Great location on this vinyl sided two flat in the historical area of Blue Island. Tenant occupied first floor, vacant second floor, hardwood floors under carpets, window air conditioning units, full basement with storage and half bath, two car detached garage, new windows in first floor enclosed front porch. "See the possibilities."
-
2015-05-22$100,000 New 349-char remark
Show marketing remark (349 chars)
Great location on this vinyl sided two flat in the historical area of Blue Island. Tenant occupied first floor, vacant second floor, hardwood floors under carpets, window air conditioning units, full basement with storage and half bath, two car detached garage, new windows in first floor enclosed front porch. "See the possibilities."
-
1986-05-01soldstatus $51,000
-
1979-08-17soldstatus $30,000
ⓘ Source: listings_history table (triggers on properties + properties_extension) + one-shot
backfill from property_details.listing_events for pre-trigger history.
Climate risk First Street
- Flood 6/10 Major FEMA zone X (unshaded) · 74% chance over 30 yrs
- Wildfire 1/10 Low
- Heat 3/10 Moderate 7 d/yr ≥101°F today · 15 d/yr by 30 yrs out
- Wind 2/10 Low
- Air quality 4/10 Moderate 4 unhealthy d/yr today · 6 by 30 yrs out
Nearby sold comps map
Loading sold comps map…
Walkable amenities ~0.75 mi
Loading nearby amenities…
Taxation est. · year 1
- Rental income
- $27,582
- − Mortgage interest
- −$5,882
- − Property taxes
- −$1,575
- − Insurance
- −$525
- − Repairs & maintenance
- −$2,207
- − Management
- −$2,207
- − Depreciation
- −$3,055
- Taxable income
- $12,133
- Est. tax owed @ 24.0%
- −$2,912
- After-tax cash flow
- $10,170/yr
For passive investors: Depreciation is non-cash, so a rental often shows a tax loss while cash-flowing — sheltering income. Rental losses are passive: they offset passive income freely, and up to $25,000/yr can offset ordinary (W-2) income if you actively participate and your MAGI is under $100k (phasing out to $0 by $150k); unused losses carry forward. On sale, claimed depreciation is recaptured at up to 25%, and gains may owe capital-gains tax (a 1031 exchange can defer both). Figures are a year-1 estimate at your 24.0% rate — not tax advice; consult a CPA.
Schools (NCES district)
- District
- Chsd 218
- NCES district ID
- 1706540
- Math proficiency
- 14% ▼ -4.00%
- Reading proficiency
- 20% ▼ -1.00%
- Median HH income
- $57,166
- Composite
- 16.09/100
- National rank
- #9235
- State rank
- #454 of 620 in IL
Livability — Blue Island
- Score
- 77/100
- State rank
- #159
- US rank
- #2964
Category grades
Schools grade is shown separately in the Schools card above.
Census & demographics
- Census place
- Blue Island, IL
- City population
- 24,887
- Population (ZIP)
- 24,887
Population outlook (Cook County) Hauer SSP2
- Today (2025)
- 5,347,519 people
- By 2030
- 5,357,703 · +0.2%
- By 2040
- 5,324,924 · -0.4%
- By 2050
- 5,230,762 · -2.2%
- By 2075
- 4,785,735 · -10.5%
- By 2100
- 4,188,836 · -21.7%
Race, ethnicity, and origin ACS 2023
- Neighborhood character
- Diverse neighborhood (Simpson 0.65)
- Race & ethnicity
- Hispanic / Latino 44% Black 34% White 19% Two or more races 8%
- Hispanic origin (detail)
- Mexican 39%
- Common ancestry
- Romanian 2% English 1% Iranian 1%
- Foreign-born
- 19% · Canada
- Languages at home
- 65% English-only · Spanish 33% Other Indo-European 1%
Political lean MEDSL · Cook
- 2024 margin
- Solid D (+42.0) · D 70.4% · R 28.4% · Other 1.2%
- 2008→2024 swing
- -11.4pp toward R · 2008: 53.4pp · 2024: 42.0pp
- All cycles
- 2024: D+42.0 2020: D+50.3 2016: D+53.0 2012: D+49.4 2008: D+53.4
Not yet ingested
- Civics
- —
Market trends
- HPI YoY
- ▼ -94.77%
- Current HPI
- 259.492
- Rent YoY
- —
- Metro
- —
- State GDP YoY
- ▲ 1.59%
- F500 in state
- 60
Industry mix (Fortune 500 HQ in IL)
| Industry | F500 HQs | Revenue |
|---|---|---|
| Insurance | 4 | $201B |
|
||
| Consumer Goods | 4 | $87B |
|
||
| Industrial Machinery | 3 | $64B |
|
||
| Healthcare | 2 | $55B |
|
||
| Retail / Pharmacy | 1 | $148B |
|
||
| Agriculture / Food | 1 | $86B |
|
||
Price history
+250.0% since first listed14 events — show timeline
- 2026-04-28 Pending — MRED as Distributed by MLS Grid
- 2026-04-21 Price Changed $105,000 MRED as Distributed by MLS Grid
- 2026-04-12 Relisted — MRED as Distributed by MLS Grid
- 2025-08-10 Listing Removed — MRED as Distributed by MLS Grid
- 2025-08-06 Listed $138,200 MRED as Distributed by MLS Grid
- 2015-09-24 Sold (Public Records) $63,000 Public Records
- 2015-09-15 Sold (MLS) $63,000 MRED as Distributed by MLS Grid
- 2015-09-08 Pending — MRED as Distributed by MLS Grid
- 2015-08-24 Pending — MRED as Distributed by MLS Grid
- 2015-08-08 Price Changed $65,000 MRED as Distributed by MLS Grid
- 2015-07-06 Price Changed $79,900 MRED as Distributed by MLS Grid
- 2015-05-22 Listed $100,000 MRED as Distributed by MLS Grid
- 1986-05-01 Sold (Public Records) $51,000 Public Records
- 1979-08-17 Sold (Public Records) $30,000 Public Records
Property tax history
+2.9%/yrLatest (2023): $7,397 · +17.8% YoY. Source: county tax records.
Cash-flow waterfall
monthlySold comps — $/sqft
last 12 mo · ≤1 miLoading sold comps…