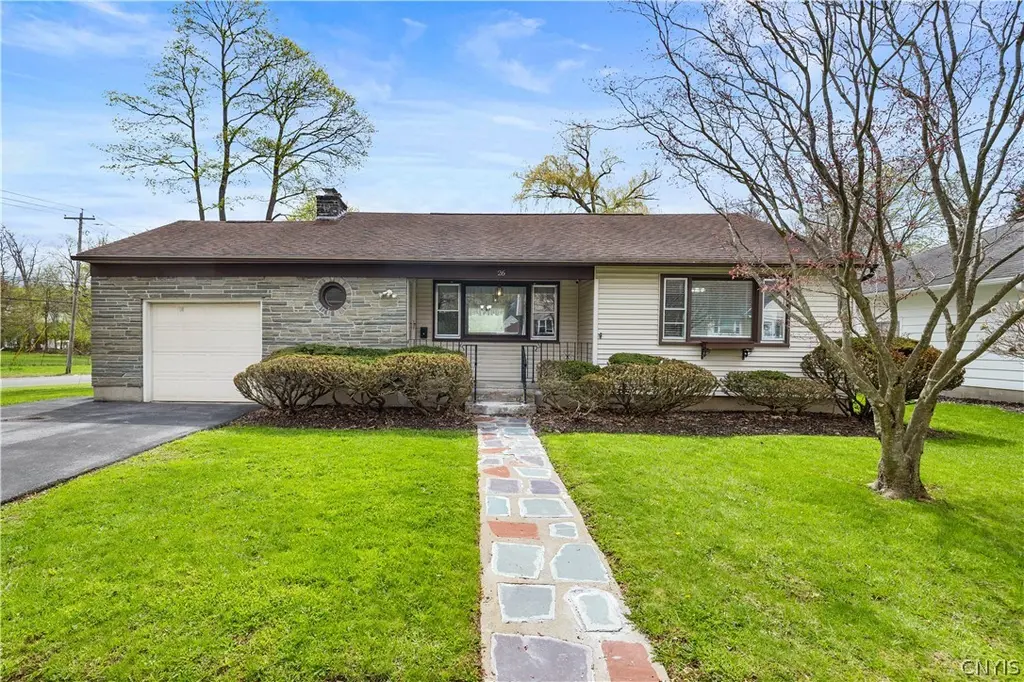
26 Geer Ave · Utica, NY
Flood risk 1/10 · Minimal
- FEMA flood zone
- X (unshaded)
- Chance of flooding over 30 yrs
- 0.0%
- Est. flood insurance / yr
- $473 – $860
Fire risk 1/10 · Minimal
- Est. fire insurance / yr
- $691 – $1,283
Heat risk 2/10 · Minimal
- Hot days now (above 95°F)
- 7 days/yr
- Hot days in 30 yrs
- 16 days/yr
Wind risk 1/10 · Minimal
- Chance of severe wind over 30 yrs
- 1.0%
Air-quality risk 2/10 · Minimal
- Unhealthy air days now
- 0 days/yr
- Unhealthy air days in 30 yrs
- 2 days/yr
Risk factors via First Street. Map © Google.
Why this score? — see what drove the F grade
The composite is a weighted blend of 9 inputs, each scored 0–100. Each bar is that input's sub-score; the figure is the points it added to the 100-point composite (weight × sub-score).
- Appreciation +10.0/10.0
- Cash flow +8.1/30.0
- Livability +4.0/5.0
- Schools +2.9/10.0
- 1% rule +2.5/10.0
- Rent growth +2.5/5.0
- Condition / age +2.5/5.0
- DSCR +2.1/10.0
- ARV discount +0.0/15.0
$224,900
🖨 Deal sheet (PDF) 📄 Offer letter ✓ Due diligence
Listing remarks MLS
Meticulous Ranch - gleaming hardwood floors, large light filled living room with stone fireplace & gas logs. Open kitchen & dining area, 3 BR, 1 BA, fabulous screened porch, fenced private yard, immaculate dry basement.
Key facts
- Full dry basement
- Fully fenced yard
- Corner lot
Tags
Neighborhood map
What this means for you Summary
Snapshot
- This is a 3-bed/1.0-bath single-family listed at $225k.
Deal economics
- At list price, monthly cash flow is $-223 ($-3k/yr) — negative.
- To cash-flow at today's rent, offer at most $193k (14.4% below list).
- To meet the 1% rule (rent ≥ 1% of price), the offer needs to be $168k (25.1% below list).
- Recommended offer: $168k (25.1% below list) — sets the bar for 1% rule.
- Cap rate 5.1% vs local median 7.8% in Utica — below-typical yield; the buyer is paying a premium for something (appreciation thesis, condition, location) that the cap rate doesn't capture.
Location & tenants
- Location reads 80/100 on livability (#104 in NY, #1,589 nationally) — a professional / high-income tenant draw. Strengths: commute A+, cost of living A+, housing A+; Watch: employment D, crime F.
- Utica City School District (urban): math 33% / reading 38% proficiency, ranked #562 of 590 in NY (top 95%) — families likely to look elsewhere, expect single-tenant / working-renter base with shorter leases; 71% free/reduced lunch — lower-income household profile, screen leases tightly.
- Zoned schools: John F Hughes Elementary School (math 27% / reading 37%, grade F, #1,646 of 2,108 statewide, top 80%, 355 students, 81% FRL); Senator James H Donovan Middle School (math 19% / reading 30%, grade F, #611 of 729 statewide, top 88%, 730 students, 84% FRL); Thomas R Proctor High School (math 86% / reading 62%, grade B+, #659 of 1,100 statewide, top 60%, 2,675 students, 76% FRL).
- Market conditions: 145 active listings in the ZIP; 2 comparable units currently listed for rent nearby; 204 units permitted in Oneida County in 2024 (68 in 5+ unit buildings).
- This rent runs 38% of the median local income ($53k/yr) — at the standard rent-burdened threshold; future hikes will face affordability resistance.
Forward outlook
- In year one you build about $24k of equity ($2k loan paydown + $22k appreciation (10.0% local appreciation)).
- Oneida County population projected at -12% by 2050 — secular population decline; favor cash flow + early exit over multi-decade hold.
- By year 2, paydown + projected appreciation supports a ~$39k cash-out refi (75% LTV) — recoverable capital for the next deal without selling this one.
Negotiation context
- Only 5 days on market — expect competitive offers; lowballing is unlikely to land.
- 5 sale attempts since 28y ago with the ask held roughly flat each time — persistent listings suggest the price (not the market) is what's stuck; bring a comps-based counter.
- Current owner paid $118k; list at $225k implies a 91% gain — meaningful room to come down on a strong offer.
Questions for the listing agent
- What do current leases actually rent for vs. the listed asking? Can we see a recent rent roll and the last 12 months of T-12 income?
- Built in 1960 — when were the roof, HVAC, electrical panel, plumbing, and water heater last replaced?
- Is there a deadline driving the sale (1031 exchange, divorce, estate, relocation)? That informs how much negotiation room exists.
- Schools are D-rated, which usually means shorter tenancies and higher turnover. Who's the typical renter profile here, and what's been the actual vacancy rate?
- Crime grade is F in this area — have there been break-ins, vandalism, or insurance claims at this property in the last 3 years? What carrier currently insures it and at what premium?
- The area grade is low — what's the realistic commute time and amenity access for the typical tenant pool here? Any planned neighborhood developments (good or bad) we should know about?
- What's the average days-on-market for RENTAL listings here right now (not sales)? A rising rental-DOM trend means longer vacancies and softer asking-rent achievability than the comps imply.
- What's the recent tenant-quality profile in this submarket — average credit score on applications, eviction rate, late-payment / NSF rate, and stable-employment percentage? A property-management company in the area should have these aggregated.
- How much new for-sale + rental construction is in the pipeline within 1–3 miles? Heavy new supply typically softens prices + rents 12–24 months out; constrained supply supports both.
Investment metrics
- 1% rule
- 0.75% ✗
- Cap rate
- 5.10%
- Cash-on-cash
- -4.26%
- DSCR
- 0.81
- GRM
- 11.1
CMA / ARV
- ARV (on-the-fly)
- $180,336
- Comps found
- 12
Show comp detail 12 sales within ~0.75 mi
| Address | Dist | Beds/Ba | Sqft | Sold | Price | $/sf | Match |
|---|---|---|---|---|---|---|---|
| 20 Geer Ave | 0.03mi | 3/1.0 | 1,148 (-1%) | 18mo | $219,000 | $191 | 82 |
| 60 Leslie Ave | 0.31mi | 3/2.0 | 1,152 (-0%) | 10mo | $145,000 | $126 | 72 |
| 1903 Butterfield Ave | 0.56mi | 3/1.0 | 1,151 (-0%) | 2mo | $75,000 | $65 | 72 |
| 134 Roosevelt Dr | 0.67mi | 3/1.5 | 1,184 (+2%) | 8mo | $213,000 | $180 | 57 |
| 5 Harriet St | 0.36mi | 3/1.5 | 1,298 (+12%) | 11mo | $215,000 | $166 | 51 |
| 817 Mildred Ave | 0.74mi | 3/1.5 | 1,120 (-3%) | 9mo | $174,900 | $156 | 50 |
| 18 Eastwood Ave | 0.63mi | 2/2.0 (-1) | 1,208 (+4%) | 12mo | $290,000 | $240 | 44 |
| 110 Roosevelt Dr | 0.62mi | 3/1.5 | 1,231 (+6%) | 18mo | $102,000 | $83 | 43 |
| 109 Dryden Ave | 0.67mi | 2/1.0 (-1) | 1,040 (-10%) | 11mo | $194,900 | $187 | 38 |
| 2642 Oneida St | 0.63mi | 2/1.0 (-1) | 1,281 (+11%) | 14mo | $182,500 | $142 | 36 |
| 2 Parkside Ct | 0.57mi | 4/1.5 (+1) | 1,320 (+14%) | 15mo | $150,000 | $114 | 31 |
| 828 Symonds Pl | 0.74mi | 3/1.0 | 1,279 (+11%) | 21mo | $180,000 | $141 | 30 |
Match score weights: distance 35% · size 25% · config 20% · recency 20%. Top-matched comps best support the ARV.
Projected returns pro-forma
10.0% appreciation · 3.0% rent growth · sell at horizon
- IRR
- 21.3%
- Equity multiple
- 2.72×
- Total profit
- $108,280
- Equity at exit
- $202,608
- IRR
- 19.2%
- Equity multiple
- 6.24×
- Total profit
- $330,110
- Equity at exit
- $436,931
Cash invested: $62,972 (down + closing). Projections, not guarantees.
Landlord ↔ Tenant lean methodology
- Overall (STATE)
- 15 Strongly Tenant-Friendly
- State New York
- 15 Strongly Tenant-Friendly · D+10
- County
- — inherits STATE
- City
- — inherits STATE
ZIP-level market 13501
- Home prices YoY
- 5.6%
- Active inventory
- 145
- Price-to-rent
- 11.1×
Monthly cashflow live
- Estimated rent
- $1,685 medium interval (Pro) →
- Mortgage (P&I)
- −$1,179
- Tax est. 1.5%
- −$281 /mo · $3,374/yr
- Insurance
- −$94
- HOA
- −$0
- Vacancy / Maint / Mgmt
- −$354
- Net cashflow
- $-223
Break-even live
Sensitivity live
| Price | -10% $-68 | -5% $-146 | +0% $-223 | +5% $-301 | +10% $-379 |
|---|---|---|---|---|---|
| Rent | -10% $-357 | -5% $-290 | +0% $-223 | +5% $-157 | +10% $-90 |
| Rate | -1.0pp $-110 | -0.5pp $-166 | base $-223 | +0.5pp $-282 | +1.0pp $-341 |
UW: 25.0% down · 7.5% · 30yr · 1.5% tax · 5.0% vac · 8.0% maint · 8.0% mgmt
Financing live
Cash to close
- Down payment
- $56,225
- Closing costs
- $6,747
- Reserves months
- —
- Total cash needed
- —
Loan-product check · same deal, 3 products live
Conventional
25% down · 7.5% · 30yr
- Down + closing
- —
- Monthly P&I
- —
- Monthly cashflow
- —
- DSCR
- —
- Eligible?
- —
Personal DTI + credit; lowest rate.
DSCR
20% down · 8.5% · 30yr
- Down + closing
- —
- Monthly P&I
- —
- Monthly cashflow
- —
- DSCR
- —
- Eligible?
- —
No personal income docs; deal must DSCR.
Hard money
10% down · 12.0% · 12mo
- Down + closing
- —
- Monthly P&I
- —
- Monthly cashflow
- —
- DSCR
- —
- Eligible?
- —
Short-term bridge; refi at stabilization.
Rent comps 2 comps
| Address | Beds | Baths | Sqft | Rent | $/sqft | DOM | Units | Dist |
|---|---|---|---|---|---|---|---|---|
| 1503 Fox Pl Utica, NY | 3.0 | 1.0 | 1119 | $2,000 | $1.79 | 45d | 1 | 1.08mi |
| 11 Noyes St Unit 4 Utica, NY | 2.0 | 1.0 | 1000 | $1,125 | $1.12 | 45d | 1 | 1.38mi |
Listing history 11 events
-
2026-04-28status Pending
-
2026-04-23$224,900 Active
-
2025-12-04historical Active Under Contract
-
2025-11-24price $234,900
-
2025-11-12$239,900 Active
-
2013-08-09soldstatus $118,000 231-char remark
Show marketing remark (231 chars)
Meticulous Ranch - gleaming hardwood floors, large light filled living room with stone fireplace & gas logs. Open kitchen & dining area, 3 BR, 1 BA, fabulous screened porch, fenced private yard, immaculate dry basement.
-
2012-10-16$125,900 231-char remark
Show marketing remark (231 chars)
Meticulous Ranch - gleaming hardwood floors, large light filled living room with stone fireplace & gas logs. Open kitchen & dining area, 3 BR, 1 BA, fabulous screened porch, fenced private yard, immaculate dry basement.
-
2006-08-08soldstatus $130,000
-
2006-04-26$135,900
-
1998-09-14historical
-
1998-05-14$59,900
ⓘ Source: listings_history table (triggers on properties + properties_extension) + one-shot
backfill from property_details.listing_events for pre-trigger history.
Climate risk First Street
- Flood 1/10 Low FEMA zone X (unshaded) · 0% chance over 30 yrs
- Wildfire 1/10 Low
- Heat 2/10 Low 7 d/yr ≥95°F today · 16 d/yr by 30 yrs out
- Wind 1/10 Low 100% chance of damaging wind over 30 yrs
- Air quality 2/10 Low 0 unhealthy d/yr today · 2 by 30 yrs out
Nearby sold comps map
Loading sold comps map…
Walkable amenities ~0.75 mi
Loading nearby amenities…
Taxation est. · year 1
- Rental income
- $20,214
- − Mortgage interest
- −$12,598
- − Property taxes
- −$3,374
- − Insurance
- −$1,124
- − Repairs & maintenance
- −$1,617
- − Management
- −$1,617
- − Depreciation
- −$6,543
- Taxable loss
- −$6,658
- Est. tax savings @ 24.0%
- +$1,598
- After-tax cash flow
- $-1,083/yr
For passive investors: Depreciation is non-cash, so a rental often shows a tax loss while cash-flowing — sheltering income. Rental losses are passive: they offset passive income freely, and up to $25,000/yr can offset ordinary (W-2) income if you actively participate and your MAGI is under $100k (phasing out to $0 by $150k); unused losses carry forward. On sale, claimed depreciation is recaptured at up to 25%, and gains may owe capital-gains tax (a 1031 exchange can defer both). Figures are a year-1 estimate at your 24.0% rate — not tax advice; consult a CPA.
Schools (NCES district)
- District
- Utica City School District
- NCES district ID
- 3629370
- Math proficiency
- 33% ▼ -7.00%
- Reading proficiency
- 38% ▲ 2.00%
- Median HH income
- $31,834
- Composite
- 29.01/100
- National rank
- #6613
- State rank
- #562 of 590 in NY
Livability — Utica
- Score
- 80/100
- State rank
- #104
- US rank
- #1589
Category grades
Schools grade is shown separately in the Schools card above.
Census & demographics
- Census place
- Utica, NY
- County
- Oneida County · 89,710 people
- City population
- 72,968
- Metro
- Utica-Rome, NY
- Population (ZIP)
- 38,931
- Household income
- $52,548
- Rent vs Own
- Severe rent burden
- 2251.0
Population outlook (Oneida County) Hauer SSP2
- Today (2025)
- 225,223 people
- By 2030
- 220,384 · -2.1%
- By 2040
- 209,071 · -7.2%
- By 2050
- 197,920 · -12.1%
- By 2075
- 175,541 · -22.1%
- By 2100
- 148,491 · -34.1%
Race, ethnicity, and origin ACS 2023
- Neighborhood character
- Highly diverse neighborhood (Simpson 0.70)
- Race & ethnicity
- White 49% Two or more races 15% Hispanic / Latino 14% Black 14% Asian 14%
- Hispanic origin (detail)
- Puerto Rican 8% Dominican 4%
- Common ancestry
- American 8% Romanian 3% Lithuanian 1%
- Foreign-born
- 25% · Canada, Philippines, Vietnam
- Languages at home
- 62% English-only · Other Asian/Pacific 11% Russian/Polish/Slavic 10% Spanish 9%
Political lean MEDSL · Oneida
- 2024 margin
- Strong R (+21.3) · D 39.4% · R 60.6%
- 2008→2024 swing
- -15.2pp toward R · 2008: -6.1pp · 2024: -21.3pp
- All cycles
- 2024: R+21.3 2020: R+15.5 2016: R+21.1 2012: R+5.3 2008: R+6.1
Not yet ingested
- Civics
- —
Market trends
- HPI YoY
- ▲ 20.28%
- Current HPI
- 382.3726
- Rent YoY
- —
- Metro
- Utica-Rome, NY
- State GDP YoY
- ▲ 2.60%
- F500 in state
- 92
Industry mix (Fortune 500 HQ in NY)
| Industry | F500 HQs | Revenue |
|---|---|---|
| Financial Services | 10 | $950B |
|
||
| Consumer Goods | 9 | $162B |
|
||
| Insurance | 4 | $225B |
|
||
| Telecommunications | 2 | $144B |
|
||
| Pharmaceuticals | 2 | $112B |
|
||
| Media / Entertainment | 2 | $69B |
|
||
Price history
+275.5% since first listed11 events — show timeline
- 2026-04-28 Pending — CNYIS
- 2026-04-23 Listed $224,900 CNYIS
- 2025-12-04 Contingent — CNYIS
- 2025-11-24 Price Changed $234,900 CNYIS
- 2025-11-12 Listed $239,900 CNYIS
- 2013-08-09 Sold (MLS) $118,000 CNYIS
- 2012-10-16 Listed $125,900 CNYIS
- 2006-08-08 Sold (MLS) $130,000 CNYIS
- 2006-04-26 Listed $135,900 CNYIS
- 1998-09-14 Listing Removed — CNYIS
- 1998-05-14 Listed $59,900 CNYIS
Cash-flow waterfall
monthlySold comps — $/sqft
last 12 mo · ≤1 miLoading sold comps…