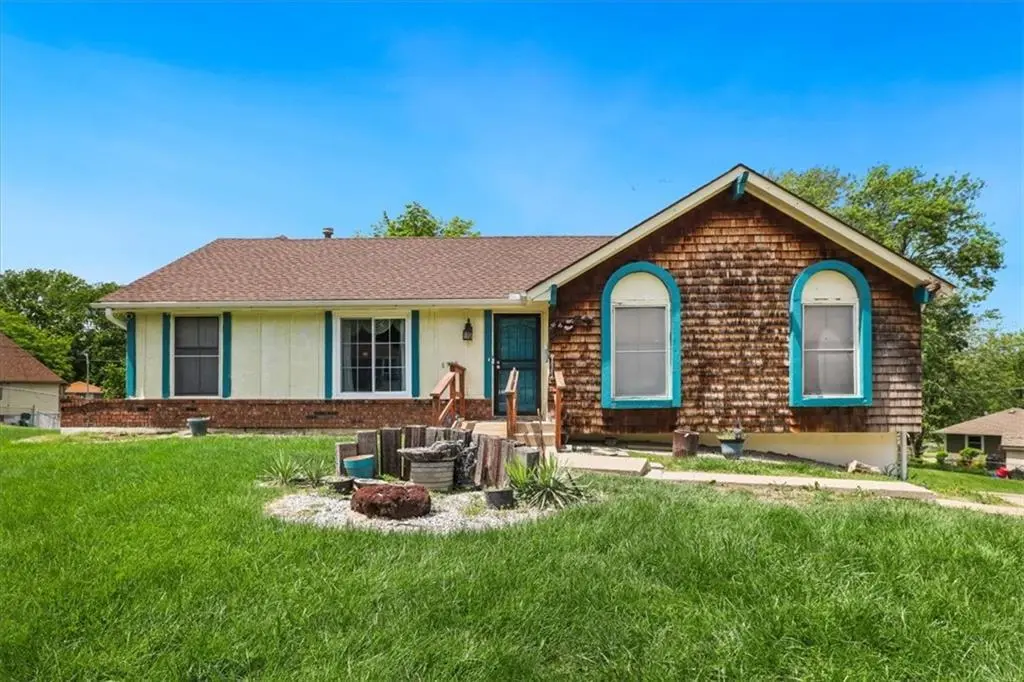
8922 Tennessee Ave · Kansas City, MO
Flood risk 1/10 · Minimal
- FEMA flood zone
- X (unshaded)
- Chance of flooding over 30 yrs
- 0.0%
- Est. flood insurance / yr
- $473 – $860
Fire risk 1/10 · Minimal
- Est. fire insurance / yr
- $1,054 – $1,958
Heat risk 4/10 · Minor
- Hot days now (above 106°F)
- 7 days/yr
- Hot days in 30 yrs
- 17 days/yr
Wind risk 2/10 · Minimal
- Chance of severe wind over 30 yrs
- —
Air-quality risk 3/10 · Minor
- Unhealthy air days now
- 3 days/yr
- Unhealthy air days in 30 yrs
- 5 days/yr
Risk factors via First Street. Map © Google.
Why this score? — see what drove the D grade
The composite is a weighted blend of 9 inputs, each scored 0–100. Each bar is that input's sub-score; the figure is the points it added to the 100-point composite (weight × sub-score).
- ARV discount +15.0/15.0
- Cash flow +11.6/30.0
- Livability +3.9/5.0
- DSCR +3.4/10.0
- Rent growth +3.3/5.0
- 1% rule +3.0/10.0
- Condition / age +2.5/5.0
- Schools +1.1/10.0
- Appreciation +0.0/10.0
$200,000
🖨 Deal sheet (PDF) 📄 Offer letter ✓ Due diligence
Key facts
- 0.3 acre lot
- 2 garage spots
- Built 1973
Property features AI
Exterior
- Parking: Attached 2-car garage
- Utilities: Public water; Public sewer
- Home design: Single-family residence; Ranch style
- Construction: Board & batten siding; Brick trim; Shingle siding; Composition roof
- Exterior features: Fenced yard (other); Lot approximately 13,276 sq ft
Interior
- Kitchen: Eat-in kitchen (kitchen-dining combo)
- Bedrooms: 3 bedrooms
- Flooring: Carpet; Tile; Vinyl
- Bathrooms: 3 full bathrooms
- Heating & cooling: Natural gas heating; Electric cooling (central air)
- Interior features: Finished basement; Family room with fireplace; Eat-in kitchen / kitchen-dining combo; Ranch floor plan
- Laundry & utility: Dedicated laundry room
Neighborhood map
What this means for you Summary
Snapshot
- This is a 3-bed/2.0-bath single-family listed at $200k.
Deal economics
- At list price, monthly cash flow is $-63 ($-751/yr) — negative.
- To cash-flow at today's rent, offer at most $189k (5.5% below list).
- To meet the 1% rule (rent ≥ 1% of price), the offer needs to be $160k (19.8% below list).
- Recommended offer: $160k (19.8% below list) — sets the bar for 1% rule.
- Cap rate 5.9% vs local median 3.9% in Kansas City — top-decile yield for the area; either an underpriced asset or a hidden risk that comps aren't pricing in. Stress-test before assuming the spread holds.
Location & tenants
- Location reads 78/100 on livability (#28 in MO, #2,671 nationally) — a middle-class / working-renter tenant base. Strengths: amenities A+, commute A+, cost of living A+; Watch: crime F.
- Hickman Mills C-1 (urban): math 8% / reading 18% proficiency, ranked #314 of 324 in MO (top 97%) — low school quality limits family demand, transient renter base, plan for 1-2y turnover; 78% free/reduced lunch — lower-income household profile, screen leases tightly.
- Zoned schools: Dobbs Elementary (math 8% / reading 17%, grade F, #1,007 of 1,115 statewide, top 91%, 322 students, 100% FRL); Smith-Hale Middle (math 7% / reading 19%, grade F, #368 of 391 statewide, top 94%, 770 students, 100% FRL); Ruskin High School (math 8% / reading 47%, grade F, #416 of 521 statewide, top 80%, 1,273 students, 100% FRL) — zoned schools average 100% FRL vs 78% district-wide (22 pts higher); higher-poverty schools than district average — tighter screening recommended.
- Market conditions: Rents rising (+3.1%/yr); 140 active listings in the ZIP; 35 comparable units currently listed for rent nearby; rentals at typical pace (median 26d on market — plan ~3-4 weeks tenant-placement turnaround); 40% of comp listings sitting > 30 days — soft ceiling on asking rent; 4,002 units permitted in Jackson County in 2024 (2,271 in 5+ unit buildings).
- This rent runs 33% of the median local income ($59k/yr) — at the standard rent-burdened threshold; future hikes will face affordability resistance.
Forward outlook
- Local home prices are declining (-3.0%/yr); year-one equity from $1k of loan paydown is wiped out by about $6k of value loss. Plan a longer hold.
- Jackson County population projected at +4% by 2050 — modest demand growth; plan on rents tracking national, not racing it.
Negotiation context
- Only 12 days on market — expect competitive offers; lowballing is unlikely to land.
Questions for the listing agent
- What do current leases actually rent for vs. the listed asking? Can we see a recent rent roll and the last 12 months of T-12 income?
- Built in 1973 — when were the roof, HVAC, electrical panel, plumbing, and water heater last replaced?
- Is there a deadline driving the sale (1031 exchange, divorce, estate, relocation)? That informs how much negotiation room exists.
- Crime grade is F in this area — have there been break-ins, vandalism, or insurance claims at this property in the last 3 years? What carrier currently insures it and at what premium?
- The area grade is low — what's the realistic commute time and amenity access for the typical tenant pool here? Any planned neighborhood developments (good or bad) we should know about?
- What's the average days-on-market for RENTAL listings here right now (not sales)? A rising rental-DOM trend means longer vacancies and softer asking-rent achievability than the comps imply.
- What's the recent tenant-quality profile in this submarket — average credit score on applications, eviction rate, late-payment / NSF rate, and stable-employment percentage? A property-management company in the area should have these aggregated.
- How much new for-sale + rental construction is in the pipeline within 1–3 miles? Heavy new supply typically softens prices + rents 12–24 months out; constrained supply supports both.
Investment metrics
- 1% rule
- 0.80% ✗
- Cap rate
- 5.92%
- Cash-on-cash
- -1.34%
- DSCR
- 0.94
- GRM
- 10.4
CMA / ARV
- ARV (median comp)
- $247,286
- List price
- $200,000
- Delta
- -19.12%
- Verdict
- UNDERPRICED
- Comps
- 20 within 1.0 mi
Show comp detail 12 sales within ~0.75 mi
| Address | Dist | Beds/Ba | Sqft | Sold | Price | $/sf | Match |
|---|---|---|---|---|---|---|---|
| 8916 E 89th Ter | 0.06mi | 3/1.5 | 1,320 (-1%) | 6mo | $225,000 | $170 | 88 |
| 8919 Stark Ave | 0.10mi | 3/1.5 | 1,304 (-2%) | 2mo | $164,900 | $126 | 88 |
| 8925 E 89th St | 0.12mi | 3/1.5 | 1,380 (+3%) | 6mo | $200,000 | $145 | 81 |
| 8602 E 91st Ter | 0.39mi | 3/1.5 | 1,300 (-2%) | 1mo | $140,000 | $108 | 75 |
| 8608 Spring Valley Rd | 0.47mi | 3/2.0 | 1,301 (-2%) | 3mo | $200,000 | $154 | 71 |
| 8501 E 93rd St | 0.63mi | 3/2.0 | 1,300 (-2%) | 0mo | $227,900 | $175 | 66 |
| 8718 Glenwood Ave | 0.55mi | 3/1.5 | 1,296 (-3%) | 4mo | $187,000 | $144 | 65 |
| 8821 Lane Ave | 0.25mi | 4/2.5 (+1) | 1,475 (+11%) | 2mo | $285,000 | $193 | 62 |
| 9210 Marsh Ave | 0.70mi | 3/2.0 | 1,300 (-2%) | 3mo | $250,000 | $192 | 60 |
| 9414 Lewis Ave | 0.62mi | 3/1.0 | 1,300 (-2%) | 3mo | $174,900 | $135 | 60 |
| 8818 James A Reed Rd | 0.67mi | 3/1.5 | 1,421 (+6%) | 8mo | $180,000 | $127 | 49 |
| 9005 E 84th St | 0.74mi | 3/2.0 | 1,160 (-13%) | 2mo | $215,000 | $185 | 42 |
Match score weights: distance 35% · size 25% · config 20% · recency 20%. Top-matched comps best support the ARV.
Projected returns pro-forma
-3.0% appreciation · 3.07% rent growth · sell at horizon
- IRR
- -18.4%
- Equity multiple
- 0.35×
- Total profit
- $-36,290
- Equity at exit
- $29,821
- IRR
- -10.7%
- Equity multiple
- 0.35×
- Total profit
- $-36,301
- Equity at exit
- $17,292
Cash invested: $56,000 (down + closing). Projections, not guarantees.
Landlord ↔ Tenant lean methodology
- Overall (STATE)
- 81 Strongly Landlord-Friendly
- State Missouri
- 81 Strongly Landlord-Friendly · R+10
- County
- — inherits STATE
- City
- — inherits STATE
ZIP-level market 64138
- Rents YoY
- 3.1%
- Active inventory
- 140
- Price-to-rent
- 10.4×
Monthly cashflow live
- Estimated rent
- $1,604 high interval (Pro) →
- Mortgage (P&I)
- −$1,049
- Tax from tax record
- −$198 /mo · $2,371/yr
- Insurance
- −$83
- HOA
- −$0
- Vacancy / Maint / Mgmt
- −$337
- Net cashflow
- $-63
Break-even live
Sensitivity live
| Price | -10% $51 | -5% $-6 | +0% $-63 | +5% $-119 | +10% $-176 |
|---|---|---|---|---|---|
| Rent | -10% $-189 | -5% $-126 | +0% $-63 | +5% $1 | +10% $64 |
| Rate | -1.0pp $38 | -0.5pp $-12 | base $-63 | +0.5pp $-114 | +1.0pp $-167 |
UW: 25.0% down · 7.5% · 30yr · 1.5% tax · 5.0% vac · 8.0% maint · 8.0% mgmt
Financing live
Cash to close
- Down payment
- $50,000
- Closing costs
- $6,000
- Reserves months
- —
- Total cash needed
- —
Loan-product check · same deal, 3 products live
Conventional
25% down · 7.5% · 30yr
- Down + closing
- —
- Monthly P&I
- —
- Monthly cashflow
- —
- DSCR
- —
- Eligible?
- —
Personal DTI + credit; lowest rate.
DSCR
20% down · 8.5% · 30yr
- Down + closing
- —
- Monthly P&I
- —
- Monthly cashflow
- —
- DSCR
- —
- Eligible?
- —
No personal income docs; deal must DSCR.
Hard money
10% down · 12.0% · 12mo
- Down + closing
- —
- Monthly P&I
- —
- Monthly cashflow
- —
- DSCR
- —
- Eligible?
- —
Short-term bridge; refi at stabilization.
Rent comps 35 comps
| Address | Beds | Baths | Sqft | Rent | $/sqft | DOM | Units | Dist |
|---|---|---|---|---|---|---|---|---|
| 8921 E 90th Ter Kansas City, MO | 4.0 | 2.5 | 1298 | $1,831 | $1.41 | 25d | 1 | 0.10mi |
| 9214 Farley Ave Kansas City, MO | 3.0 | 2.0 | 1060 | $1,686 | $1.59 | 14d | 1 | 0.28mi |
| 8713 E 92nd Pl Kansas City, MO | 3.0 | 2.0 | 1073 | $1,550 | $1.44 | 45d | 1 | 0.38mi |
| 8509 E 91st St Kansas City, MO | 3.0 | 1.5 | 1350 | $1,350 | $1.00 | 45d | 1 | 0.40mi |
| 8506 E 91st Ter Kansas City, MO | 3.0 | 1.5 | 1020 | $1,450 | $1.42 | 18d | 1 | 0.42mi |
| 9309 Farley Ave Kansas City, MO | 3.0 | 2.0 | 999 | $1,411 | $1.41 | 5d | 1 | 0.44mi |
| 9307 Stark Ave Kansas City, MO | 3.0 | 2.0 | 1073 | $1,385 | $1.29 | 45d | 1 | 0.44mi |
| 8620 E Utopia Dr Raytown, MO | 1.0–3.0 | 1.0–2.0 | 854 | $1,249 | $1.46 | 3d | 10 | 0.46mi |
| 8700 E 87th St Raytown, MO | 3.0 | 2.0 | 1032 | $1,481 | $1.44 | 19d | 1 | 0.48mi |
| 8501 E 92nd St Kansas City, MO | 3.0 | 1.5 | 1107 | $1,745 | $1.58 | 25d | 1 | 0.48mi |
| 8600 Everett St Raytown, MO | 3.0 | 1.5 | 956 | $1,550 | $1.62 | 45d | 1 | 0.59mi |
| 9000 E 85th Pl Raytown, MO | 3.0 | 2.0 | 1580 | $1,375 | $0.87 | 45d | 1 | 0.59mi |
| 8806 Crescent Ave Kansas City, MO | 3.0 | 2.5 | 1148 | $1,795 | $1.56 | 5d | 1 | 0.61mi |
| 9115 E 85 St Unit 9115 Raytown, MO | 2.0 | 1.0 | 892 | $800 | $0.90 | 45d | 1 | 0.66mi |
| 8500 Elm Ave Raytown, MO | 3.0 | 2.0 | 1250 | $1,550 | $1.24 | 45d | 1 | 0.70mi |
| 8001 E 89th Ter Kansas City, MO | 3.0 | 2.0 | 1014 | $1,545 | $1.52 | 45d | 1 | 0.72mi |
| 820 E 93rd Ter Kansas City, MO | 1.0–2.0 | 1.0–2.0 | 1040 | $1,165 | $1.12 | 5d | 1 | 0.72mi |
| 7902 E 89th Ter Kansas City, MO | 3.0 | 1.5 | 1068 | $1,516 | $1.42 | 19d | 1 | 0.75mi |
| 8002 E 88th Pl Kansas City, MO | 3.0 | 2.0 | 984 | $1,495 | $1.52 | 45d | 1 | 0.75mi |
| 8812 Manchester Ave Kansas City, MO | 3.0 | 1.0 | 1066 | $1,586 | $1.49 | 14d | 1 | 0.84mi |
| 7800 E 91st St Kansas City, MO | 3.0 | 3.0 | 1747 | $1,895 | $1.08 | 45d | 1 | 0.85mi |
| 8951 E 83rd St Raytown, MO | 4.0 | 2.0 | 926 | $1,516 | $1.64 | 25d | 1 | 0.89mi |
| 9302 Fairwood Dr Kansas City, MO | 3.0 | 1.0 | 1526 | $1,585 | $1.04 | 25d | 1 | 1.02mi |
| 9809 Wallace Ave Kansas City, MO | 3.0 | 1.0 | 956 | $1,500 | $1.57 | 25d | 1 | 1.06mi |
| 7510 E 85th Ter Kansas City, MO | 1.0–2.0 | 1.0 | 852 | $1,300 | $1.53 | 45d | 1 | 1.10mi |
| 9727 Marsh Ave Kansas City, MO | 3.0 | 1.0 | 1271 | $1,706 | $1.34 | 45d | 1 | 1.11mi |
| 9516 Raytown Rd Kansas City, MO | 3.0 | 2.0 | 1000 | $1,445 | $1.45 | 18d | 1 | 1.11mi |
| 9400 E 82nd St Raytown, MO | 3.0 | 2.0 | 1396 | $1,606 | $1.15 | 5d | 1 | 1.14mi |
| 8407 E 98th Ter Kansas City, MO | 3.0 | 1.0 | 940 | $1,395 | $1.48 | 25d | 1 | 1.15mi |
| 8407 E 98th Ter Kansas City, MO | 3.0 | 1.0 | 940 | $1,395 | $1.48 | 18d | 1 | 1.15mi |
| 9811 Marsh Ave Kansas City, MO | 3.0 | 1.0 | 912 | $1,295 | $1.42 | 45d | 1 | 1.17mi |
| 7211 E 87th St Kansas City, MO | 2.0 | 1.0 | 988 | $1,306 | $1.32 | 5d | 1 | 1.29mi |
| 7917 Ditzler Ave Raytown, MO | 3.0 | 1.0 | 912 | $1,450 | $1.59 | 4d | 1 | 1.37mi |
| 8607 Corrington Ave Kansas City, MO | 4.0 | 2.5 | 1754 | $1,720 | $0.98 | 45d | 1 | 1.37mi |
| 7905 Elm Ave Raytown, MO | 3.0 | 1.5 | 1104 | $1,700 | $1.54 | 3d | 1 | 1.44mi |
Listing history 2 events
-
2026-05-09$200,000 Active 822-char remark
-
2026-05-06historical $200,000 822-char remark
ⓘ Source: listings_history table (triggers on properties + properties_extension) + one-shot
backfill from property_details.listing_events for pre-trigger history.
Tax reassessment forecast MO · Resets to sale price
- Current annual tax
- $2,371 · $198/mo
- Projected year-2 tax
- $2,371 · $198/mo
- Expected delta
- $0/yr ($0/mo · 0.0%)
ⓘ Screening estimate from a state-policy table — verify with the county assessor before closing.
Climate risk First Street
- Flood 1/10 Low FEMA zone X (unshaded) · 0% chance over 30 yrs
- Wildfire 1/10 Low
- Heat 4/10 Moderate 7 d/yr ≥106°F today · 17 d/yr by 30 yrs out
- Wind 2/10 Low
- Air quality 3/10 Moderate 3 unhealthy d/yr today · 5 by 30 yrs out
Nearby sold comps map
Loading sold comps map…
Walkable amenities ~0.75 mi
Loading nearby amenities…
Taxation est. · year 1
- Rental income
- $19,248
- − Mortgage interest
- −$11,203
- − Property taxes
- −$2,371
- − Insurance
- −$1,000
- − Repairs & maintenance
- −$1,540
- − Management
- −$1,540
- − Depreciation
- −$5,818
- Taxable loss
- −$4,224
- Est. tax savings @ 24.0%
- +$1,014
- After-tax cash flow
- $263/yr
For passive investors: Depreciation is non-cash, so a rental often shows a tax loss while cash-flowing — sheltering income. Rental losses are passive: they offset passive income freely, and up to $25,000/yr can offset ordinary (W-2) income if you actively participate and your MAGI is under $100k (phasing out to $0 by $150k); unused losses carry forward. On sale, claimed depreciation is recaptured at up to 25%, and gains may owe capital-gains tax (a 1031 exchange can defer both). Figures are a year-1 estimate at your 24.0% rate — not tax advice; consult a CPA.
Schools (NCES district)
- District
- Hickman Mills C-1
- NCES district ID
- 2914340
- Math proficiency
- 8% ▼ -8.00%
- Reading proficiency
- 18% ▼ -4.00%
- Median HH income
- $40,908
- Composite
- 11.2/100
- National rank
- #9725
- State rank
- #314 of 324 in MO
Livability — Kansas City
- Score
- 78/100
- State rank
- #28
- US rank
- #2671
Category grades
Schools grade is shown separately in the Schools card above.
Census & demographics
- Census place
- Kansas City, MO
- County
- Jackson County · 687,798 people
- City population
- 439,467
- Metro
- Kansas City, MO-KS
- Population (ZIP)
- 23,805
- Household income
- $58,638
- Rent vs Own
- Severe rent burden
- 810.0
Population outlook (Jackson County) Hauer SSP2
- Today (2025)
- 719,589 people
- By 2030
- 731,456 · +1.6%
- By 2040
- 746,689 · +3.8%
- By 2050
- 749,289 · +4.1%
- By 2075
- 736,227 · +2.3%
- By 2100
- 668,210 · -7.1%
Race, ethnicity, and origin ACS 2023
- Neighborhood character
- Diverse neighborhood (Simpson 0.61)
- Race & ethnicity
- Black 46% White 42% Two or more races 6% Hispanic / Latino 5% Asian 2%
- Common ancestry
- Slovak 2% Ukrainian 1% Italian 1%
- Foreign-born
- 6% · Canada, China
- Languages at home
- 91% English-only · Spanish 4% Arabic 3% Other Indo-European 1%
Political lean MEDSL · Jackson
- 2024 margin
- D (+19.3) · D 58.9% · R 39.5% · Other 1.6%
- 2008→2024 swing
- -6.1pp toward R · 2008: 25.4pp · 2024: 19.3pp
- All cycles
- 2024: D+19.3 2020: D+22.0 2016: D+16.6 2012: D+19.0 2008: D+25.4
Not yet ingested
- Civics
- —
Market trends
- HPI YoY
- ▼ -186.34%
- Current HPI
- 274.681
- Rent YoY
- ▲ 3.07%
- Metro
- Kansas City, MO-KS
- State GDP YoY
- ▲ 1.84%
- F500 in state
- 20
Industry mix (Fortune 500 HQ in MO)
| Industry | F500 HQs | Revenue |
|---|---|---|
| Healthcare | 1 | $163B |
|
||
| Insurance | 1 | $21B |
|
||
| Industrial Technology | 1 | $17B |
|
||
| Retail | 1 | $16B |
|
||
| Industrial Distribution | 1 | $10B |
|
||
| Utilities | 1 | $9B |
|
||
Price history
+0.0% since first listed3 events — show timeline
- 2026-05-20 Pending — Heartland MLS as Distributed by MLS Grid
- 2026-05-09 Listed $200,000 Heartland MLS as Distributed by MLS Grid
- 2026-05-06 Coming Soon $200,000 Heartland MLS as Distributed by MLS Grid
Property tax history
+3.8%/yrLatest (2025): $2,371 · +15.3% YoY. Source: county tax records.
Cash-flow waterfall
monthlySold comps — $/sqft
last 12 mo · ≤1 miLoading sold comps…