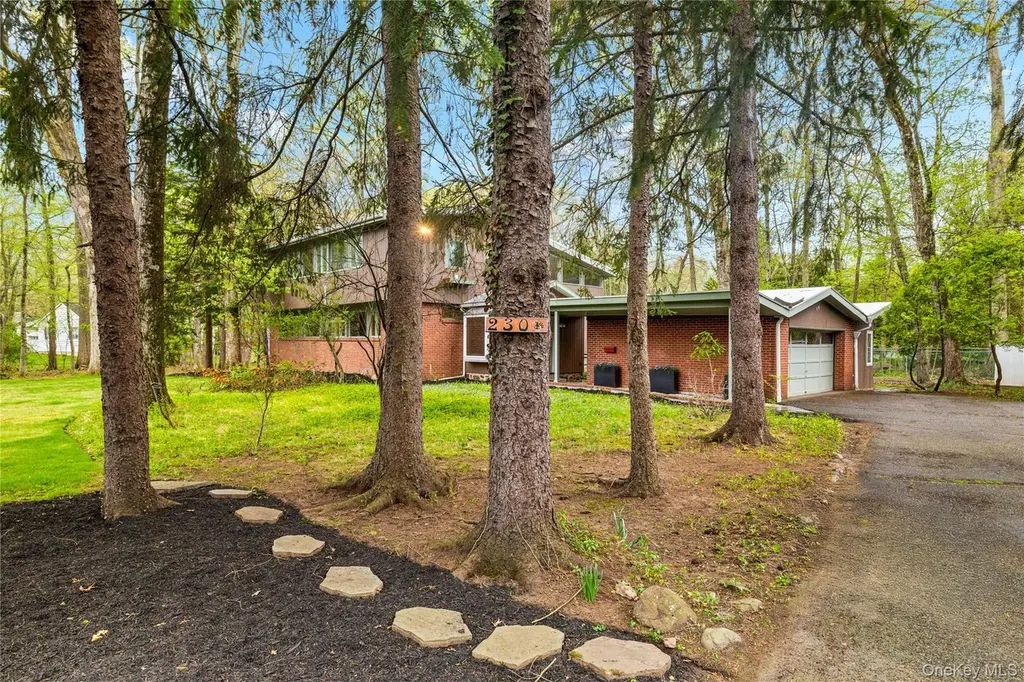
230 Sickletown Rd · West Nyack, NY
Flood risk 1/10 · Minimal
- FEMA flood zone
- X (unshaded)
- Chance of flooding over 30 yrs
- 0.0%
- Est. flood insurance / yr
- $473 – $860
Fire risk 3/10 · Minor
- Est. fire insurance / yr
- $691 – $1,283
Heat risk 6/10 · Moderate
- Hot days now (above 100°F)
- 7 days/yr
- Hot days in 30 yrs
- 15 days/yr
Wind risk 6/10 · Moderate
- Chance of severe wind over 30 yrs
- 27.0%
Air-quality risk 4/10 · Minor
- Unhealthy air days now
- 3 days/yr
- Unhealthy air days in 30 yrs
- 6 days/yr
Risk factors via First Street. Map © Google.
Why this score? — see what drove the C- grade
The composite is a weighted blend of 9 inputs, each scored 0–100. Each bar is that input's sub-score; the figure is the points it added to the 100-point composite (weight × sub-score).
- Cash flow +15.0/30.0
- ARV discount +12.9/15.0
- Schools +6.9/10.0
- 1% rule +4.9/10.0
- DSCR +4.6/10.0
- Livability +3.6/5.0
- Rent growth +2.5/5.0
- Condition / age +2.5/5.0
- Appreciation +0.0/10.0
$899,000
🖨 Deal sheet 📄 Offer letter ✓ Due diligence
Listing remarks MLS
Original Mid-Century Modern Home designed by the famous Architect J. Seymour Gurlitz for his very own family in the 1950's. This Contemporary Modern Home highlights the Sophistication of Design intended to Harmonize the home with its Natural Surroundings. The Solid Blue Stone Floors ground us as we enter this home and experience the warmth of Natural Cypress Interiors. Sweeping Walls of Glass are juxtaposed with Bands of Windows at different Levels. Pulling into the home, views of Nature from the attractive surrounding Evergreen Trees, Dog Woods, Rhododendrons and Japanese Tolly Azaleas. The exterior is Solid Redwood and Natural Red Brick to protect the house for years to come. Current Owners have lived here since purchasing the home from the original Architect and his family. Live here and be a part of American Design History...
Key facts
- Natural red brick
- Solid redwood
- 0.92 acre lot
Tags
Neighborhood map
What this means for you Summary
Snapshot
- This is a 4-bed/2.5-bath single-family listed at $899k.
Deal economics
- At list price, monthly cash flow is $286 ($3k/yr) — positive.
- The deal already cash-flows at list — no discount required.
- To meet the 1% rule (rent ≥ 1% of price), the offer needs to be $890k (1.0% below list).
- Recommended offer: $872k (3.0% below list) — sets the bar for market timing.
Location & tenants
- Location reads 72/100 on livability (#340 in NY) — a middle-class / working-renter tenant base. Strengths: crime A+, employment A+, housing A+; Watch: amenities F, cost of living F.
- Clarkstown Central School District (suburban): math 72% / reading 75% proficiency, ranked #66 of 590 in NY (top 11%) — strong family-tenant draw, lease renewals of 3-5y typical; only 8% free/reduced lunch — higher-income household profile.
- Market conditions: 46 active listings in the ZIP; 1 comparable units currently listed for rent nearby; 429 units permitted in Rockland County in 2024 (231 in 5+ unit buildings).
Forward outlook
- Local home prices are declining (-3.0%/yr); year-one equity from $6k of loan paydown is wiped out by about $27k of value loss. Plan a longer hold.
- Rockland County population projected at +7% by 2050 — modest demand growth; plan on rents tracking national, not racing it.
Negotiation context
- It's been on market 57 days — a 3% lower offer ($872k) is reasonable based on typical stale-listing flexibility.
Risks & watch-outs
- Watch-outs: built in 1954 — expect roof / HVAC / electrical / plumbing capex.
- Climate carrying-cost: major wind risk, 27% chance of damaging wind over 30y; extreme-heat days projected 7→15/yr by 2055 (HVAC capex compounding) — expect insurance premiums to compound above CPI over the hold.
Questions for the listing agent
- It's been on market 57 days. Have you received any prior offers? Is the seller open to a 3% concession, seller financing, or rate buy-down credit?
- Built in 1954 — when were the roof, HVAC, electrical panel, plumbing, and water heater last replaced?
- Is there a deadline driving the sale (1031 exchange, divorce, estate, relocation)? That informs how much negotiation room exists.
- Schools are A-rated — typically a magnet for longer-tenancy family renters. What's the average tenant stay here, and is there a school-zone premium baked into asking?
- What's the average days-on-market for RENTAL listings here right now (not sales)? A rising rental-DOM trend means longer vacancies and softer asking-rent achievability than the comps imply.
- What's the recent tenant-quality profile in this submarket — average credit score on applications, eviction rate, late-payment / NSF rate, and stable-employment percentage? A property-management company in the area should have these aggregated.
- How much new for-sale + rental construction is in the pipeline within 1–3 miles? Heavy new supply typically softens prices + rents 12–24 months out; constrained supply supports both.
Investment metrics
- 1% rule
- 0.99% ✗
- Cap rate
- 6.67%
- Cash-on-cash
- 1.36%
- DSCR
- 1.06
- GRM
- 8.4
CMA / ARV
- ARV (median comp)
- $1,020,658
- List price
- $899,000
- Delta
- -11.92%
- Verdict
- UNDERPRICED
- Comps
- 20 within 1.0 mi
Show comp detail 11 sales within ~0.75 mi
| Address | Dist | Beds/Ba | Sqft | Sold | Price | $/sf | Match |
|---|---|---|---|---|---|---|---|
| 45 Continental Dr | 0.31mi | 5/3.0 (+1) | 2,660 (+3%) | 9mo | $1,100,000 | $414 | 66 |
| 251 Sickletown Rd | 0.10mi | 3/3.0 (-1) | 2,810 (+9%) | 11mo | $976,000 | $347 | 64 |
| 262 E Townline Rd | 0.17mi | 4/3.5 | 2,662 (+3%) | 23mo | $910,000 | $342 | 64 |
| 21 Bridge Rd | 0.53mi | 5/3.5 (+1) | 2,609 (+1%) | 1mo | $901,000 | $345 | 64 |
| 26 Jill Dr | 0.35mi | 5/3.0 (+1) | 2,404 (-7%) | 4mo | $775,000 | $322 | 62 |
| 30 Bridge Rd | 0.50mi | 4/2.5 | 2,767 (+7%) | 16mo | $875,000 | $316 | 52 |
| 215 Rose Rd | 0.67mi | 4/3.5 | 2,406 (-7%) | 4mo | $785,000 | $326 | 50 |
| 37 Continental Dr | 0.34mi | 3/2.5 (-1) | 2,200 (-15%) | 6mo | $840,000 | $382 | 49 |
| 1 Graphic Ct | 0.48mi | 4/2.5 | 2,272 (-12%) | 19mo | $800,000 | $352 | 41 |
| 5 Marycrest Rd | 0.66mi | 4/3.0 | 2,926 (+13%) | 8mo | $999,000 | $341 | 39 |
| 12 Bridge Rd | 0.63mi | 4/2.5 | 2,949 (+14%) | 11mo | $980,000 | $332 | 38 |
Match score weights: distance 35% · size 25% · config 20% · recency 20%. Top-matched comps best support the ARV.
Projected returns pro-forma
-3.0% appreciation · 3.0% rent growth · sell at horizon
- IRR
- -14.1%
- Equity multiple
- 0.50×
- Total profit
- $-126,989
- Equity at exit
- $134,044
- IRR
- -5.2%
- Equity multiple
- 0.66×
- Total profit
- $-85,236
- Equity at exit
- $77,729
Cash invested: $251,720 (down + closing). Projections, not guarantees.
Landlord ↔ Tenant lean methodology
- Overall (STATE)
- 15 Strongly Tenant-Friendly
- State New York
- 15 Strongly Tenant-Friendly · D+10
- County
- — inherits STATE
- City
- — inherits STATE
ZIP-level market 10994
- Active inventory
- 46
- Price-to-rent
- 8.4×
Monthly cashflow live
- Estimated rent
- $8,900 medium interval (Pro) →
- Mortgage (P&I)
- −$4,714
- Tax from tax record
- −$1,656 /mo · $19,869/yr
- Insurance
- −$375
- HOA
- −$0
- Vacancy / Maint / Mgmt
- −$1,869
- Net cashflow
- $286
Break-even live
UW: 25.0% down · 7.5% · 30yr · 1.5% tax · 5.0% vac · 8.0% maint · 8.0% mgmt
Financing live
Cash to close
- Down payment
- $224,750
- Closing costs
- $26,970
- Reserves months
- —
- Total cash needed
- —
Loan-product check · same deal, 3 products live
Conventional
25% down · 7.5% · 30yr
- Down + closing
- —
- Monthly P&I
- —
- Monthly cashflow
- —
- DSCR
- —
- Eligible?
- —
Personal DTI + credit; lowest rate.
DSCR
20% down · 8.5% · 30yr
- Down + closing
- —
- Monthly P&I
- —
- Monthly cashflow
- —
- DSCR
- —
- Eligible?
- —
No personal income docs; deal must DSCR.
Hard money
10% down · 12.0% · 12mo
- Down + closing
- —
- Monthly P&I
- —
- Monthly cashflow
- —
- DSCR
- —
- Eligible?
- —
Short-term bridge; refi at stabilization.
Rent comps 1 comps
| Address | Beds | Baths | Sqft | Rent | $/sqft | DOM | Units | Dist |
|---|---|---|---|---|---|---|---|---|
| 245 Townline Rd West Nyack, NY | 5.0 | 3.0 | 3716 | $8,900 | $2.40 | 7d | 1 | 0.26mi |
Listing history 15 events
-
2026-06-18days on market $899,000 Active 57 DOM
-
2026-06-17days on market $899,000 Active 56 DOM
-
2026-06-16days on market $899,000 Active 55 DOM
-
2026-06-15days on market $899,000 Active 54 DOM
-
2026-06-13days on market $899,000 Active 52 DOM
-
2026-06-09days on market $899,000 Active 48 DOM
-
2026-06-08days on market $899,000 Active 47 DOM
-
2026-06-07days on market $899,000 Active 46 DOM
-
2026-06-04days on market $899,000 Active 43 DOM
-
2026-06-03days on market $899,000 Active 42 DOM
-
2026-06-02days on market $899,000 Active 41 DOM
-
2026-06-01days on market $899,000 Active 40 DOM
-
2026-05-31days on market $899,000 Active 39 DOM
-
2026-05-13price $899,000 841-char remark
Show marketing remark (841 chars)
Original Mid-Century Modern Home designed by the famous Architect J. Seymour Gurlitz for his very own family in the 1950's. This Contemporary Modern Home highlights the Sophistication of Design intended to Harmonize the home with its Natural Surroundings. The Solid Blue Stone Floors ground us as we enter this home and experience the warmth of Natural Cypress Interiors. Sweeping Walls of Glass are juxtaposed with Bands of Windows at different Levels. Pulling into the home, views of Nature from the attractive surrounding Evergreen Trees, Dog Woods, Rhododendrons and Japanese Tolly Azaleas. The exterior is Solid Redwood and Natural Red Brick to protect the house for years to come. Current Owners have lived here since purchasing the home from the original Architect and his family. Live here and be a part of American Design History...
-
2026-04-22$930,000 Active 841-char remark
Show marketing remark (841 chars)
Original Mid-Century Modern Home designed by the famous Architect J. Seymour Gurlitz for his very own family in the 1950's. This Contemporary Modern Home highlights the Sophistication of Design intended to Harmonize the home with its Natural Surroundings. The Solid Blue Stone Floors ground us as we enter this home and experience the warmth of Natural Cypress Interiors. Sweeping Walls of Glass are juxtaposed with Bands of Windows at different Levels. Pulling into the home, views of Nature from the attractive surrounding Evergreen Trees, Dog Woods, Rhododendrons and Japanese Tolly Azaleas. The exterior is Solid Redwood and Natural Red Brick to protect the house for years to come. Current Owners have lived here since purchasing the home from the original Architect and his family. Live here and be a part of American Design History...
ⓘ Source: listings_history table (triggers on properties + properties_extension) + one-shot
backfill from property_details.listing_events for pre-trigger history.
Tax reassessment forecast NY · Partial reset (capped growth)
- Current annual tax
- $19,869 · $1,656/mo
- Projected year-2 tax
- $19,869 · $1,656/mo
- Expected delta
- $0/yr ($0/mo · 0.0%)
ⓘ Screening estimate from a state-policy table — verify with the county assessor before closing.
Climate risk First Street
- Flood 1/10 Low FEMA zone X (unshaded) · 0% chance over 30 yrs
- Wildfire 3/10 Moderate
- Heat 6/10 Major 7 d/yr ≥100°F today · 15 d/yr by 30 yrs out
- Wind 6/10 Major 27% chance of damaging wind over 30 yrs
- Air quality 4/10 Moderate 3 unhealthy d/yr today · 6 by 30 yrs out
Nearby sold comps map
Loading sold comps map…
Walkable amenities ~0.75 mi
Loading nearby amenities…
Taxation est. · year 1
- Rental income
- $106,800
- − Mortgage interest
- −$50,358
- − Property taxes
- −$19,869
- − Insurance
- −$4,495
- − Repairs & maintenance
- −$8,544
- − Management
- −$8,544
- − Depreciation
- −$26,153
- Taxable loss
- −$11,163
- Est. tax savings @ 24.0%
- +$2,679
- After-tax cash flow
- $6,113/yr
For passive investors: Depreciation is non-cash, so a rental often shows a tax loss while cash-flowing — sheltering income. Rental losses are passive: they offset passive income freely, and up to $25,000/yr can offset ordinary (W-2) income if you actively participate and your MAGI is under $100k (phasing out to $0 by $150k); unused losses carry forward. On sale, claimed depreciation is recaptured at up to 25%, and gains may owe capital-gains tax (a 1031 exchange can defer both). Figures are a year-1 estimate at your 24.0% rate — not tax advice; consult a CPA.
Schools (NCES district)
- District
- Clarkstown Central School District
- NCES district ID
- 3620340
- Math proficiency
- 72% ▼ -1.00%
- Reading proficiency
- 75% ▲ 6.00%
- Median HH income
- $115,765
- Composite
- 68.55/100
- National rank
- #342
- State rank
- #66 of 590 in NY
Livability — West Nyack
- Score
- 72/100
- State rank
- #340
- US rank
- #5764
Category grades
Schools grade is shown separately in the Schools card above.
Census & demographics
- Census place
- West Nyack, NY
- City population
- 5,925
- Population (ZIP)
- 5,925
Population outlook (Rockland County) Hauer SSP2
- Today (2025)
- 339,642 people
- By 2030
- 345,987 · +1.9%
- By 2040
- 357,178 · +5.2%
- By 2050
- 362,456 · +6.7%
- By 2075
- 367,281 · +8.1%
- By 2100
- 328,211 · -3.4%
Race, ethnicity, and origin ACS 2023
- Neighborhood character
- Predominantly White (68%)
- Race & ethnicity
- White 68% Hispanic / Latino 14% Asian 11% Two or more races 6% Black 5%
- Hispanic origin (detail)
- Puerto Rican 2% Dominican 2%
- Common ancestry
- Italian 6% Scotch-Irish 3% Iranian 3%
- Foreign-born
- 22% · Canada, Jamaica, South Korea
- Languages at home
- 73% English-only · Spanish 11% Other Indo-European 7% Chinese 2%
Political lean MEDSL · Rockland
- 2024 margin
- R (+11.8) · D 44.1% · R 55.9%
- 2008→2024 swing
- -17.7pp toward R · 2008: 5.9pp · 2024: -11.8pp
- All cycles
- 2024: R+11.8 2020: D+1.7 2016: D+5.1 2012: D+6.6 2008: D+5.9
Not yet ingested
- Civics
- —
Market trends
- HPI YoY
- ▼ -402.04%
- Current HPI
- 247.615
- Rent YoY
- —
- Metro
- —
- State GDP YoY
- ▲ 2.60%
- F500 in state
- 92
Industry mix (Fortune 500 HQ in NY)
| Industry | F500 HQs | Revenue |
|---|---|---|
| Financial Services | 10 | $950B |
|
||
| Consumer Goods | 9 | $162B |
|
||
| Insurance | 4 | $225B |
|
||
| Telecommunications | 2 | $144B |
|
||
| Pharmaceuticals | 2 | $112B |
|
||
| Media / Entertainment | 2 | $69B |
|
||
Price history
-3.3% since first listed2 events — show timeline
- 2026-05-13 Price Changed $899,000 OneKey® MLS as Distributed by MLS Grid
- 2026-04-22 Listed $930,000 OneKey® MLS as Distributed by MLS Grid
Property tax history
+3.0%/yrLatest (2025): $19,869 · +3.4% YoY. Source: county tax records.
Cash-flow waterfall
monthlySold comps — $/sqft
last 12 mo · ≤1 miLoading sold comps…