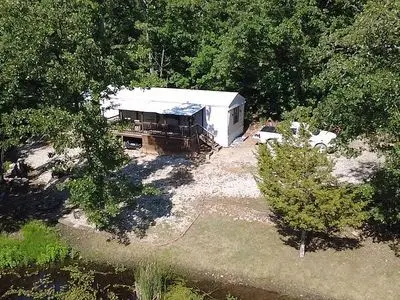
10996 Durk Rd · Bent Tree Harbor, MO
Flood risk 9/10 · Severe
- FEMA flood zone
- X (unshaded)
- Chance of flooding over 30 yrs
- 0.99%
- Est. flood insurance / yr
- $473 – $860
Fire risk 4/10 · Minor
- Est. fire insurance / yr
- $1,054 – $1,958
Heat risk 4/10 · Minor
- Hot days now (above 108°F)
- 7 days/yr
- Hot days in 30 yrs
- 18 days/yr
Wind risk 2/10 · Minimal
- Chance of severe wind over 30 yrs
- —
Air-quality risk 1/10 · Minimal
- Unhealthy air days now
- 0 days/yr
- Unhealthy air days in 30 yrs
- 0 days/yr
Risk factors via First Street. Map © Google.
Why this score? — see what drove the B grade
The composite is a weighted blend of 9 inputs, each scored 0–100. Each bar is that input's sub-score; the figure is the points it added to the 100-point composite (weight × sub-score).
- Cash flow +30.0/30.0
- DSCR +10.0/10.0
- 1% rule +8.9/10.0
- Appreciation +7.7/10.0
- ARV discount +7.5/15.0
- Schools +3.0/10.0
- Rent growth +2.5/5.0
- Livability +2.5/5.0
- Condition / age +2.5/5.0
$75,000
🖨 Deal sheet 📄 Offer letter ✓ Due diligence
Listing remarks
Hidden Paradise! Property offers 2 bedroom and 1 bath, mostly wooded with a pond. Could be a primary or secondary home and close access to Truman Lake! Brand new roof and upgraded floor in kitchen/bathroom areas. To schedule a private showing text/call 573-694-7587. For sale by owner only. No rent to own.
Key facts
- Pond
- Mostly wooded
- Brand new roof
Tags
Neighborhood map
What this means for you Summary
Snapshot
- This is a 2-bed/1.0-bath manufactured listed at $75k.
Deal economics
- At list price, monthly cash flow is $324 ($4k/yr) — positive.
- The deal already cash-flows at list — no discount required.
- Meets the 1% rule at list price ($1k rent vs $75k).
- Cap rate 12.4% vs local median 4.2% in Bent Tree Harbor — top-decile yield for the area; either an underpriced asset or a hidden risk that comps aren't pricing in. Stress-test before assuming the spread holds.
Location & tenants
- Location reads: area grade B — affects rentability + tenant quality, not the cash-flow math above.
- Warsaw R-IX (rural): math 30% / reading 42% proficiency, ranked #222 of 324 in MO (top 68%) — families likely to look elsewhere, expect single-tenant / working-renter base with shorter leases; 61% free/reduced lunch — lower-income household profile, screen leases tightly.
- Market conditions: 259 active listings in the ZIP; 9 units permitted in Benton County in 2024 (0 in 5+ unit buildings).
Forward outlook
- In year one you build about $5k of equity ($519 loan paydown + $4k appreciation (5.5% local appreciation)).
- Benton County population projected at -21% by 2050 — secular population decline; favor cash flow + early exit over multi-decade hold.
- At projected returns (5.5% appreciation + 3.0% rent growth), your $21k cash investment doubles in ~3 years — after that, you're playing with house money.
- By year 8, paydown + projected appreciation supports a ~$35k cash-out refi (75% LTV) — recoverable capital for the next deal without selling this one.
Negotiation context
- Only 6 days on market — expect competitive offers; lowballing is unlikely to land.
Risks & watch-outs
- Watch-outs: flood insurance adds $56/mo.
- Climate carrying-cost: severe flood risk — expect insurance premiums to compound above CPI over the hold.
Questions for the listing agent
- What's the actual annual flood-insurance premium (NFIP or private), and is the property in a SFHA with mandatory coverage?
- Is there a deadline driving the sale (1031 exchange, divorce, estate, relocation)? That informs how much negotiation room exists.
- What's the average days-on-market for RENTAL listings here right now (not sales)? A rising rental-DOM trend means longer vacancies and softer asking-rent achievability than the comps imply.
- What's the recent tenant-quality profile in this submarket — average credit score on applications, eviction rate, late-payment / NSF rate, and stable-employment percentage? A property-management company in the area should have these aggregated.
- How much new for-sale + rental construction is in the pipeline within 1–3 miles? Heavy new supply typically softens prices + rents 12–24 months out; constrained supply supports both.
Investment metrics
- 1% rule
- 1.39% ✓
- Cap rate
- 12.36%
- Cash-on-cash
- 21.68%
- DSCR
- 1.96
- GRM
- 6.0
CMA / ARV
No comps found within radius.
Projected returns pro-forma
5.45% appreciation · 3.0% rent growth · sell at horizon
- IRR
- 29.8%
- Equity multiple
- 2.90×
- Total profit
- $39,856
- Equity at exit
- $44,568
- IRR
- 28.2%
- Equity multiple
- 5.85×
- Total profit
- $101,819
- Equity at exit
- $78,684
Cash invested: $21,000 (down + closing). Projections, not guarantees.
Landlord ↔ Tenant lean methodology
- Overall (STATE)
- 81 Strongly Landlord-Friendly
- State Missouri
- 81 Strongly Landlord-Friendly · R+10
- County
- — inherits STATE
- City
- — inherits STATE
ZIP-level market 65355
- Home prices YoY
- 2.4%
- Active inventory
- 259
- Price-to-rent
- 6.0×
Monthly cashflow live
- Estimated rent
- $1,042 medium interval (Pro) →
- Mortgage (P&I)
- −$393
- Tax from tax record
- −$20 /mo · $236/yr
- Insurance
- −$31
- Flood insurance flood zone
- −$56 /mo · $666/yr
- HOA
- −$0
- Vacancy / Maint / Mgmt
- −$219
- Net cashflow
- $324
Break-even live
UW: 25.0% down · 7.5% · 30yr · 1.5% tax · 5.0% vac · 8.0% maint · 8.0% mgmt
Financing live
Cash to close
- Down payment
- $18,750
- Closing costs
- $2,250
- Reserves months
- —
- Total cash needed
- —
Loan-product check · same deal, 3 products live
Conventional
25% down · 7.5% · 30yr
- Down + closing
- —
- Monthly P&I
- —
- Monthly cashflow
- —
- DSCR
- —
- Eligible?
- —
Personal DTI + credit; lowest rate.
DSCR
20% down · 8.5% · 30yr
- Down + closing
- —
- Monthly P&I
- —
- Monthly cashflow
- —
- DSCR
- —
- Eligible?
- —
No personal income docs; deal must DSCR.
Hard money
10% down · 12.0% · 12mo
- Down + closing
- —
- Monthly P&I
- —
- Monthly cashflow
- —
- DSCR
- —
- Eligible?
- —
Short-term bridge; refi at stabilization.
Listing history 6 events
-
2026-06-18days on market $75,000 Active 6 DOM
-
2026-06-17days on market $75,000 Active 5 DOM
-
2026-06-16days on market $75,000 Active 4 DOM
-
2026-06-15days on market $75,000 Active 3 DOM
-
2026-06-13remarks 306-char remark
-
2026-06-13$75,000 Active 1 DOM
ⓘ Source: listings_history table (triggers on properties + properties_extension) + one-shot
backfill from property_details.listing_events for pre-trigger history.
Tax reassessment forecast MO · Resets to sale price
- Current annual tax
- $236 · $20/mo
- Projected year-2 tax
- $728 · $61/mo
- Expected delta
- +$491/yr (+$41/mo · 208.1%)
ⓘ Screening estimate from a state-policy table — verify with the county assessor before closing.
Climate risk First Street
- Flood 9/10 Extreme FEMA zone X (unshaded) · 99% chance over 30 yrs
- Wildfire 4/10 Moderate
- Heat 4/10 Moderate 7 d/yr ≥108°F today · 18 d/yr by 30 yrs out
- Wind 2/10 Low
- Air quality 1/10 Low 0 unhealthy d/yr today · 0 by 30 yrs out
Nearby sold comps map
Loading sold comps map…
Walkable amenities ~0.75 mi
Loading nearby amenities…
Taxation est. · year 1
- Rental income
- $12,510
- − Mortgage interest
- −$4,201
- − Property taxes
- −$236
- − Insurance
- −$1,042
- − Repairs & maintenance
- −$1,001
- − Management
- −$1,001
- − Depreciation
- −$2,182
- Taxable income
- $2,848
- Est. tax owed @ 24.0%
- −$683
- After-tax cash flow
- $3,202/yr
For passive investors: Depreciation is non-cash, so a rental often shows a tax loss while cash-flowing — sheltering income. Rental losses are passive: they offset passive income freely, and up to $25,000/yr can offset ordinary (W-2) income if you actively participate and your MAGI is under $100k (phasing out to $0 by $150k); unused losses carry forward. On sale, claimed depreciation is recaptured at up to 25%, and gains may owe capital-gains tax (a 1031 exchange can defer both). Figures are a year-1 estimate at your 24.0% rate — not tax advice; consult a CPA.
Schools (NCES district)
- District
- Warsaw R-IX
- NCES district ID
- 2931070
- Math proficiency
- 30% ▬ 0.00%
- Reading proficiency
- 42% ▲ 4.00%
- Median HH income
- $33,160
- Composite
- 29.53/100
- National rank
- #6495
- State rank
- #222 of 324 in MO
Livability — Bent Tree Harbor
No livability data for this city. (Only ~50 U.S. cities are tracked.)
Census & demographics
- Population (ZIP)
- 11,029
Population outlook (Benton County) Hauer SSP2
- Today (2025)
- 17,355 people
- By 2030
- 16,513 · -4.9%
- By 2040
- 14,898 · -14.2%
- By 2050
- 13,662 · -21.3%
- By 2075
- 11,308 · -34.8%
- By 2100
- 8,755 · -49.6%
Race, ethnicity, and origin ACS 2023
- Neighborhood character
- Predominantly White (92%)
- Race & ethnicity
- White 92% Two or more races 6% Hispanic / Latino 2% Native American 1%
- Common ancestry
- Slovak 3% Italian 2% Iranian 2%
- Foreign-born
- 1% · Canada
Political lean MEDSL · Benton
- 2024 margin
- Solid R (+59.1) · D 20.1% · R 79.2%
- 2008→2024 swing
- -36.8pp toward R · 2008: -22.3pp · 2024: -59.1pp
- All cycles
- 2024: R+59.1 2020: R+56.6 2016: R+54.1 2012: R+34.3 2008: R+22.3
Not yet ingested
- Civics
- —
Market trends
- HPI YoY
- ▲ 5.45%
- Current HPI
- 232.6924
- Rent YoY
- —
- Metro
- —
- State GDP YoY
- ▲ 1.84%
- F500 in state
- 20
Industry mix (Fortune 500 HQ in MO)
| Industry | F500 HQs | Revenue |
|---|---|---|
| Healthcare | 1 | $163B |
|
||
| Insurance | 1 | $21B |
|
||
| Industrial Technology | 1 | $17B |
|
||
| Retail | 1 | $16B |
|
||
| Industrial Distribution | 1 | $10B |
|
||
| Utilities | 1 | $9B |
|
||
Price history
1 event — show timeline
- 2026-06-13 Listed $75,000 FSBO.com
Property tax history
+0.3%/yrLatest (2025): $236 · -0.8% YoY. Source: county tax records.
Cash-flow waterfall
monthlySold comps — $/sqft
last 12 mo · ≤1 miLoading sold comps…