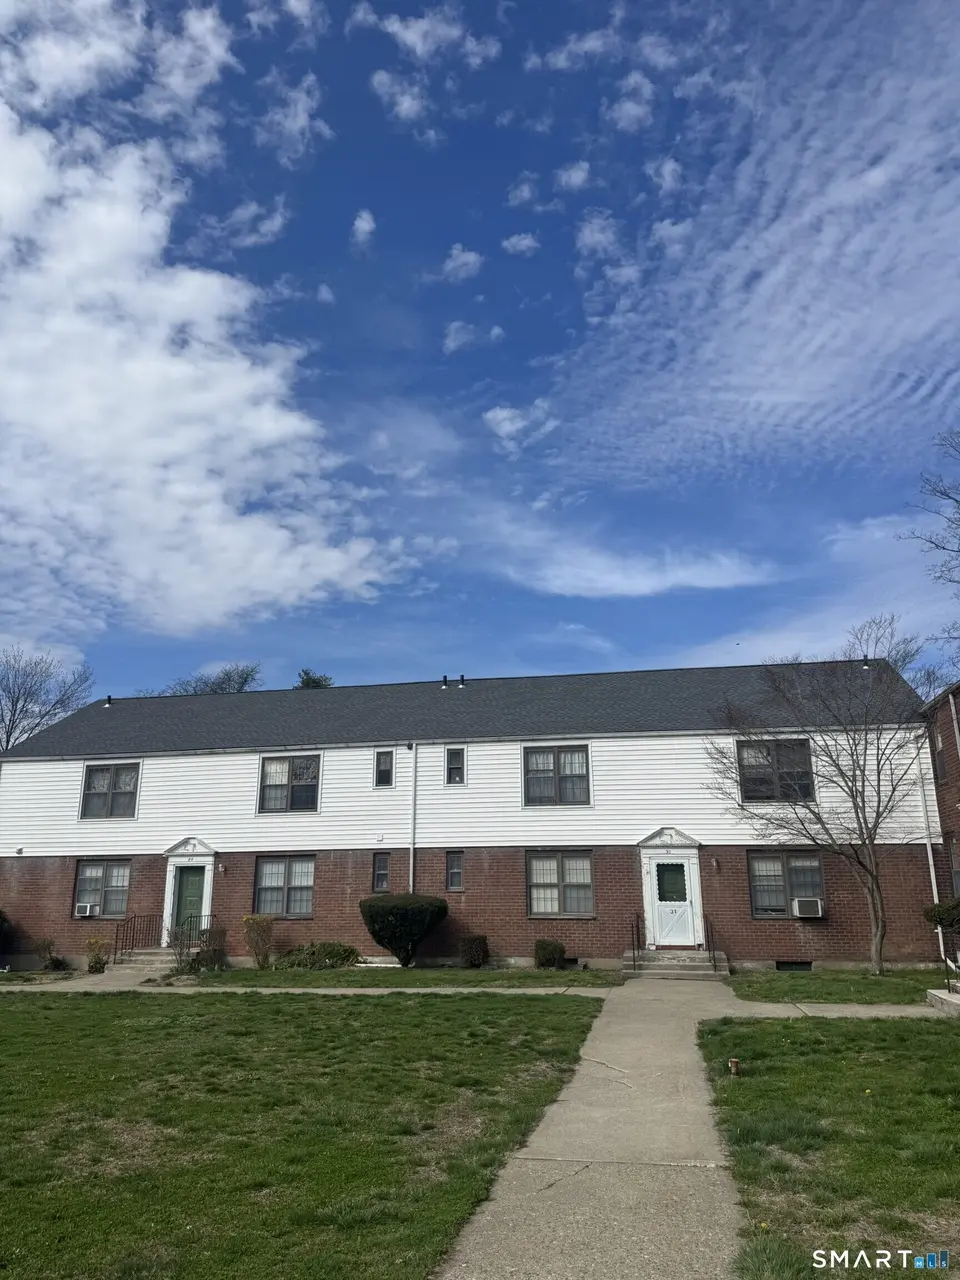
31 Nob Hill Cir Unit A · Bridgeport, CT
Flood risk 4/10 · Minor
- FEMA flood zone
- X (unshaded)
- Chance of flooding over 30 yrs
- 0.22%
- Est. flood insurance / yr
- $507 – $1,088
Fire risk 1/10 · Minimal
- Est. fire insurance / yr
- $829 – $1,539
Heat risk 6/10 · Moderate
- Hot days now (above 97°F)
- 7 days/yr
- Hot days in 30 yrs
- 15 days/yr
Wind risk 6/10 · Moderate
- Chance of severe wind over 30 yrs
- 51.0%
Air-quality risk 4/10 · Minor
- Unhealthy air days now
- 5 days/yr
- Unhealthy air days in 30 yrs
- 7 days/yr
Risk factors via First Street. Map © Google.
Why this score? — see what drove the C- grade
The composite is a weighted blend of 9 inputs, each scored 0–100. Each bar is that input's sub-score; the figure is the points it added to the 100-point composite (weight × sub-score).
- Cash flow +20.1/30.0
- 1% rule +8.5/10.0
- ARV discount +7.5/15.0
- DSCR +6.4/10.0
- Livability +4.0/5.0
- Rent growth +2.5/5.0
- Condition / age +2.5/5.0
- Schools +1.2/10.0
- Appreciation +0.0/10.0
$130,000
🖨 Deal sheet 📄 Offer letter ✓ Due diligence
Listing remarks MLS
Well Kept Pleasant Distribution One Bedroom 1St Floorunit. Close To Bearsdley Park, Banks, Shoppings, Public Transportation, Etc. Close To Trumbull - Huntington Townline. Easy Access To Route 8-125 & I-95 [South North]
Key facts
- First floor unit
- Nob hill complex
- $348 HOA
Tags
Neighborhood map
What this means for you Summary
Snapshot
- This is a 1-bed/1.0-bath condo listed at $130k.
Deal economics
- At list price, monthly cash flow is $161 ($2k/yr) — positive.
- The deal already cash-flows at list — no discount required.
- Meets the 1% rule at list price ($2k rent vs $130k).
- Cap rate 7.8% vs local median 5.0% in Bridgeport — top-decile yield for the area; either an underpriced asset or a hidden risk that comps aren't pricing in. Stress-test before assuming the spread holds.
Location & tenants
- Location reads 81/100 on livability (#15 in CT, #1,374 nationally) — a professional / high-income tenant draw. Strengths: amenities A+, commute A+, health & safety A+; Watch: crime C-, employment D+, schools D-.
- Bridgeport School District (urban): math 9% / reading 19% proficiency, ranked #151 of 153 in CT (top 99%) — low school quality limits family demand, transient renter base, plan for 1-2y turnover; 97% free/reduced lunch — lower-income household profile, screen leases tightly.
- Market conditions: 68 active listings in the ZIP; 23 comparable units currently listed for rent nearby; rentals at typical pace (median 21d on market — plan ~3-4 weeks tenant-placement turnaround); 852 units permitted in Greater Bridgeport Planning Region in 2024 (698 in 5+ unit buildings).
- This rent runs 41% of the median local income ($52k/yr) — at the standard rent-burdened threshold; future hikes will face affordability resistance.
Forward outlook
- Local home prices are declining (-3.0%/yr); year-one equity from $899 of loan paydown is wiped out by about $4k of value loss. Plan a longer hold.
Negotiation context
- Only 11 days on market — expect competitive offers; lowballing is unlikely to land.
- 2 sale attempts since 19y ago with the ask held roughly flat each time — persistent listings suggest the price (not the market) is what's stuck; bring a comps-based counter.
- Current owner paid $80k; list at $130k implies a 62% gain — meaningful room to come down on a strong offer.
Risks & watch-outs
- Watch-outs: built in 1949 — expect roof / HVAC / electrical / plumbing capex.
- Climate carrying-cost: major wind risk, 51% chance of damaging wind over 30y; extreme-heat days projected 7→15/yr by 2055 (HVAC capex compounding) — expect insurance premiums to compound above CPI over the hold.
Questions for the listing agent
- Built in 1949 — when were the roof, HVAC, electrical panel, plumbing, and water heater last replaced?
- What does the HOA fee cover, when was the last increase, and are there any pending special assessments or reserve-fund shortfalls?
- Any open or pending special assessments — roof, HVAC, plumbing, elevator, façade? What's the per-unit balance and payoff schedule, and is the seller paying it off at close or rolling it to the buyer?
- Is there a deadline driving the sale (1031 exchange, divorce, estate, relocation)? That informs how much negotiation room exists.
- Schools are D-rated, which usually means shorter tenancies and higher turnover. Who's the typical renter profile here, and what's been the actual vacancy rate?
- What's the average days-on-market for RENTAL listings here right now (not sales)? A rising rental-DOM trend means longer vacancies and softer asking-rent achievability than the comps imply.
- What's the recent tenant-quality profile in this submarket — average credit score on applications, eviction rate, late-payment / NSF rate, and stable-employment percentage? A property-management company in the area should have these aggregated.
- How much new apartment / multifamily construction is in the pipeline within 1–3 miles? Heavy new supply (>2% of stock underway) typically softens rents 12–24 months out; light construction supports rent growth.
Investment metrics
- 1% rule
- 1.35% ✓
- Cap rate
- 7.78%
- Cash-on-cash
- 5.32%
- DSCR
- 1.24
- GRM
- 6.2
CMA / ARV
No comps found within radius.
Projected returns pro-forma
-3.0% appreciation · 3.0% rent growth · sell at horizon
- IRR
- -7.9%
- Equity multiple
- 0.71×
- Total profit
- $-10,556
- Equity at exit
- $19,383
- IRR
- 1.9%
- Equity multiple
- 1.14×
- Total profit
- $4,965
- Equity at exit
- $11,240
Cash invested: $36,400 (down + closing). Projections, not guarantees.
Landlord ↔ Tenant lean methodology
- Overall (STATE)
- 27 Tenant-Leaning
- State Connecticut
- 27 Tenant-Leaning · D+7
- County
- — inherits STATE
- City
- — inherits STATE
ZIP-level market 06610
- Home prices YoY
- -7.5%
- Active inventory
- 68
- Price-to-rent
- 6.2×
Monthly cashflow live
- Estimated rent
- $1,750 high interval (Pro) →
- Mortgage (P&I)
- −$682
- Tax from tax record
- −$137 /mo · $1,649/yr
- Insurance
- −$54
- HOA
- −$348
- Vacancy / Maint / Mgmt
- −$368
- Net cashflow
- $161
Break-even live
UW: 25.0% down · 7.5% · 30yr · 1.5% tax · 5.0% vac · 8.0% maint · 8.0% mgmt
Financing live
Cash to close
- Down payment
- $32,500
- Closing costs
- $3,900
- Reserves months
- —
- Total cash needed
- —
Loan-product check · same deal, 3 products live
Conventional
25% down · 7.5% · 30yr
- Down + closing
- —
- Monthly P&I
- —
- Monthly cashflow
- —
- DSCR
- —
- Eligible?
- —
Personal DTI + credit; lowest rate.
DSCR
20% down · 8.5% · 30yr
- Down + closing
- —
- Monthly P&I
- —
- Monthly cashflow
- —
- DSCR
- —
- Eligible?
- —
No personal income docs; deal must DSCR.
Hard money
10% down · 12.0% · 12mo
- Down + closing
- —
- Monthly P&I
- —
- Monthly cashflow
- —
- DSCR
- —
- Eligible?
- —
Short-term bridge; refi at stabilization.
Rent comps 23 comps
| Address | Beds | Baths | Sqft | Rent | $/sqft | DOM | Units | Dist |
|---|---|---|---|---|---|---|---|---|
| 186 Louisiana Ave Unit D Bridgeport, CT | 1.0 | 1.0 | 650 | $1,700 | $2.62 | 21d | 1 | 0.07mi |
| 154 Virginia Ave Unit B Bridgeport, CT | 1.0 | 1.0 | 650 | $1,800 | $2.77 | 43d | 1 | 0.14mi |
| 600 Bond St Unit 112 Bridgeport, CT | 1.0 | 1.0 | 545 | $2,250 | $4.13 | 43d | 1 | 0.55mi |
| 231 Goddard Ave Unit 3RD Bridgeport, CT | 2.0 | 1.0 | 618 | $1,700 | $2.75 | 3d | 1 | 0.61mi |
| 66 Dodd Ave Unit 2 Bridgeport, CT | 2.0 | 1.0 | 728 | $2,450 | $3.37 | 11d | 1 | 0.86mi |
| 66 Dodd Ave Bridgeport, CT | 1.0 | 1.0 | 728 | $2,150 | $2.95 | 11d | 1 | 0.86mi |
| 3699 Broadbridge Ave #101 Stratford, CT | 1.0 | 1.0 | 680 | $1,700 | $2.50 | 43d | 1 | 0.92mi |
| 3699 Broadbridge Ave #101 Stratford, CT | 1.0 | 1.0 | 680 | $1,700 | $2.50 | 23d | 1 | 0.92mi |
| 135 Claudia Dr Unit 1 Stratford, CT | — | 1.0 | 406 | $1,525 | $3.76 | 43d | 1 | 0.95mi |
| 86 Birdsey St Unit 3R Bridgeport, CT | 1.0 | 1.0 | 650 | $1,350 | $2.08 | 43d | 1 | 1.05mi |
| 1333 E Main St #5 Bridgeport, CT | 2.0 | 1.0 | 700 | $1,650 | $2.36 | 3d | 1 | 1.16mi |
| 1333 E Main St Apt 1 Bridgeport, CT | 2.0 | 1.0 | 700 | $1,700 | $2.43 | 3d | 1 | 1.16mi |
| 235 Henry Ave Unit 12E Stratford, CT | 1.0 | 1.0 | 692 | $1,695 | $2.45 | 10d | 1 | 1.23mi |
| 1254 Pembroke St Unit 1st Floor Bridgeport, CT | 2.0 | 1.0 | 738 | $1,850 | $2.51 | 14d | 1 | 1.23mi |
| 614 Earl Ave Bridgeport, CT | 2.0 | 1.0 | 748 | $2,300 | $3.07 | 43d | 1 | 1.24mi |
| 1150 Ogden Street Ext Unit 102 Bridgeport, CT | 1.0 | 1.0 | 700 | $1,425 | $2.04 | 14d | 1 | 1.28mi |
| 250 N Bishop Ave Bridgeport, CT | 1.0 | 1.0 | 611 | $1,425 | $2.33 | 23d | 2 | 1.29mi |
| 250 N Bishop Ave #19 Bridgeport, CT | 1.0 | 1.0 | 638 | $1,650 | $2.59 | 43d | 1 | 1.29mi |
| 250 N Bishop Ave #1 Bridgeport, CT | 1.0 | 1.0 | 583 | $1,650 | $2.83 | 11d | 1 | 1.29mi |
| 116 Ogden St Unit 120 Bridgeport, CT | 2.0 | 1.0 | 688 | $2,375 | $3.45 | 3d | 1 | 1.36mi |
| 950 Lindley St Bridgeport, CT | 1.0 | 1.0 | 650 | $1,650 | $2.54 | 19d | 1 | 1.42mi |
| 1525 Central Ave Bridgeport, CT | 1.0 | 1.0 | 625 | $1,550 | $2.48 | 43d | 3 | 1.49mi |
| 380 Gurdon St Unit 1 Bridgeport, CT | 1.0 | 1.0 | 744 | $2,000 | $2.69 | 21d | 1 | 1.49mi |
HOA detail condo
- Monthly dues
- $348 · $4,176/yr
- Assessments
- None detected in remarks — confirm with the listing agent.
Listing history 6 events
-
2026-04-24status Under Contract
-
2026-04-13$130,000 Active
-
2007-10-10soldstatus $80,000
-
2007-10-09soldstatus $80,000 222-char remark
Show marketing remark (222 chars)
Well Kept Pleasant Distribution One Bedroom 1St Floorunit. Close To Bearsdley Park, Banks, Shoppings, Public Transportation, Etc. Close To Trumbull - Huntington Townline. Easy Access To Route 8-125 & I-95 [South North]
-
2007-07-16$88,900 222-char remark
Show marketing remark (222 chars)
Well Kept Pleasant Distribution One Bedroom 1St Floorunit. Close To Bearsdley Park, Banks, Shoppings, Public Transportation, Etc. Close To Trumbull - Huntington Townline. Easy Access To Route 8-125 & I-95 [South North]
-
1995-05-03soldstatus $17,500
ⓘ Source: listings_history table (triggers on properties + properties_extension) + one-shot
backfill from property_details.listing_events for pre-trigger history.
Tax reassessment forecast CT · Partial reset (capped growth)
- Current annual tax
- $1,649 · $137/mo
- Projected year-2 tax
- $2,216 · $185/mo
- Expected delta
- +$566/yr (+$47/mo · 34.4%)
ⓘ Screening estimate from a state-policy table — verify with the county assessor before closing.
Climate risk First Street
- Flood 4/10 Moderate FEMA zone X (unshaded) · 22% chance over 30 yrs
- Wildfire 1/10 Low
- Heat 6/10 Major 7 d/yr ≥97°F today · 15 d/yr by 30 yrs out
- Wind 6/10 Major 51% chance of damaging wind over 30 yrs
- Air quality 4/10 Moderate 5 unhealthy d/yr today · 7 by 30 yrs out
Nearby sold comps map
Loading sold comps map…
Walkable amenities ~0.75 mi
Loading nearby amenities…
Taxation est. · year 1
- Rental income
- $21,005
- − Mortgage interest
- −$7,282
- − Property taxes
- −$1,649
- − Insurance
- −$650
- − Repairs & maintenance
- −$1,680
- − Management
- −$1,680
- − HOA
- −$4,176
- − Depreciation
- −$3,782
- Taxable income
- $105
- Est. tax owed @ 24.0%
- −$25
- After-tax cash flow
- $1,913/yr
For passive investors: Depreciation is non-cash, so a rental often shows a tax loss while cash-flowing — sheltering income. Rental losses are passive: they offset passive income freely, and up to $25,000/yr can offset ordinary (W-2) income if you actively participate and your MAGI is under $100k (phasing out to $0 by $150k); unused losses carry forward. On sale, claimed depreciation is recaptured at up to 25%, and gains may owe capital-gains tax (a 1031 exchange can defer both). Figures are a year-1 estimate at your 24.0% rate — not tax advice; consult a CPA.
Schools (NCES district)
- District
- Bridgeport School District
- NCES district ID
- 0900450
- Math proficiency
- 9% ▼ -7.00%
- Reading proficiency
- 19% ▼ -10.00%
- Median HH income
- $41,507
- Composite
- 12.09/100
- National rank
- #9656
- State rank
- #151 of 153 in CT
Livability — Bridgeport
- Score
- 81/100
- State rank
- #15
- US rank
- #1374
Category grades
Schools grade is shown separately in the Schools card above.
Census & demographics
- Census place
- Bridgeport, CT
- County
- Fairfield County · 765,532 people
- City population
- 149,153
- Metro
- Bridgeport-Stamford-Norwalk, CT
- Population (ZIP)
- 22,020
- Household income
- $51,634
- Rent vs Own
- Severe rent burden
- 1368.0
Population outlook (Greater Bridgeport County) Hauer SSP2
- By 2040
- 365,581
Race, ethnicity, and origin ACS 2023
- Neighborhood character
- Diverse neighborhood (Simpson 0.65)
- Race & ethnicity
- Hispanic / Latino 51% Black 23% White 20% Two or more races 14% Asian 3% Native American 1%
- Hispanic origin (detail)
- Mexican 3% Puerto Rican 30% Dominican 6%
- Common ancestry
- Romanian 4% Estonian 3% Hispanic 2%
- Foreign-born
- 31% · Canada, Jamaica, Vietnam
- Languages at home
- 47% English-only · Spanish 40% Other Indo-European 5% Russian/Polish/Slavic 3%
Political lean MEDSL · Greater Bridgeport
- 2024 margin
- Strong D (+23.3) · D 60.9% · R 37.6% · Other 1.5%
- All cycles
- 2024: D+23.3
Not yet ingested
- Civics
- —
Market trends
- HPI YoY
- ▼ -29.78%
- Current HPI
- 370.1432
- Rent YoY
- —
- Metro
- Bridgeport-Stamford-Norwalk, CT
- State GDP YoY
- ▲ 1.06%
- F500 in state
- 38
Industry mix (Fortune 500 HQ in CT)
| Industry | F500 HQs | Revenue |
|---|---|---|
| Industrial Machinery | 4 | $38B |
|
||
| Insurance | 3 | $71B |
|
||
| Financial Services | 2 | $25B |
|
||
| Transportation / Logistics | 2 | $18B |
|
||
| Healthcare | 1 | $247B |
|
||
| Telecommunications | 1 | $55B |
|
||
Price history
+642.9% since first listed6 events — show timeline
- 2026-04-24 Pending — Smart MLS
- 2026-04-13 Listed $130,000 Smart MLS
- 2007-10-10 Sold (Public Records) $80,000 Public Records
- 2007-10-09 Sold (MLS) $80,000 Smart MLS
- 2007-07-16 Listed $88,900 Smart MLS
- 1995-05-03 Sold (Public Records) $17,500 Public Records
Property tax history
-2.1%/yrLatest (2023): $1,649 · +0.0% YoY. Source: county tax records.
Cash-flow waterfall
monthlySold comps — $/sqft
last 12 mo · ≤1 miLoading sold comps…