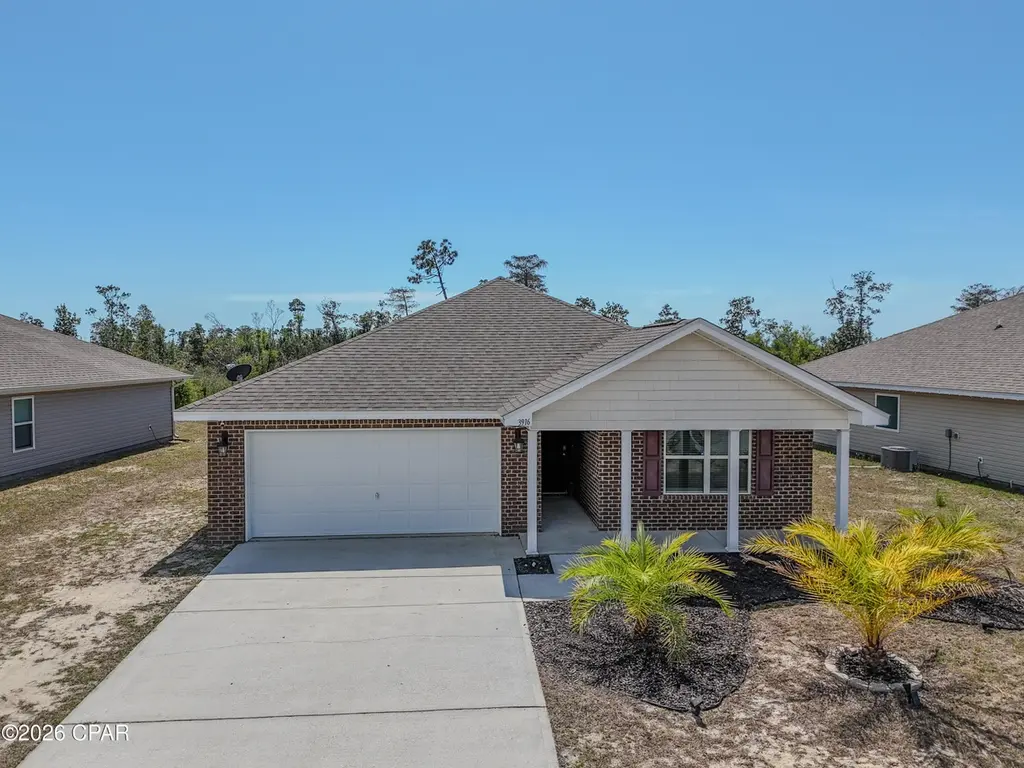
3916 Whitehead Blvd · Springfield, FL
Flood risk 1/10 · Minimal
- FEMA flood zone
- X (unshaded)
- Chance of flooding over 30 yrs
- 0.0%
- Est. flood insurance / yr
- $507 – $1,088
Fire risk 7/10 · Major
- Est. fire insurance / yr
- $947 – $1,759
Heat risk 10/10 · Severe
- Hot days now (above 105°F)
- 7 days/yr
- Hot days in 30 yrs
- 21 days/yr
Wind risk 9/10 · Severe
- Chance of severe wind over 30 yrs
- 99.0%
Air-quality risk 1/10 · Minimal
- Unhealthy air days now
- 0 days/yr
- Unhealthy air days in 30 yrs
- 0 days/yr
Risk factors via First Street. Map © Google.
Why this score? — see what drove the D- grade
The composite is a weighted blend of 9 inputs, each scored 0–100. Each bar is that input's sub-score; the figure is the points it added to the 100-point composite (weight × sub-score).
- Cash flow +11.2/30.0
- ARV discount +10.0/15.0
- Schools +4.3/10.0
- DSCR +3.3/10.0
- Livability +3.0/5.0
- Rent growth +2.8/5.0
- 1% rule +2.6/10.0
- Condition / age +2.5/5.0
- Appreciation +0.0/10.0
$324,900
🖨 Deal sheet (PDF) 📄 Offer letter ✓ Due diligence
Listing remarks MLS
This stunning four-bedroom, two-bathroom residence offers the perfect blend of modern comfort and pristine maintenance in a highly sought-after neighborhood. Situated on a spacious quarter-acre lot, the property feels like new, showcasing an immaculate interior that has been kept in fantastic condition. The thoughtful layout features a mix of durable, contemporary vinyl flooring in the high-traffic areas and plush carpet in the bedrooms for a cozy, inviting feel. With its generous yard and move-in-ready status, this home represents a rare opportunity for those seeking quality and cleanliness in a premier location.
Key facts
- 0.24 acre lot
- 2 garage spots
- Built 2020
Neighborhood map
What this means for you Summary
Snapshot
- This is a 4-bed/3.0-bath single-family listed at $325k.
Deal economics
- At list price, monthly cash flow is $-126 ($-2k/yr) — negative.
- To cash-flow at today's rent, offer at most $303k (6.9% below list).
- To meet the 1% rule (rent ≥ 1% of price), the offer needs to be $246k (24.3% below list).
- Recommended offer: $246k (24.3% below list) — sets the bar for 1% rule.
- Cap rate 5.8% vs local median 4.8% in Springfield — meaningfully above typical; check what's discounted (condition, days-on-market, listing class) to confirm the premium yield is real.
Location & tenants
- Location reads 59/100 on livability (#826 in FL) — a working-class tenant base; expect higher turnover. Strengths: cost of living A+, housing A+, health & safety A+; Watch: employment D, crime F, amenities F.
- Bay (suburban): math 51% / reading 51% proficiency, ranked #29 of 73 in FL (top 40%) — acceptable for families but not a draw, mixed tenant base, ~2y average lease.
- Zoned schools: Cedar Grove Elementary School (math 18% / reading 18%, grade F, #2,115 of 2,144 statewide, top 99%, 562 students, 76% FRL); Merritt Brown Middle School (math 38% / reading 38%, grade F, #388 of 571 statewide, top 69%, 701 students, 55% FRL); Bay High School (math 37% / reading 34%, grade F, #367 of 667 statewide, top 57%, 1,255 students, 53% FRL).
- Zoned-school proficiency averages 30% at this address vs 51% district-wide (-20 pts) — the specific schools serving this property underperform the Bay average; the district grade overstates school quality for this exact location.
- Market conditions: Rents rising (+1.1%/yr); 983 active listings in the ZIP; 2 comparable units currently listed for rent nearby; 2,473 units permitted in Bay County in 2024 (559 in 5+ unit buildings).
- This rent runs 40% of the median local income ($75k/yr) — at the standard rent-burdened threshold; future hikes will face affordability resistance.
Forward outlook
- Local home prices are declining (-3.0%/yr); year-one equity from $2k of loan paydown is wiped out by about $10k of value loss. Plan a longer hold.
- Bay County population projected at +24% by 2050 — long-run rental-demand tailwind backs the buy-and-hold thesis.
Negotiation context
- It's been on market 78 days — a 6% lower offer ($305k) is reasonable based on typical stale-listing flexibility.
- Current owner paid $278k; 17% above their basis — modest negotiation headroom, anchor on the comps not their cost.
Risks & watch-outs
- Climate carrying-cost: severe wind risk, 99% chance of damaging wind over 30y; major wildfire risk; extreme-heat days projected 7→21/yr by 2055 (HVAC capex compounding) — expect insurance premiums to compound above CPI over the hold.
Questions for the listing agent
- What do current leases actually rent for vs. the listed asking? Can we see a recent rent roll and the last 12 months of T-12 income?
- It's been on market 78 days. Have you received any prior offers? Is the seller open to a 24% concession, seller financing, or rate buy-down credit?
- Why hasn't it sold? Are there any deal-killer items the seller is aware of (foundation, flood, title, zoning, code violations)?
- Is there a deadline driving the sale (1031 exchange, divorce, estate, relocation)? That informs how much negotiation room exists.
- Schools are D-rated, which usually means shorter tenancies and higher turnover. Who's the typical renter profile here, and what's been the actual vacancy rate?
- Crime grade is F in this area — have there been break-ins, vandalism, or insurance claims at this property in the last 3 years? What carrier currently insures it and at what premium?
- The area grade is low — what's the realistic commute time and amenity access for the typical tenant pool here? Any planned neighborhood developments (good or bad) we should know about?
- What's the average days-on-market for RENTAL listings here right now (not sales)? A rising rental-DOM trend means longer vacancies and softer asking-rent achievability than the comps imply.
- What's the recent tenant-quality profile in this submarket — average credit score on applications, eviction rate, late-payment / NSF rate, and stable-employment percentage? A property-management company in the area should have these aggregated.
- How much new for-sale + rental construction is in the pipeline within 1–3 miles? Heavy new supply typically softens prices + rents 12–24 months out; constrained supply supports both.
Investment metrics
- 1% rule
- 0.76% ✗
- Cap rate
- 5.83%
- Cash-on-cash
- -1.66%
- DSCR
- 0.93
- GRM
- 11.0
CMA / ARV
- ARV (median comp)
- $344,371
- List price
- $324,900
- Delta
- -5.65%
- Verdict
- FAIR
- Comps
- 20 within 1.0 mi
Show comp detail 12 sales within ~0.75 mi
| Address | Dist | Beds/Ba | Sqft | Sold | Price | $/sf | Match |
|---|---|---|---|---|---|---|---|
| 3074 Lucky Farm Ln | 0.21mi | 4/2.0 | 2,086 (+3%) | 3mo | $395,000 | $189 | 79 |
| 3928 Alwyn Cashe Ave #70 | 0.40mi | 4/2.0 | 2,000 (-1%) | 1mo | $289,990 | $145 | 75 |
| 3940 Alwyn Cashe Ave #73 | 0.40mi | 4/2.0 | 2,000 (-1%) | 2mo | $304,990 | $152 | 74 |
| 3103 Justine Ct | 0.29mi | 3/2.0 (-1) | 1,962 (-3%) | 1mo | $449,900 | $229 | 72 |
| 3930 Lombard St | 0.36mi | 4/2.5 | 1,891 (-6%) | 3mo | $299,990 | $159 | 68 |
| 3930 Lombard St Unit HS 12 | 0.36mi | 4/2.5 | 1,891 (-6%) | 3mo | $299,990 | $159 | 68 |
| 3812 Wall Street St Unit HS 97 | 0.50mi | 4/2.5 | 1,891 (-6%) | 2mo | $288,290 | $152 | 62 |
| 3912 Alwyn Cashe Ave #66 | 0.41mi | 3/2.0 (-1) | 1,891 (-6%) | 2mo | $279,990 | $148 | 60 |
| 3961 Alwyn Cashe Ave #49 | 0.37mi | 3/2.0 (-1) | 1,744 (-14%) | 0mo | $306,490 | $176 | 50 |
| 3908 Alwyn Cashe Ave #65 | 0.41mi | 3/2.0 (-1) | 1,744 (-14%) | 2mo | $259,990 | $149 | 48 |
| 3665 Cedar Park Dr | 0.69mi | 4/2.0 | 1,751 (-13%) | 1mo | $369,000 | $211 | 41 |
| 3695 Cedar Park Dr | 0.73mi | 3/2.0 (-1) | 1,803 (-11%) | 2mo | $379,900 | $211 | 38 |
Match score weights: distance 35% · size 25% · config 20% · recency 20%. Top-matched comps best support the ARV.
Projected returns pro-forma
-3.0% appreciation · 1.12% rent growth · sell at horizon
- IRR
- -21.0%
- Equity multiple
- 0.28×
- Total profit
- $-65,323
- Equity at exit
- $48,444
- IRR
- -19.0%
- Equity multiple
- 0.06×
- Total profit
- $-85,571
- Equity at exit
- $28,091
Cash invested: $90,972 (down + closing). Projections, not guarantees.
Landlord ↔ Tenant lean methodology
- Overall (STATE)
- 87 Strongly Landlord-Friendly
- State Florida
- 87 Strongly Landlord-Friendly · R+3
- County
- — inherits STATE
- City
- — inherits STATE
ZIP-level market 32404
- Home prices YoY
- -16.1%
- Rents YoY
- 1.1%
- Active inventory
- 983
- Price-to-rent
- 11.0×
Monthly cashflow live
- Estimated rent
- $2,461 medium interval (Pro) →
- Mortgage (P&I)
- −$1,704
- Tax from tax record
- −$231 /mo · $2,771/yr
- Insurance
- −$135
- HOA
- −$0
- Vacancy / Maint / Mgmt
- −$517
- Net cashflow
- $-126
Break-even live
Sensitivity live
| Price | -10% $58 | -5% $-34 | +0% $-126 | +5% $-218 | +10% $-310 |
|---|---|---|---|---|---|
| Rent | -10% $-321 | -5% $-223 | +0% $-126 | +5% $-29 | +10% $68 |
| Rate | -1.0pp $37 | -0.5pp $-44 | base $-126 | +0.5pp $-210 | +1.0pp $-296 |
UW: 25.0% down · 7.5% · 30yr · 1.5% tax · 5.0% vac · 8.0% maint · 8.0% mgmt
Financing live
Cash to close
- Down payment
- $81,225
- Closing costs
- $9,747
- Reserves months
- —
- Total cash needed
- —
Loan-product check · same deal, 3 products live
Conventional
25% down · 7.5% · 30yr
- Down + closing
- —
- Monthly P&I
- —
- Monthly cashflow
- —
- DSCR
- —
- Eligible?
- —
Personal DTI + credit; lowest rate.
DSCR
20% down · 8.5% · 30yr
- Down + closing
- —
- Monthly P&I
- —
- Monthly cashflow
- —
- DSCR
- —
- Eligible?
- —
No personal income docs; deal must DSCR.
Hard money
10% down · 12.0% · 12mo
- Down + closing
- —
- Monthly P&I
- —
- Monthly cashflow
- —
- DSCR
- —
- Eligible?
- —
Short-term bridge; refi at stabilization.
Rent comps 2 comps
| Address | Beds | Baths | Sqft | Rent | $/sqft | DOM | Units | Dist |
|---|---|---|---|---|---|---|---|---|
| 3884 Red Deer Cir Panama City, FL | 4.0 | 2.0 | 1972 | $2,200 | $1.12 | 23d | 1 | 0.33mi |
| 3545 Brentwood Pl Panama City, FL | 3.0 | 2.0 | 1617 | $2,200 | $1.36 | 23d | 1 | 1.04mi |
Listing history 23 events
-
2026-06-21remarks 684-char remark
-
2026-06-21statusdays on market $324,900 Pending 78 DOM
-
2026-06-19days on market $324,900 Active 77 DOM
-
2026-06-18days on market $324,900 Active 76 DOM
-
2026-06-17days on market $324,900 Active 75 DOM
-
2026-06-16days on market $324,900 Active 74 DOM
-
2026-06-15days on market $324,900 Active 73 DOM
-
2026-06-14days on market $324,900 Active 71 DOM
-
2026-06-13pricedays on market $324,900 Active 70 DOM
-
2026-06-10days on market $329,900 Active 68 DOM
-
2026-06-09days on market $329,900 Active 67 DOM
-
2026-06-08days on market $329,900 Active 66 DOM
-
2026-06-07days on market $329,900 Active 65 DOM
-
2026-06-05days on market $329,900 Active 62 DOM
-
2026-06-03days on market $329,900 Active 61 DOM
-
2026-06-02days on market $329,900 Active 60 DOM
-
2026-06-01days on market $329,900 Active 59 DOM
-
2026-05-31days on market $329,900 Active 58 DOM
-
2026-05-30days on market $329,900 Active 57 DOM
-
2026-05-01price $329,900 621-char remark
Show marketing remark (621 chars)
This stunning four-bedroom, two-bathroom residence offers the perfect blend of modern comfort and pristine maintenance in a highly sought-after neighborhood. Situated on a spacious quarter-acre lot, the property feels like new, showcasing an immaculate interior that has been kept in fantastic condition. The thoughtful layout features a mix of durable, contemporary vinyl flooring in the high-traffic areas and plush carpet in the bedrooms for a cozy, inviting feel. With its generous yard and move-in-ready status, this home represents a rare opportunity for those seeking quality and cleanliness in a premier location.
-
2026-04-02$339,900 Active 621-char remark
Show marketing remark (621 chars)
This stunning four-bedroom, two-bathroom residence offers the perfect blend of modern comfort and pristine maintenance in a highly sought-after neighborhood. Situated on a spacious quarter-acre lot, the property feels like new, showcasing an immaculate interior that has been kept in fantastic condition. The thoughtful layout features a mix of durable, contemporary vinyl flooring in the high-traffic areas and plush carpet in the bedrooms for a cozy, inviting feel. With its generous yard and move-in-ready status, this home represents a rare opportunity for those seeking quality and cleanliness in a premier location.
-
2019-07-22soldstatus $278,322
-
2019-05-29soldstatus $10,696
ⓘ Source: listings_history table (triggers on properties + properties_extension) + one-shot
backfill from property_details.listing_events for pre-trigger history.
Tax reassessment forecast FL · Resets to sale price
- Current annual tax
- $2,771 · $231/mo
- Projected year-2 tax
- $2,771 · $231/mo
- Expected delta
- $0/yr ($0/mo · 0.0%)
ⓘ Screening estimate from a state-policy table — verify with the county assessor before closing.
Climate risk First Street
- Flood 1/10 Low FEMA zone X (unshaded) · 0% chance over 30 yrs
- Wildfire 7/10 Severe
- Heat 10/10 Extreme 7 d/yr ≥105°F today · 21 d/yr by 30 yrs out
- Wind 9/10 Extreme 99% chance of damaging wind over 30 yrs
- Air quality 1/10 Low 0 unhealthy d/yr today · 0 by 30 yrs out
Nearby sold comps map
Loading sold comps map…
Walkable amenities ~0.75 mi
Loading nearby amenities…
Taxation est. · year 1
- Rental income
- $29,527
- − Mortgage interest
- −$18,199
- − Property taxes
- −$2,771
- − Insurance
- −$1,624
- − Repairs & maintenance
- −$2,362
- − Management
- −$2,362
- − Depreciation
- −$9,452
- Taxable loss
- −$7,243
- Est. tax savings @ 24.0%
- +$1,738
- After-tax cash flow
- $224/yr
For passive investors: Depreciation is non-cash, so a rental often shows a tax loss while cash-flowing — sheltering income. Rental losses are passive: they offset passive income freely, and up to $25,000/yr can offset ordinary (W-2) income if you actively participate and your MAGI is under $100k (phasing out to $0 by $150k); unused losses carry forward. On sale, claimed depreciation is recaptured at up to 25%, and gains may owe capital-gains tax (a 1031 exchange can defer both). Figures are a year-1 estimate at your 24.0% rate — not tax advice; consult a CPA.
Schools (NCES district)
- District
- Bay
- NCES district ID
- 1200090
- Math proficiency
- 51% ▼ -8.00%
- Reading proficiency
- 51% ▼ -7.00%
- Median HH income
- $47,740
- Composite
- 43.41/100
- National rank
- #3014
- State rank
- #29 of 73 in FL
Livability — Springfield
- Score
- 59/100
- State rank
- #826
- US rank
- #20265
Category grades
Schools grade is shown separately in the Schools card above.
Census & demographics
- County
- Bay County · 163,593 people
- City population
- 91,445
- Metro
- Panama City, FL
- Population (ZIP)
- 42,514
- Household income
- $74,708
- Rent vs Own
- Severe rent burden
- 1218.0
Population outlook (Bay County) Hauer SSP2
- Today (2025)
- 206,264 people
- By 2030
- 217,740 · +5.6%
- By 2040
- 238,738 · +15.7%
- By 2050
- 255,545 · +23.9%
- By 2075
- 288,295 · +39.8%
- By 2100
- 288,638 · +39.9%
Race, ethnicity, and origin ACS 2023
- Neighborhood character
- Predominantly White (69%)
- Race & ethnicity
- White 69% Black 12% Two or more races 10% Hispanic / Latino 9% Asian 3%
- Hispanic origin (detail)
- Mexican 2% Puerto Rican 3%
- Common ancestry
- Lithuanian 3% Slovak 2% Italian 2%
- Foreign-born
- 7% · Canada, Vietnam, Mexico
- Languages at home
- 90% English-only · Spanish 6% Vietnamese 1% Other Asian/Pacific 1%
Political lean MEDSL · Bay
- 2024 margin
- Solid R (+47.4) · D 25.8% · R 73.1% · Other 1.1%
- 2008→2024 swing
- -6.6pp toward R · 2008: -40.7pp · 2024: -47.4pp
- All cycles
- 2024: R+47.4 2020: R+43.5 2016: R+46.3 2012: R+43.6 2008: R+40.7
Not yet ingested
- Civics
- —
Market trends
- HPI YoY
- ▼ -50.59%
- Current HPI
- 263.7178
- Rent YoY
- ▲ 1.12%
- Metro
- Panama City, FL
- State GDP YoY
- ▲ 3.28%
- F500 in state
- 36
Industry mix (Fortune 500 HQ in FL)
| Industry | F500 HQs | Revenue |
|---|---|---|
| Industrial Technology | 2 | $29B |
|
||
| Insurance | 2 | $17B |
|
||
| Retail | 1 | $60B |
|
||
| Technology Distribution | 1 | $58B |
|
||
| Homebuilding | 1 | $35B |
|
||
| Technology Manufacturing | 1 | $35B |
|
||
Price history
+2984.3% since first listed4 events — show timeline
- 2026-05-01 Price Changed $329,900 CPARMLS
- 2026-04-02 Listed $339,900 CPARMLS
- 2019-07-22 Sold (Public Records) $278,322 Public Records
- 2019-05-29 Sold (Public Records) $10,696 Public Records
Property tax history
+35.6%/yrLatest (2025): $2,771 · +3.4% YoY. Source: county tax records.
Cash-flow waterfall
monthlySold comps — $/sqft
last 12 mo · ≤1 miLoading sold comps…