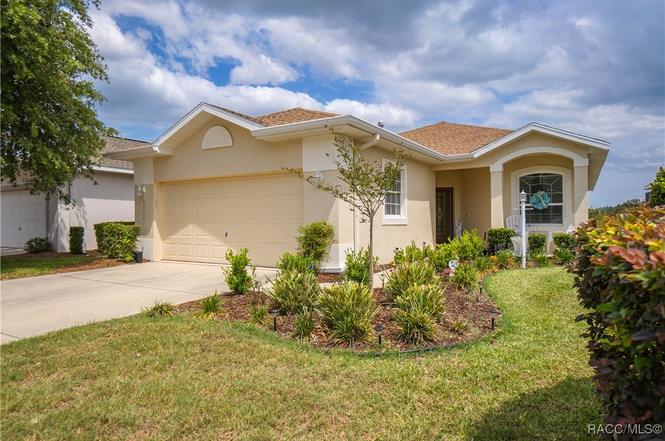
2295 N Andrea Pt · Pine Ridge, FL
Flood risk 1/10 · Minimal
- FEMA flood zone
- X (unshaded)
- Chance of flooding over 30 yrs
- 0.0%
- Est. flood insurance / yr
- $507 – $1,088
Fire risk 4/10 · Minor
- Est. fire insurance / yr
- $947 – $1,759
Heat risk 9/10 · Severe
- Hot days now (above 108°F)
- 7 days/yr
- Hot days in 30 yrs
- 26 days/yr
Wind risk 9/10 · Severe
- Chance of severe wind over 30 yrs
- 99.0%
Air-quality risk 1/10 · Minimal
- Unhealthy air days now
- 0 days/yr
- Unhealthy air days in 30 yrs
- 0 days/yr
Risk factors via First Street. Map © Google.
Why this score? — see what drove the D grade
The composite is a weighted blend of 9 inputs, each scored 0–100. Each bar is that input's sub-score; the figure is the points it added to the 100-point composite (weight × sub-score).
- ARV discount +15.0/15.0
- Cash flow +9.2/30.0
- 1% rule +4.8/10.0
- Schools +4.1/10.0
- Livability +3.4/5.0
- DSCR +2.6/10.0
- Rent growth +2.5/5.0
- Condition / age +2.5/5.0
- Appreciation +0.0/10.0
$230,000
🖨 Deal sheet (PDF) 📄 Offer letter ✓ Due diligence
Listing remarks MLS
Excellent opportunity to own a little slice of heaven! This 2/2/2 with office is carefree and ready for a new family. Property features include NEW AC, NEW STAINLESS STEEL APPLIANCES, NEW CARPET, NEW INTERIOR PAINT, NEW GRANITE, hardwood floors, in ground spa overlooking the golf course and much more. Enjoy all the amenities Brentwood and Citrus Hills have to offer. Located close to dining, shopping, med offices, and world class golf. Citrus Hills membership is required. This is a Fannie Mae HomePath Property.
Key facts
- Access to pools
- Open-concept kitchen
- Screened lanai
Tags
Property features AI
Finance
- Other: Property located in Citrus Hills - Brentwood subdivision
- HOA & community: Homeowners association with monthly fee of $310 (also a quarterly fee of $512.58 listed); HOA covers cable TV, grounds maintenance, and structure maintenance; Community amenities include pool, gated access, golf, street lights, and tennis courts
Exterior
- Parking: Attached 2-car garage; Driveway; Concrete surfaces; Garage door opener
- Security: Gated community; Smoke detectors
- Utilities: Public water; Public sewer
- Home design: Single-family residence; One story
- Construction: Stucco construction; Asphalt shingle roof; Block and slab foundation; Built as single-family residence
- Exterior features: Sliding doors; Cleared, landscaped lot; On golf course; Paved road access; Pool: none
Interior
- Kitchen: Dishwasher; Electric cooktop; Electric oven; Microwave; Refrigerator; Stone counters; Eat-in kitchen
- Bedrooms: Bedrooms with walk-in closet(s)
- Flooring: Tile flooring
- Bathrooms: 2 full bathrooms
- Heating & cooling: Heat pump heating; Central electric air conditioning
- Interior features: Cathedral ceilings; Eat-in kitchen; Stone countertops; Walk-in closet(s); Blinds and window treatments
- Laundry & utility: Washer; Dryer; Water heater
Neighborhood map
What this means for you Summary
Snapshot
- This is a 2-bed/2.0-bath single-family listed at $230k.
Deal economics
- At list price, monthly cash flow is $-174 ($-2k/yr) — negative.
- To cash-flow at today's rent, offer at most $199k (13.3% below list).
- To meet the 1% rule (rent ≥ 1% of price), the offer needs to be $226k (1.7% below list).
- Recommended offer: $199k (13.3% below list) — sets the bar for cash-flow.
- Cap rate 5.4% vs local median 3.4% in Pine Ridge — top-decile yield for the area; either an underpriced asset or a hidden risk that comps aren't pricing in. Stress-test before assuming the spread holds.
Location & tenants
- Location reads 67/100 on livability (#565 in FL) — a middle-class / working-renter tenant base. Strengths: crime A+, housing A+, cost of living A-; Watch: health & safety C-, amenities F, commute F.
- Citrus (rural): math 49% / reading 50% proficiency, ranked #44 of 73 in FL (top 60%) — families likely to look elsewhere, expect single-tenant / working-renter base with shorter leases.
- Zoned schools: Forest Ridge Elementary School (math 55% / reading 59%, grade C+, #781 of 2,144 statewide, top 38%, 708 students, 67% FRL); Lecanto Middle School (math 49% / reading 49%, grade C-, #265 of 571 statewide, top 48%, 809 students, 55% FRL); Lecanto High School (math 46% / reading 53%, grade D, #179 of 667 statewide, top 29%, 1,630 students, 46% FRL) — zoned schools at 56% FRL track the district average.
- Market conditions: 197 active listings in the ZIP; 21 comparable units currently listed for rent nearby; rentals at typical pace (median 22d on market — plan ~3-4 weeks tenant-placement turnaround); 2,443 units permitted in Citrus County in 2024 (0 in 5+ unit buildings).
- This rent runs 43% of the median local income ($63k/yr) — at the standard rent-burdened threshold; future hikes will face affordability resistance.
Forward outlook
- Local home prices are declining (-3.0%/yr); year-one equity from $2k of loan paydown is wiped out by about $7k of value loss. Plan a longer hold.
- Citrus County population projected to shrink 10% by 2050 — rents likely to lag national; underwrite the cash flow, not the appreciation.
Negotiation context
- It's been on market 409 days — a 12% lower offer ($202k) is reasonable based on typical stale-listing flexibility.
- 3 sale attempts since 9y ago; this cycle's ask has dropped $69k (23%) from the opening price — seller is motivated, your offer sets the floor, not the list.
- Current owner paid $155k; 48% above their basis — modest negotiation headroom, anchor on the comps not their cost.
Risks & watch-outs
- Watch-outs: HOA is 21% of rent.
- Climate carrying-cost: severe wind risk, 99% chance of damaging wind over 30y; extreme-heat days projected 7→26/yr by 2055 (HVAC capex compounding) — expect insurance premiums to compound above CPI over the hold.
Questions for the listing agent
- What do current leases actually rent for vs. the listed asking? Can we see a recent rent roll and the last 12 months of T-12 income?
- It's been on market 409 days. Have you received any prior offers? Is the seller open to a 13% concession, seller financing, or rate buy-down credit?
- What does the HOA fee cover, when was the last increase, and are there any pending special assessments or reserve-fund shortfalls?
- Why hasn't it sold? Are there any deal-killer items the seller is aware of (foundation, flood, title, zoning, code violations)?
- Is there a deadline driving the sale (1031 exchange, divorce, estate, relocation)? That informs how much negotiation room exists.
- Schools are F-rated, which usually means shorter tenancies and higher turnover. Who's the typical renter profile here, and what's been the actual vacancy rate?
- The area grade is low — what's the realistic commute time and amenity access for the typical tenant pool here? Any planned neighborhood developments (good or bad) we should know about?
- What's the average days-on-market for RENTAL listings here right now (not sales)? A rising rental-DOM trend means longer vacancies and softer asking-rent achievability than the comps imply.
- What's the recent tenant-quality profile in this submarket — average credit score on applications, eviction rate, late-payment / NSF rate, and stable-employment percentage? A property-management company in the area should have these aggregated.
- How much new for-sale + rental construction is in the pipeline within 1–3 miles? Heavy new supply typically softens prices + rents 12–24 months out; constrained supply supports both.
Investment metrics
- 1% rule
- 0.98% ✗
- Cap rate
- 5.39%
- Cash-on-cash
- -3.24%
- DSCR
- 0.86
- GRM
- 8.5
CMA / ARV
- ARV (on-the-fly)
- $307,074
- Comps found
- 12
Show comp detail 12 sales within ~0.75 mi
| Address | Dist | Beds/Ba | Sqft | Sold | Price | $/sf | Match |
|---|---|---|---|---|---|---|---|
| 1679 W Spring Meadow Loop | 0.14mi | 3/2.5 (+1) | 1,663 (-1%) | 1mo | $241,000 | $145 | 84 |
| 1777 W Zoe Ct | 0.12mi | 3/2.0 (+1) | 1,621 (-3%) | 1mo | $216,000 | $133 | 83 |
| 1883 W Shanelle Path | 0.33mi | 3/2.0 (+1) | 1,655 (-1%) | 1mo | $226,500 | $137 | 76 |
| 2053 N Lakecrest Loop | 0.39mi | 3/2.0 (+1) | 1,686 (+0%) | 2mo | $397,500 | $236 | 74 |
| 2661 N Ezra Ter | 0.48mi | 2/2.0 | 1,606 (-4%) | 1mo | $399,900 | $249 | 70 |
| 1636 W Caroline Path | 0.53mi | 3/2.0 (+1) | 1,686 (+0%) | 1mo | $348,000 | $206 | 69 |
| 1357 W Skyview Crossing Dr | 0.41mi | 3/2.0 (+1) | 1,616 (-4%) | 2mo | $326,500 | $202 | 68 |
| 1873 W Shanelle Path | 0.32mi | 2/2.0 | 1,444 (-14%) | 1mo | $199,000 | $138 | 61 |
| 1876 W Caroline Path | 0.61mi | 3/2.0 (+1) | 1,625 (-3%) | 3mo | $194,900 | $120 | 59 |
| 1196 W Diamond Shore Loop | 0.75mi | 2/2.0 | 1,616 (-4%) | 3mo | $225,000 | $139 | 57 |
| 1251 W Skyview Crossing Dr | 0.56mi | 3/2.0 (+1) | 1,904 (+14%) | 2mo | $525,000 | $276 | 45 |
| 1070 W Skyview Crossing Dr | 0.72mi | 3/2.0 (+1) | 1,835 (+9%) | 3mo | $335,000 | $183 | 44 |
Match score weights: distance 35% · size 25% · config 20% · recency 20%. Top-matched comps best support the ARV.
Projected returns pro-forma
-3.0% appreciation · 3.0% rent growth · sell at horizon
- IRR
- -21.6%
- Equity multiple
- 0.25×
- Total profit
- $-48,076
- Equity at exit
- $34,294
- IRR
- -14.9%
- Equity multiple
- 0.15×
- Total profit
- $-55,052
- Equity at exit
- $19,886
Cash invested: $64,400 (down + closing). Projections, not guarantees.
Landlord ↔ Tenant lean methodology
- Overall (STATE)
- 87 Strongly Landlord-Friendly
- State Florida
- 87 Strongly Landlord-Friendly · R+3
- County
- — inherits STATE
- City
- — inherits STATE
ZIP-level market 34461
- Home prices YoY
- -10.2%
- Active inventory
- 197
- Price-to-rent
- 8.5×
Monthly cashflow live
- Estimated rent
- $2,261 high interval (Pro) →
- Mortgage (P&I)
- −$1,206
- Tax from tax record
- −$178 /mo · $2,134/yr
- Insurance
- −$96
- HOA
- −$480
- Vacancy / Maint / Mgmt
- −$475
- Net cashflow
- $-174
Break-even live
Sensitivity live
| Price | -10% $-44 | -5% $-109 | +0% $-174 | +5% $-239 | +10% $-304 |
|---|---|---|---|---|---|
| Rent | -10% $-352 | -5% $-263 | +0% $-174 | +5% $-84 | +10% $5 |
| Rate | -1.0pp $-58 | -0.5pp $-115 | base $-174 | +0.5pp $-233 | +1.0pp $-294 |
UW: 25.0% down · 7.5% · 30yr · 1.5% tax · 5.0% vac · 8.0% maint · 8.0% mgmt
Financing live
Cash to close
- Down payment
- $57,500
- Closing costs
- $6,900
- Reserves months
- —
- Total cash needed
- —
Loan-product check · same deal, 3 products live
Conventional
25% down · 7.5% · 30yr
- Down + closing
- —
- Monthly P&I
- —
- Monthly cashflow
- —
- DSCR
- —
- Eligible?
- —
Personal DTI + credit; lowest rate.
DSCR
20% down · 8.5% · 30yr
- Down + closing
- —
- Monthly P&I
- —
- Monthly cashflow
- —
- DSCR
- —
- Eligible?
- —
No personal income docs; deal must DSCR.
Hard money
10% down · 12.0% · 12mo
- Down + closing
- —
- Monthly P&I
- —
- Monthly cashflow
- —
- DSCR
- —
- Eligible?
- —
Short-term bridge; refi at stabilization.
Rent comps 21 comps
| Address | Beds | Baths | Sqft | Rent | $/sqft | DOM | Units | Dist |
|---|---|---|---|---|---|---|---|---|
| 2443 N Andrea Pt Lecanto, FL | 3.0 | 2.5 | 1988 | $2,500 | $1.26 | 21d | 1 | 0.13mi |
| 1610 W Spring Meadow Loop Lecanto, FL | 2.0 | 2.5 | 1359 | $2,700 | $1.99 | 21d | 1 | 0.17mi |
| 1658 W Spring Meadow Loop Lecanto, FL | 2.0 | 2.5 | 1359 | $1,775 | $1.31 | 21d | 1 | 0.19mi |
| 1876 W Shanelle Path Lecanto, FL | 3.0 | 2.0 | 1675 | $2,100 | $1.25 | 21d | 1 | 0.27mi |
| 1933 W Shanelle Path Lecanto, FL | 3.0 | 2.0 | 1690 | $2,300 | $1.36 | 21d | 1 | 0.32mi |
| 1973 N Ember Path Hernando, FL | 2.0 | 2.0 | 1786 | $2,800 | $1.57 | 21d | 1 | 0.34mi |
| 1882 W Angelica Loop Lecanto, FL | 3.0 | 2.0 | 1706 | $1,900 | $1.11 | 21d | 1 | 0.55mi |
| 2131 N Pinecone Ave Lecanto, FL | 2.0 | 2.0 | 1438 | $2,000 | $1.39 | 21d | 1 | 0.60mi |
| 1281 W Diamond Shore Loop Hernando, FL | 2.0 | 2.0 | 1686 | $3,000 | $1.78 | 21d | 1 | 0.63mi |
| 1984 W Marsten Ct Lecanto, FL | 3.0 | 2.0 | 1854 | $2,000 | $1.08 | 21d | 1 | 0.71mi |
| 1240 W Diamond Shore Loop Hernando, FL | 2.0 | 2.0 | 1770 | $2,900 | $1.64 | 21d | 1 | 0.72mi |
| 12 Montana St Beverly Hills, FL | 2.0 | 1.0 | 1088 | $1,700 | $1.56 | 21d | 1 | 0.88mi |
| 877 W Silver Meadow Loop Hernando, FL | 3.0 | 2.0 | 1637 | $2,500 | $1.53 | 21d | 1 | 0.89mi |
| 1020 W Rollingwood Ct Hernando, FL | 3.0 | 2.5 | 2146 | $3,400 | $1.58 | 21d | 1 | 0.91mi |
| 209 S Tyler St Beverly Hills, FL | 2.0 | 2.0 | 1604 | $1,500 | $0.94 | 21d | 1 | 1.08mi |
| 95 S Desoto St Beverly Hills, FL | 2.0 | 2.0 | 1152 | $1,435 | $1.25 | 21d | 1 | 1.13mi |
| 3263 N Maidencane Dr Beverly Hills, FL | 2.0 | 1.0 | 1380 | $1,350 | $0.98 | 21d | 1 | 1.19mi |
| 95 S Fillmore St Beverly Hills, FL | 2.0 | 1.0 | 1056 | $1,300 | $1.23 | 21d | 1 | 1.21mi |
| 1024 W Beagle Run Loop Hernando, FL | 3.0 | 2.5 | 2177 | $3,500 | $1.61 | 21d | 1 | 1.23mi |
| 703 W Sunbird Path Hernando, FL | 2.0 | 2.0 | 1298 | $1,700 | $1.31 | 21d | 1 | 1.26mi |
| 42 Roosevelt Blvd Unit 1 Beverly Hills, FL | 3.0 | 1.5 | 1612 | $1,449 | $0.90 | 21d | 1 | 1.38mi |
HOA detail
- Monthly dues
- $480 · $5,760/yr
Listing history 28 events
-
2026-06-19days on market $230,000 Active 409 DOM
-
2026-06-18days on market $230,000 Active 408 DOM
-
2026-06-17days on market $230,000 Active 407 DOM
-
2026-06-16days on market $230,000 Active 406 DOM
-
2026-06-15days on market $230,000 Active 405 DOM
-
2026-06-14days on market $230,000 Active 403 DOM
-
2026-06-13days on market $230,000 Active 402 DOM
-
2026-06-09days on market $230,000 Active 399 DOM
-
2026-06-08days on market $230,000 Active 398 DOM
-
2026-06-03days on market $230,000 Active 393 DOM
-
2026-06-02days on market $230,000 Active 392 DOM
-
2026-06-01days on market $230,000 Active 391 DOM
-
2026-05-31days on market $230,000 Active 390 DOM
-
2026-05-30days on market $230,000 Active 389 DOM
-
2026-05-24price $230,000
-
2026-03-16price $249,000
-
2026-01-20price $259,000
-
2025-11-24price $265,000
-
2025-10-20price $274,000
-
2025-08-11price $279,000
-
2025-08-11price $279,000
-
2025-07-11status Active
-
2025-07-11price $289,000
-
2025-07-11price $289,000
-
2025-07-01status Pending
-
2025-04-26$299,000 Active
-
2017-09-08soldstatus $155,000 515-char remark
Show marketing remark (515 chars)
Excellent opportunity to own a little slice of heaven! This 2/2/2 with office is carefree and ready for a new family. Property features include NEW AC, NEW STAINLESS STEEL APPLIANCES, NEW CARPET, NEW INTERIOR PAINT, NEW GRANITE, hardwood floors, in ground spa overlooking the golf course and much more. Enjoy all the amenities Brentwood and Citrus Hills have to offer. Located close to dining, shopping, med offices, and world class golf. Citrus Hills membership is required. This is a Fannie Mae HomePath Property.
-
2017-05-01$159,900 515-char remark
Show marketing remark (515 chars)
Excellent opportunity to own a little slice of heaven! This 2/2/2 with office is carefree and ready for a new family. Property features include NEW AC, NEW STAINLESS STEEL APPLIANCES, NEW CARPET, NEW INTERIOR PAINT, NEW GRANITE, hardwood floors, in ground spa overlooking the golf course and much more. Enjoy all the amenities Brentwood and Citrus Hills have to offer. Located close to dining, shopping, med offices, and world class golf. Citrus Hills membership is required. This is a Fannie Mae HomePath Property.
ⓘ Source: listings_history table (triggers on properties + properties_extension) + one-shot
backfill from property_details.listing_events for pre-trigger history.
Tax reassessment forecast FL · Resets to sale price
- Current annual tax
- $2,134 · $178/mo
- Projected year-2 tax
- $2,134 · $178/mo
- Expected delta
- $0/yr ($0/mo · 0.0%)
ⓘ Screening estimate from a state-policy table — verify with the county assessor before closing.
Climate risk First Street
- Flood 1/10 Low FEMA zone X (unshaded) · 0% chance over 30 yrs
- Wildfire 4/10 Moderate
- Heat 9/10 Extreme 7 d/yr ≥108°F today · 26 d/yr by 30 yrs out
- Wind 9/10 Extreme 99% chance of damaging wind over 30 yrs
- Air quality 1/10 Low 0 unhealthy d/yr today · 0 by 30 yrs out
Nearby sold comps map
Loading sold comps map…
Walkable amenities ~0.75 mi
Loading nearby amenities…
Taxation est. · year 1
- Rental income
- $27,130
- − Mortgage interest
- −$12,884
- − Property taxes
- −$2,134
- − Insurance
- −$1,150
- − Repairs & maintenance
- −$2,170
- − Management
- −$2,170
- − HOA
- −$5,760
- − Depreciation
- −$6,691
- Taxable loss
- −$5,830
- Est. tax savings @ 24.0%
- +$1,399
- After-tax cash flow
- $-686/yr
For passive investors: Depreciation is non-cash, so a rental often shows a tax loss while cash-flowing — sheltering income. Rental losses are passive: they offset passive income freely, and up to $25,000/yr can offset ordinary (W-2) income if you actively participate and your MAGI is under $100k (phasing out to $0 by $150k); unused losses carry forward. On sale, claimed depreciation is recaptured at up to 25%, and gains may owe capital-gains tax (a 1031 exchange can defer both). Figures are a year-1 estimate at your 24.0% rate — not tax advice; consult a CPA.
Schools (NCES district)
- District
- Citrus
- NCES district ID
- 1200270
- Math proficiency
- 49% ▼ -10.00%
- Reading proficiency
- 50% ▼ -6.00%
- Median HH income
- $38,618
- Composite
- 41.28/100
- National rank
- #3519
- State rank
- #44 of 73 in FL
Livability — Pine Ridge
- Score
- 67/100
- State rank
- #565
- US rank
- #10798
Category grades
Schools grade is shown separately in the Schools card above.
Census & demographics
- Census place
- Pine Ridge, FL
- County
- Citrus County · 111,314 people
- City population
- 18,514
- Metro
- Homosassa Springs, FL
- Population (ZIP)
- 13,377
- Household income
- $63,418
- Rent vs Own
- Severe rent burden
- 41.0
Population outlook (Citrus County) Hauer SSP2
- Today (2025)
- 138,622 people
- By 2030
- 136,886 · -1.3%
- By 2040
- 132,009 · -4.8%
- By 2050
- 125,196 · -9.7%
- By 2075
- 108,570 · -21.7%
- By 2100
- 84,454 · -39.1%
Race, ethnicity, and origin ACS 2023
- Neighborhood character
- Predominantly White (87%)
- Race & ethnicity
- White 87% Hispanic / Latino 8% Two or more races 7% Black 2%
- Hispanic origin (detail)
- Puerto Rican 3%
- Common ancestry
- Romanian 3% Lithuanian 3% Slovak 3%
- Foreign-born
- 8% · Canada, Jamaica
- Languages at home
- 95% English-only · Spanish 3%
Political lean MEDSL · Citrus
- 2024 margin
- Solid R (+45.9) · D 26.8% · R 72.6%
- 2008→2024 swing
- -29.8pp toward R · 2008: -16.1pp · 2024: -45.9pp
- All cycles
- 2024: R+45.9 2020: R+41.0 2016: R+39.7 2012: R+21.9 2008: R+16.1
Not yet ingested
- Civics
- —
Market trends
- HPI YoY
- ▼ -29.48%
- Current HPI
- 258.0866
- Rent YoY
- —
- Metro
- Homosassa Springs, FL
- State GDP YoY
- ▲ 3.28%
- F500 in state
- 36
Industry mix (Fortune 500 HQ in FL)
| Industry | F500 HQs | Revenue |
|---|---|---|
| Industrial Technology | 2 | $29B |
|
||
| Insurance | 2 | $17B |
|
||
| Retail | 1 | $60B |
|
||
| Technology Distribution | 1 | $58B |
|
||
| Homebuilding | 1 | $35B |
|
||
| Technology Manufacturing | 1 | $35B |
|
||
Price history
+43.8% since first listed14 events — show timeline
- 2026-05-24 Price Changed $230,000 RACC
- 2026-03-16 Price Changed $249,000 RACC
- 2026-01-20 Price Changed $259,000 RACC
- 2025-11-24 Price Changed $265,000 RACC
- 2025-10-20 Price Changed $274,000 RACC
- 2025-08-11 Price Changed $279,000 RACC
- 2025-08-11 Price Changed $279,000 Stellar MLS as Distributed by MLS Grid
- 2025-07-11 Relisted — RACC
- 2025-07-11 Price Changed $289,000 RACC
- 2025-07-11 Price Changed $289,000 Stellar MLS as Distributed by MLS Grid
- 2025-07-01 Pending — RACC
- 2025-04-26 Listed $299,000 RACC
- 2017-09-08 Sold (MLS) $155,000 RACC
- 2017-05-01 Listed $159,900 RACC
Property tax history
-0.2%/yrLatest (2025): $2,134 · +5.5% YoY. Source: county tax records.
Cash-flow waterfall
monthlySold comps — $/sqft
last 12 mo · ≤1 miLoading sold comps…