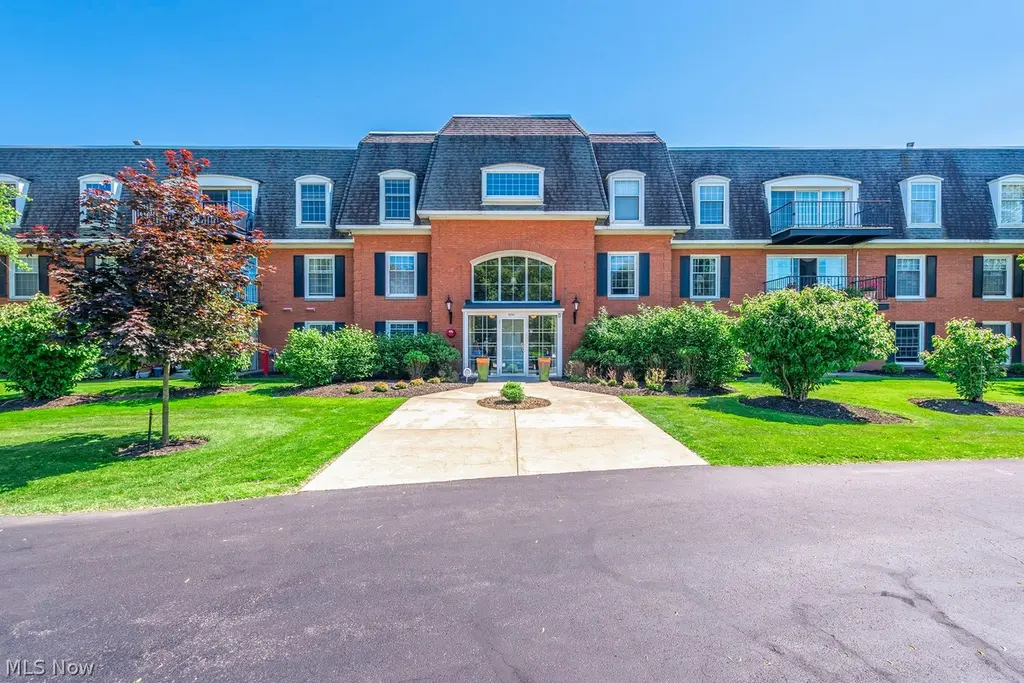
22701 Center Ridge Rd #314 · Rocky River, OH
Flood risk No data
- FEMA flood zone
- —
- Chance of flooding over 30 yrs
- —
- Est. flood insurance / yr
- —
Fire risk No data
- Est. fire insurance / yr
- —
Heat risk No data
- Hot days now (above threshold)
- —
- Hot days in 30 yrs
- —
Wind risk No data
- Chance of severe wind over 30 yrs
- —
Air-quality risk No data
- Unhealthy air days now
- —
- Unhealthy air days in 30 yrs
- —
Risk factors via First Street. Map © Google.
Why this score? — see what drove the C- grade
The composite is a weighted blend of 9 inputs, each scored 0–100. Each bar is that input's sub-score; the figure is the points it added to the 100-point composite (weight × sub-score).
- Cash flow +14.9/30.0
- ARV discount +7.5/15.0
- Schools +7.4/10.0
- 1% rule +6.6/10.0
- DSCR +4.5/10.0
- Livability +4.5/5.0
- Rent growth +2.5/5.0
- Condition / age +2.5/5.0
- Appreciation +0.0/10.0
$176,500
🖨 Deal sheet 📄 Offer letter ✓ Due diligence
Listing remarks MLS
Beautifully maintained 2 bdrm, 2 bath Condo in the Riviera West. Updates: furnace, AC, kitchen cabinets, sink, refrigerator, stove, windows, sliding door, Pergo wood floors in kitchen, halls and bath. Freshly painted walls in Living room, dining room, halls. Carpeting on balcony, window seats with cushion overlooks the wooded area. In-suite utility room. Underground heated parking. Move-in condition. Best kept secret in Condo living. Self managed building, On premise maintenance man. RTA bus stop in front of building.
Key facts
- Formal dining room
- Window seat alcoves
- Wooded views
Tags
Neighborhood map
What this means for you Summary
Snapshot
- This is a 2-bed/2.0-bath condo listed at $176k.
Deal economics
- At list price, monthly cash flow is $50 ($604/yr) — positive.
- The deal already cash-flows at list — no discount required.
- Meets the 1% rule at list price ($2k rent vs $176k).
- Recommended offer: $174k (1.5% below list) — sets the bar for market timing.
- Cap rate 6.6% vs local median 2.1% in Rocky River — top-decile yield for the area; either an underpriced asset or a hidden risk that comps aren't pricing in. Stress-test before assuming the spread holds.
Location & tenants
- Location reads 89/100 on livability (#9 in OH, #112 nationally) — a professional / high-income tenant draw. Strengths: schools A+, crime A+, amenities A+; Watch: commute F.
- Rocky River City (suburban): math 84% / reading 89% proficiency, ranked #26 of 656 in OH (top 4%) — strong family-tenant draw, lease renewals of 3-5y typical; only 13% free/reduced lunch — higher-income household profile.
- Market conditions: 112 active listings in the ZIP; 16 comparable units currently listed for rent nearby; rentals at typical pace (median 21d on market — plan ~3-4 weeks tenant-placement turnaround); solid renter incomes; 1,441 units permitted in Cuyahoga County in 2024 (700 in 5+ unit buildings).
Forward outlook
- Local home prices are declining (-3.0%/yr); year-one equity from $1k of loan paydown is wiped out by about $5k of value loss. Plan a longer hold.
- Cuyahoga County population projected to shrink 8% by 2050 — rents likely to lag national; underwrite the cash flow, not the appreciation.
Negotiation context
- It's been on market 19 days — a 2% lower offer ($174k) is reasonable based on typical stale-listing flexibility.
- 2 sale attempts since 13y ago with the ask held roughly flat each time — persistent listings suggest the price (not the market) is what's stuck; bring a comps-based counter.
- Current owner paid $84k; list at $176k implies a 109% gain — meaningful room to come down on a strong offer.
Questions for the listing agent
- Built in 1969 — when were the roof, HVAC, electrical panel, plumbing, and water heater last replaced?
- What does the HOA fee cover, when was the last increase, and are there any pending special assessments or reserve-fund shortfalls?
- Any open or pending special assessments — roof, HVAC, plumbing, elevator, façade? What's the per-unit balance and payoff schedule, and is the seller paying it off at close or rolling it to the buyer?
- Is there a deadline driving the sale (1031 exchange, divorce, estate, relocation)? That informs how much negotiation room exists.
- Schools are A-rated — typically a magnet for longer-tenancy family renters. What's the average tenant stay here, and is there a school-zone premium baked into asking?
- What's the average days-on-market for RENTAL listings here right now (not sales)? A rising rental-DOM trend means longer vacancies and softer asking-rent achievability than the comps imply.
- What's the recent tenant-quality profile in this submarket — average credit score on applications, eviction rate, late-payment / NSF rate, and stable-employment percentage? A property-management company in the area should have these aggregated.
- How much new apartment / multifamily construction is in the pipeline within 1–3 miles? Heavy new supply (>2% of stock underway) typically softens rents 12–24 months out; light construction supports rent growth.
Investment metrics
- 1% rule
- 1.16% ✓
- Cap rate
- 6.64%
- Cash-on-cash
- 1.22%
- DSCR
- 1.05
- GRM
- 7.2
CMA / ARV
No comps found within radius.
Projected returns pro-forma
-3.0% appreciation · 3.0% rent growth · sell at horizon
- IRR
- -14.2%
- Equity multiple
- 0.49×
- Total profit
- $-25,148
- Equity at exit
- $26,317
- IRR
- -5.2%
- Equity multiple
- 0.66×
- Total profit
- $-16,770
- Equity at exit
- $15,260
Cash invested: $49,420 (down + closing). Projections, not guarantees.
Landlord ↔ Tenant lean methodology
- Overall (STATE)
- 73 Landlord-Friendly
- State Ohio
- 73 Landlord-Friendly · R+6
- County
- — inherits STATE
- City
- — inherits STATE
ZIP-level market 44116
- Active inventory
- 112
- Price-to-rent
- 7.2×
Monthly cashflow live
- Estimated rent
- $2,051 high interval (Pro) →
- Mortgage (P&I)
- −$926
- Tax from tax record
- −$273 /mo · $3,270/yr
- Insurance
- −$74
- HOA
- −$298
- Vacancy / Maint / Mgmt
- −$431
- Net cashflow
- $50
Break-even live
UW: 25.0% down · 7.5% · 30yr · 1.5% tax · 5.0% vac · 8.0% maint · 8.0% mgmt
Financing live
Cash to close
- Down payment
- $44,125
- Closing costs
- $5,295
- Reserves months
- —
- Total cash needed
- —
Loan-product check · same deal, 3 products live
Conventional
25% down · 7.5% · 30yr
- Down + closing
- —
- Monthly P&I
- —
- Monthly cashflow
- —
- DSCR
- —
- Eligible?
- —
Personal DTI + credit; lowest rate.
DSCR
20% down · 8.5% · 30yr
- Down + closing
- —
- Monthly P&I
- —
- Monthly cashflow
- —
- DSCR
- —
- Eligible?
- —
No personal income docs; deal must DSCR.
Hard money
10% down · 12.0% · 12mo
- Down + closing
- —
- Monthly P&I
- —
- Monthly cashflow
- —
- DSCR
- —
- Eligible?
- —
Short-term bridge; refi at stabilization.
Rent comps 16 comps
| Address | Beds | Baths | Sqft | Rent | $/sqft | DOM | Units | Dist |
|---|---|---|---|---|---|---|---|---|
| 22603 Center Ridge Rd Rocky River, OH | 1.0–3.0 | 1.0–2.5 | 2190 | $4,095 | $1.87 | 1d | 23 | 0.04mi |
| 22081 River Oaks Dr Rocky River, OH | 1.0 | 1.0 | 726 | $1,198 | $1.65 | 17d | 2 | 0.42mi |
| 22081 River Oaks Dr Unit B8 Rocky River, OH | 1.0 | 1.0 | 726 | $1,245 | $1.71 | 4d | 1 | 0.43mi |
| 23246 Alexander Rd North Olmsted, OH | 2.0 | 1.0 | 750 | $1,100 | $1.47 | 43d | 1 | 0.94mi |
| 22445 Lorain Rd Fairview Park, OH | 1.0–2.0 | 1.0 | 732 | $1,599 | $2.18 | 1d | 1 | 1.21mi |
| 21045 Southbend Cir Unit 9 Rocky River, OH | 2.0 | 1.0 | 800 | $1,500 | $1.88 | 21d | 1 | 1.26mi |
| 21045 Southbend Cir Apt 8 Rocky River, OH | 2.0 | 1.0 | 800 | $1,500 | $1.88 | 43d | 1 | 1.26mi |
| 21045 Southbend Cir Apt 2 Rocky River, OH | 1.0 | 1.0 | 800 | $1,300 | $1.62 | 43d | 1 | 1.26mi |
| 20588 Lorain Rd Unit 17 Fairview Park, OH | 3.0 | 1.0 | 1066 | $1,295 | $1.21 | 23d | 1 | 1.30mi |
| 20586 Lorain Rd Fairview Park, OH | 3.0 | 1.0 | 1066 | $1,295 | $1.21 | 43d | 1 | 1.31mi |
| 3303 Linden Rd Rocky River, OH | 2.0 | 1.0–1.5 | 645 | $1,739 | $2.70 | 1d | 17 | 1.31mi |
| 20580 Lorain Rd Cleveland, OH | 3.0 | 1.0 | 1066 | $1,345 | $1.26 | 7d | 4 | 1.32mi |
| 20586 Lorain Rd Unit 11 Fairview Park, OH | 3.0 | 1.0 | 1066 | $1,395 | $1.31 | 7d | 1 | 1.33mi |
| 20582 Lorain Rd Unit 28 Fairview Park, OH | 3.0 | 1.0 | 1066 | $1,295 | $1.21 | 43d | 1 | 1.33mi |
| 1930 King James Pkwy Westlake, OH | 1.0 | 2.0 | 903 | $1,150 | $1.27 | 12d | 1 | 1.46mi |
| 4566 W 226th St Cleveland, OH | 3.0 | 1.0 | 1488 | $1,895 | $1.27 | 43d | 1 | 1.48mi |
HOA detail condo
- Monthly dues
- $298 · $3,576/yr
- Assessments
- None detected in remarks — confirm with the listing agent.
Listing history 14 events
-
2026-06-17status $176,500 Pending 19 DOM
-
2026-06-17days on market $176,500 Active 19 DOM
-
2026-06-16days on market $176,500 Active 18 DOM
-
2026-06-15days on market $176,500 Active 17 DOM
-
2026-06-13days on market $176,500 Active 15 DOM
-
2026-06-13days on market $176,500 Active 14 DOM
-
2026-06-09days on market $176,500 Active 11 DOM
-
2026-06-08days on market $176,500 Active 10 DOM
-
2026-06-07days on market $176,500 Active 9 DOM
-
2026-06-05days on market $176,500 Active 6 DOM
-
2026-06-03days on market $176,500 Active 5 DOM
-
2026-06-02days on market $176,500 Active 4 DOM
-
2026-06-01days on market $176,500 Active 3 DOM
-
2026-05-31days on market $176,500 Active 2 DOM
ⓘ Source: listings_history table (triggers on properties + properties_extension) + one-shot
backfill from property_details.listing_events for pre-trigger history.
Tax reassessment forecast OH · Partial reset (capped growth)
- Current annual tax
- $3,270 · $273/mo
- Projected year-2 tax
- $3,270 · $273/mo
- Expected delta
- $0/yr ($0/mo · 0.0%)
ⓘ Screening estimate from a state-policy table — verify with the county assessor before closing.
Nearby sold comps map
Loading sold comps map…
Walkable amenities ~0.75 mi
Loading nearby amenities…
Taxation est. · year 1
- Rental income
- $24,608
- − Mortgage interest
- −$9,887
- − Property taxes
- −$3,270
- − Insurance
- −$882
- − Repairs & maintenance
- −$1,969
- − Management
- −$1,969
- − HOA
- −$3,576
- − Depreciation
- −$5,135
- Taxable loss
- −$2,080
- Est. tax savings @ 24.0%
- +$499
- After-tax cash flow
- $1,103/yr
For passive investors: Depreciation is non-cash, so a rental often shows a tax loss while cash-flowing — sheltering income. Rental losses are passive: they offset passive income freely, and up to $25,000/yr can offset ordinary (W-2) income if you actively participate and your MAGI is under $100k (phasing out to $0 by $150k); unused losses carry forward. On sale, claimed depreciation is recaptured at up to 25%, and gains may owe capital-gains tax (a 1031 exchange can defer both). Figures are a year-1 estimate at your 24.0% rate — not tax advice; consult a CPA.
Schools (NCES district)
- District
- Rocky River City
- NCES district ID
- 3904470
- Math proficiency
- 84% ▼ -8.00%
- Reading proficiency
- 89% ▼ -2.00%
- Median HH income
- $64,592
- Composite
- 74.43/100
- National rank
- #159
- State rank
- #26 of 656 in OH
Livability — Rocky River
- Score
- 89/100
- State rank
- #9
- US rank
- #112
Category grades
Schools grade is shown separately in the Schools card above.
Census & demographics
- Census place
- Rocky River, OH
- County
- Cuyahoga County · 1,090,369 people
- City population
- 21,532
- Metro
- Cleveland-Elyria, OH
- Population (ZIP)
- 21,532
- Household income
- $93,799
- Rent vs Own
- Severe rent burden
- 795.0
Population outlook (Cuyahoga County) Hauer SSP2
- Today (2025)
- 1,244,621 people
- By 2030
- 1,230,093 · -1.2%
- By 2040
- 1,189,108 · -4.5%
- By 2050
- 1,145,706 · -7.9%
- By 2075
- 1,076,557 · -13.5%
- By 2100
- 978,987 · -21.3%
Race, ethnicity, and origin ACS 2023
- Neighborhood character
- Predominantly White (91%)
- Race & ethnicity
- White 91% Two or more races 4% Asian 2% Hispanic / Latino 2% Black 2%
- Common ancestry
- Romanian 6% Lithuanian 3% Italian 2%
- Foreign-born
- 10% · Canada
- Languages at home
- 88% English-only · Other Indo-European 5% Arabic 3% Russian/Polish/Slavic 1%
Political lean MEDSL · Cuyahoga
- 2024 margin
- Solid D (+31.5) · D 65.4% · R 33.9%
- 2008→2024 swing
- -7.4pp toward R · 2008: 38.9pp · 2024: 31.5pp
- All cycles
- 2024: D+31.5 2020: D+34.1 2016: D+35.0 2012: D+38.7 2008: D+38.9
Not yet ingested
- Civics
- —
Market trends
- HPI YoY
- ▼ -180.15%
- Current HPI
- 228.2256
- Rent YoY
- —
- Metro
- Cleveland-Elyria, OH
- State GDP YoY
- ▲ 1.98%
- F500 in state
- 48
Industry mix (Fortune 500 HQ in OH)
| Industry | F500 HQs | Revenue |
|---|---|---|
| Insurance | 3 | $145B |
|
||
| Industrial Machinery | 3 | $49B |
|
||
| Financial Services | 3 | $24B |
|
||
| Consumer Goods | 2 | $93B |
|
||
| Aerospace / Defense | 2 | $47B |
|
||
| Utilities | 2 | $33B |
|
||
Price history
+292.2% since first listed7 events — show timeline
- 2026-05-22 Listed $176,500 MLSNOW
- 2013-10-01 Sold (Public Records) $84,500 Public Records
- 2013-10-01 Sold (MLS) $84,500 MLSNOW
- 2013-02-16 Listed $89,900 MLSNOW
- 1979-01-31 Sold (Public Records) $61,900 Public Records
- 1979-01-31 Sold (Public Records) $61,900 Public Records
- 1977-06-01 Sold (Public Records) $45,000 Public Records
Property tax history
+2.9%/yrLatest (2025): $3,270 · -0.3% YoY. Source: county tax records.
Cash-flow waterfall
monthlySold comps — $/sqft
last 12 mo · ≤1 miLoading sold comps…