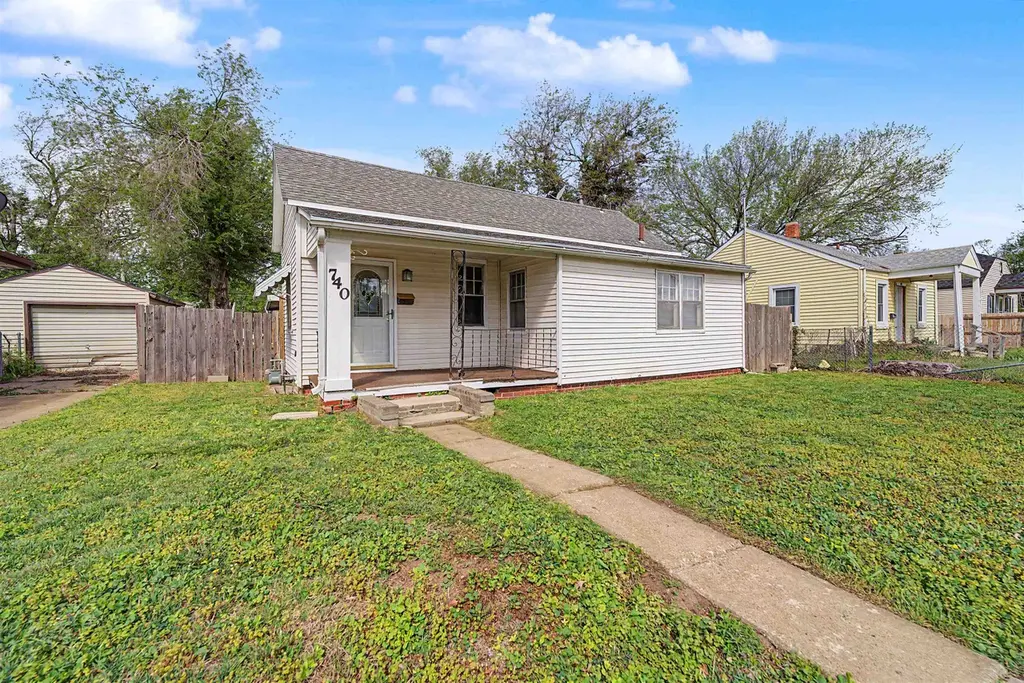
740 Merrill St · Salina, KS
Flood risk 1/10 · Minimal
- FEMA flood zone
- X (shaded)
- Chance of flooding over 30 yrs
- 0.0%
- Est. flood insurance / yr
- $473 – $860
Fire risk 1/10 · Minimal
- Est. fire insurance / yr
- $1,154 – $2,142
Heat risk 5/10 · Moderate
- Hot days now (above 107°F)
- 7 days/yr
- Hot days in 30 yrs
- 17 days/yr
Wind risk 2/10 · Minimal
- Chance of severe wind over 30 yrs
- —
Air-quality risk 1/10 · Minimal
- Unhealthy air days now
- 0 days/yr
- Unhealthy air days in 30 yrs
- 0 days/yr
Risk factors via First Street. Map © Google.
Why this score? — see what drove the D+ grade
The composite is a weighted blend of 9 inputs, each scored 0–100. Each bar is that input's sub-score; the figure is the points it added to the 100-point composite (weight × sub-score).
- Cash flow +16.9/30.0
- ARV discount +7.5/15.0
- DSCR +5.2/10.0
- 1% rule +4.5/10.0
- Rent growth +3.9/5.0
- Livability +3.6/5.0
- Condition / age +2.5/5.0
- Schools +2.2/10.0
- Appreciation +0.0/10.0
$112,000
🖨 Deal sheet 📄 Offer letter ✓ Due diligence
Key facts
- Remodeled bathroom
- Eating bar
- Fenced backyard
Tags
Property features AI
Exterior
- Utilities: Public sewer available
- Home design: Single-family onsite built; One story
- Construction: Composition roof; Partial foundation (no egress window[s])
- Exterior features: Chain link fencing
Interior
- Kitchen: Refrigerator; Range
- Bedrooms: One-level home
- Bathrooms: 1 full bathroom
- Heating & cooling: Central air conditioning; Forced air heating; Natural gas heating
- Interior features: Partially finished basement; Patio
- Laundry & utility: Laundry in basement
Neighborhood map
What this means for you Summary
Snapshot
- This is a 2-bed/1.0-bath single-family listed at $112k.
Deal economics
- At list price, monthly cash flow is $73 ($879/yr) — positive.
- The deal already cash-flows at list — no discount required.
- To meet the 1% rule (rent ≥ 1% of price), the offer needs to be $107k (4.7% below list).
- Recommended offer: $105k (6.0% below list) — sets the bar for market timing.
Location & tenants
- Location reads 71/100 on livability (#127 in KS) — a middle-class / working-renter tenant base. Strengths: cost of living A+, housing A+, health & safety A+; Watch: employment C-, crime F, amenities F.
- Salina (town): math 21% / reading 30% proficiency, ranked #134 of 169 in KS (top 79%) — low school quality limits family demand, transient renter base, plan for 1-2y turnover.
- Zoned schools: Sunset Elem (math 17% / reading 32%, grade F, #540 of 684 statewide, top 82%, 387 students, 80% FRL); Salina South Middle (math 20% / reading 26%, grade F, #125 of 219 statewide, top 59%, 811 students, 62% FRL); Salina High South (math 11% / reading 25%, grade F, #233 of 327 statewide, top 71%, 1,102 students, 54% FRL) — zoned schools average 65% FRL vs 50% district-wide (16 pts higher); higher-poverty schools than district average — tighter screening recommended.
- Market conditions: Rents rising fast (+5.7%/yr); 328 active listings in the ZIP; 293 units permitted in Saline County in 2024 (186 in 5+ unit buildings).
Forward outlook
- Local home prices are declining (-3.0%/yr); year-one equity from $774 of loan paydown is wiped out by about $3k of value loss. Plan a longer hold.
- Saline County population projected to shrink 9% by 2050 — rents likely to lag national; underwrite the cash flow, not the appreciation.
Negotiation context
- It's been on market 64 days — a 6% lower offer ($105k) is reasonable based on typical stale-listing flexibility.
- Current owner paid $68k; list at $112k implies a 65% gain — meaningful room to come down on a strong offer.
Risks & watch-outs
- Watch-outs: built in 1935 — expect roof / HVAC / electrical / plumbing capex.
- Climate carrying-cost: extreme-heat days projected 7→17/yr by 2055 (HVAC capex compounding) — expect insurance premiums to compound above CPI over the hold.
Questions for the listing agent
- It's been on market 64 days. Have you received any prior offers? Is the seller open to a 6% concession, seller financing, or rate buy-down credit?
- Built in 1935 — when were the roof, HVAC, electrical panel, plumbing, and water heater last replaced?
- Why hasn't it sold? Are there any deal-killer items the seller is aware of (foundation, flood, title, zoning, code violations)?
- Is there a deadline driving the sale (1031 exchange, divorce, estate, relocation)? That informs how much negotiation room exists.
- Schools are D-rated, which usually means shorter tenancies and higher turnover. Who's the typical renter profile here, and what's been the actual vacancy rate?
- Crime grade is F in this area — have there been break-ins, vandalism, or insurance claims at this property in the last 3 years? What carrier currently insures it and at what premium?
- The area grade is low — what's the realistic commute time and amenity access for the typical tenant pool here? Any planned neighborhood developments (good or bad) we should know about?
- What's the average days-on-market for RENTAL listings here right now (not sales)? A rising rental-DOM trend means longer vacancies and softer asking-rent achievability than the comps imply.
- What's the recent tenant-quality profile in this submarket — average credit score on applications, eviction rate, late-payment / NSF rate, and stable-employment percentage? A property-management company in the area should have these aggregated.
- How much new for-sale + rental construction is in the pipeline within 1–3 miles? Heavy new supply typically softens prices + rents 12–24 months out; constrained supply supports both.
Investment metrics
- 1% rule
- 0.95% ✗
- Cap rate
- 7.08%
- Cash-on-cash
- 2.80%
- DSCR
- 1.12
- GRM
- 8.7
CMA / ARV
No comps found within radius.
Projected returns pro-forma
-3.0% appreciation · 5.66% rent growth · sell at horizon
- IRR
- -8.9%
- Equity multiple
- 0.66×
- Total profit
- $-10,538
- Equity at exit
- $16,700
- IRR
- 3.8%
- Equity multiple
- 1.31×
- Total profit
- $9,600
- Equity at exit
- $9,684
Cash invested: $31,360 (down + closing). Projections, not guarantees.
Landlord ↔ Tenant lean methodology
- Overall (STATE)
- 83 Strongly Landlord-Friendly
- State Kansas
- 83 Strongly Landlord-Friendly · R+10
- County
- — inherits STATE
- City
- — inherits STATE
ZIP-level market 67401
- Rents YoY
- 5.7%
- Active inventory
- 328
- Price-to-rent
- 8.7×
Monthly cashflow live
- Estimated rent
- $1,068 medium interval (Pro) →
- Mortgage (P&I)
- −$587
- Tax from tax record
- −$136 /mo · $1,636/yr
- Insurance
- −$47
- HOA
- −$0
- Vacancy / Maint / Mgmt
- −$224
- Net cashflow
- $73
Break-even live
UW: 25.0% down · 7.5% · 30yr · 1.5% tax · 5.0% vac · 8.0% maint · 8.0% mgmt
Financing live
Cash to close
- Down payment
- $28,000
- Closing costs
- $3,360
- Reserves months
- —
- Total cash needed
- —
Loan-product check · same deal, 3 products live
Conventional
25% down · 7.5% · 30yr
- Down + closing
- —
- Monthly P&I
- —
- Monthly cashflow
- —
- DSCR
- —
- Eligible?
- —
Personal DTI + credit; lowest rate.
DSCR
20% down · 8.5% · 30yr
- Down + closing
- —
- Monthly P&I
- —
- Monthly cashflow
- —
- DSCR
- —
- Eligible?
- —
No personal income docs; deal must DSCR.
Hard money
10% down · 12.0% · 12mo
- Down + closing
- —
- Monthly P&I
- —
- Monthly cashflow
- —
- DSCR
- —
- Eligible?
- —
Short-term bridge; refi at stabilization.
Listing history 18 events
-
2026-06-19days on market $112,000 Active 64 DOM
-
2026-06-18days on market $112,000 Active 63 DOM
-
2026-06-17days on market $112,000 Active 62 DOM
-
2026-06-16days on market $112,000 Active 61 DOM
-
2026-06-15days on market $112,000 Active 60 DOM
-
2026-06-14days on market $112,000 Active 58 DOM
-
2026-06-12days on market $112,000 Active 57 DOM
-
2026-06-09days on market $112,000 Active 54 DOM
-
2026-06-08days on market $112,000 Active 53 DOM
-
2026-06-07days on market $112,000 Active 52 DOM
-
2026-06-05days on market $112,000 Active 49 DOM
-
2026-06-03days on market $112,000 Active 48 DOM
-
2026-06-02days on market $112,000 Active 47 DOM
-
2026-06-01pricedays on market $112,000 Active 46 DOM
-
2026-05-31days on market $120,000 Active 45 DOM
-
2026-05-30days on market $120,000 Active 44 DOM
-
2026-04-15$120,000 Active
-
2003-05-01soldstatus $68,000
ⓘ Source: listings_history table (triggers on properties + properties_extension) + one-shot
backfill from property_details.listing_events for pre-trigger history.
Tax reassessment forecast KS · Resets to sale price
- Current annual tax
- $1,636 · $136/mo
- Projected year-2 tax
- $1,636 · $136/mo
- Expected delta
- $0/yr ($0/mo · 0.0%)
ⓘ Screening estimate from a state-policy table — verify with the county assessor before closing.
Climate risk First Street
- Flood 1/10 Low FEMA zone X (shaded) · 0% chance over 30 yrs
- Wildfire 1/10 Low
- Heat 5/10 Major 7 d/yr ≥107°F today · 17 d/yr by 30 yrs out
- Wind 2/10 Low
- Air quality 1/10 Low 0 unhealthy d/yr today · 0 by 30 yrs out
Nearby sold comps map
Loading sold comps map…
Walkable amenities ~0.75 mi
Loading nearby amenities…
Taxation est. · year 1
- Rental income
- $12,814
- − Mortgage interest
- −$6,274
- − Property taxes
- −$1,636
- − Insurance
- −$560
- − Repairs & maintenance
- −$1,025
- − Management
- −$1,025
- − Depreciation
- −$3,258
- Taxable loss
- −$964
- Est. tax savings @ 24.0%
- +$231
- After-tax cash flow
- $1,110/yr
For passive investors: Depreciation is non-cash, so a rental often shows a tax loss while cash-flowing — sheltering income. Rental losses are passive: they offset passive income freely, and up to $25,000/yr can offset ordinary (W-2) income if you actively participate and your MAGI is under $100k (phasing out to $0 by $150k); unused losses carry forward. On sale, claimed depreciation is recaptured at up to 25%, and gains may owe capital-gains tax (a 1031 exchange can defer both). Figures are a year-1 estimate at your 24.0% rate — not tax advice; consult a CPA.
Schools (NCES district)
- District
- Salina
- NCES district ID
- 2011370
- Math proficiency
- 21% ▼ -3.00%
- Reading proficiency
- 30% ▼ -1.00%
- Median HH income
- $44,726
- Composite
- 21.94/100
- National rank
- #8224
- State rank
- #134 of 169 in KS
Livability — Salina
- Score
- 71/100
- State rank
- #127
- US rank
- #6569
Category grades
Schools grade is shown separately in the Schools card above.
Census & demographics
- Census place
- Salina, KS
- County
- Saline County · 50,217 people
- City population
- 50,217
- Metro
- Salina, KS
- Population (ZIP)
- 50,217
- Household income
- $64,606
- Rent vs Own
- Severe rent burden
- 1536.0
Population outlook (Saline County) Hauer SSP2
- Today (2025)
- 55,099 people
- By 2030
- 54,446 · -1.2%
- By 2040
- 52,572 · -4.6%
- By 2050
- 50,362 · -8.6%
- By 2075
- 45,522 · -17.4%
- By 2100
- 40,059 · -27.3%
Race, ethnicity, and origin ACS 2023
- Neighborhood character
- Predominantly White (78%)
- Race & ethnicity
- White 78% Hispanic / Latino 13% Two or more races 7% Black 4% Asian 2%
- Hispanic origin (detail)
- Mexican 10%
- Common ancestry
- Lithuanian 3% Iranian 2% Slovak 2%
- Foreign-born
- 4% · Canada, South Korea
- Languages at home
- 91% English-only · Spanish 6% Other Asian/Pacific 1% Korean 1%
Political lean MEDSL · Saline
- 2024 margin
- Solid R (+31.6) · D 33.3% · R 64.9% · Other 1.8%
- 2008→2024 swing
- -5.3pp toward R · 2008: -26.2pp · 2024: -31.6pp
- All cycles
- 2024: R+31.6 2020: R+30.5 2016: R+34.3 2012: R+32.2 2008: R+26.2
Not yet ingested
- Civics
- —
Market trends
- HPI YoY
- ▼ -210.03%
- Current HPI
- 175.4541
- Rent YoY
- ▲ 5.66%
- Metro
- Salina, KS
- State GDP YoY
- —
- F500 in state
- 0
Price history
+76.5% since first listed2 events — show timeline
- 2026-04-15 Listed $120,000 SCKMLS as Distributed by MLS Grid
- 2003-05-01 Sold (Public Records) $68,000 Public Records
Property tax history
+5.9%/yrLatest (2025): $1,636 · +15.6% YoY. Source: county tax records.
Cash-flow waterfall
monthlySold comps — $/sqft
last 12 mo · ≤1 miLoading sold comps…