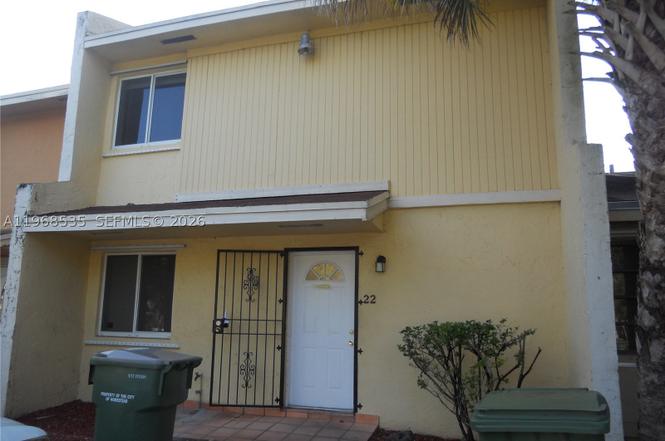
22 SW 14th Ter · Homestead, FL
Flood risk 4/10 · Minor
- FEMA flood zone
- X (unshaded)
- Chance of flooding over 30 yrs
- 0.13%
- Est. flood insurance / yr
- $507 – $1,088
Fire risk 1/10 · Minimal
- Est. fire insurance / yr
- $947 – $1,759
Heat risk 10/10 · Severe
- Hot days now (above 107°F)
- 7 days/yr
- Hot days in 30 yrs
- 31 days/yr
Wind risk 10/10 · Severe
- Chance of severe wind over 30 yrs
- 99.0%
Air-quality risk 2/10 · Minimal
- Unhealthy air days now
- 0 days/yr
- Unhealthy air days in 30 yrs
- 1 days/yr
Risk factors via First Street. Map © Google.
Why this score? — see what drove the D grade
The composite is a weighted blend of 9 inputs, each scored 0–100. Each bar is that input's sub-score; the figure is the points it added to the 100-point composite (weight × sub-score).
- Cash flow +12.5/30.0
- ARV discount +7.5/15.0
- Schools +4.2/10.0
- Livability +3.9/5.0
- 1% rule +3.7/10.0
- DSCR +3.7/10.0
- Rent growth +2.5/5.0
- Condition / age +2.5/5.0
- Appreciation +0.0/10.0
$279,000
🖨 Deal sheet (PDF) 📄 Offer letter ✓ Due diligence
Listing remarks
Two story true townhouse, all tile floors, washer dryer inside, private driveway in the front, fenced backyard in rear. Two bedrooms and one bathroom upstairs. One bedroom and one bathroom downstairs.
Key facts
- Tile floors
- Washer dryer
- Private driveway
Tags
Property features AI
Finance
- Financial info: Lease considered; Pets allowed with restrictions or conditions
- HOA & community: Association fee charged monthly
Exterior
- Parking: Two or more parking spaces
- Utilities: Has heating and cooling; Electric water heater
- Home design: Attached property; 2 stories; Resale property; Entry at ground level
- Construction: Block construction
- Exterior features: Deck
Interior
- Kitchen: Electric range; Dishwasher; Refrigerator; Disposal
- Flooring: Tile
- Bathrooms: 2 full bathrooms
- Heating & cooling: Central heating (electric); Central air conditioning (electric)
- Interior features: First floor entry; Upper-level primary bedroom
- Laundry & utility: Washer; Dryer; Electric water heater
Neighborhood map
What this means for you Summary
Snapshot
- This is a 3-bed/2.0-bath townhouse listed at $279k.
Deal economics
- At list price, monthly cash flow is $-39 ($-472/yr) — negative.
- To cash-flow at today's rent, offer at most $272k (2.5% below list).
- To meet the 1% rule (rent ≥ 1% of price), the offer needs to be $244k (12.7% below list).
- Recommended offer: $244k (12.7% below list) — sets the bar for 1% rule.
- Cap rate 6.1% vs local median 3.5% in Homestead — top-decile yield for the area; either an underpriced asset or a hidden risk that comps aren't pricing in. Stress-test before assuming the spread holds.
Location & tenants
- Location reads 78/100 on livability (#158 in FL, #2,408 nationally) — a middle-class / working-renter tenant base. Strengths: commute A+, housing A+, health & safety A+; Watch: employment C-.
- Miami-Dade (suburban): math 45% / reading 54% proficiency, ranked #40 of 73 in FL (top 55%) — families likely to look elsewhere, expect single-tenant / working-renter base with shorter leases; 64% free/reduced lunch — lower-income household profile, screen leases tightly.
- Zoned schools: West Homestead K-8 Center (math 27% / reading 21%, grade F, #2,057 of 2,144 statewide, top 96%, 851 students, 61% FRL); Homestead Middle School (math 23% / reading 25%, grade F, #532 of 571 statewide, top 94%, 666 students, 81% FRL); South Dade Senior High School (math 23% / reading 32%, grade F, #470 of 667 statewide, top 71%, 3,145 students, 73% FRL).
- Zoned-school proficiency averages 25% at this address vs 50% district-wide (-24 pts) — the specific schools serving this property underperform the Miami-Dade average; the district grade overstates school quality for this exact location.
- Market conditions: 311 active listings in the ZIP; 40 comparable units currently listed for rent nearby; rentals at typical pace (median 19d on market — plan ~3-4 weeks tenant-placement turnaround); 10,051 units permitted in Miami-Dade County in 2024 (7,758 in 5+ unit buildings).
- At $2,436/mo this rent would consume 63% of the median local household income ($46k/yr) (locally 2737% of renters already pay >50% of income on rent) — very limited rent-growth headroom before tenants either downsize or default.
Forward outlook
- Local home prices are declining (-3.0%/yr); year-one equity from $2k of loan paydown is wiped out by about $8k of value loss. Plan a longer hold.
- Miami-Dade County population projected at +28% by 2050 — long-run rental-demand tailwind backs the buy-and-hold thesis.
Negotiation context
- It's been on market 118 days — a 9% lower offer ($254k) is reasonable based on typical stale-listing flexibility.
- 4 sale attempts since 12y ago; this cycle's ask is 11525% above the opening price — seller raised mid-cycle; expect resistance to lowballs.
- Current owner paid $75k; list at $279k implies a 272% gain — meaningful room to come down on a strong offer.
Risks & watch-outs
- Climate carrying-cost: severe wind risk, 99% chance of damaging wind over 30y; extreme-heat days projected 7→31/yr by 2055 (HVAC capex compounding) — expect insurance premiums to compound above CPI over the hold.
Questions for the listing agent
- What do current leases actually rent for vs. the listed asking? Can we see a recent rent roll and the last 12 months of T-12 income?
- It's been on market 118 days. Have you received any prior offers? Is the seller open to a 13% concession, seller financing, or rate buy-down credit?
- What does the HOA fee cover, when was the last increase, and are there any pending special assessments or reserve-fund shortfalls?
- Why hasn't it sold? Are there any deal-killer items the seller is aware of (foundation, flood, title, zoning, code violations)?
- Is there a deadline driving the sale (1031 exchange, divorce, estate, relocation)? That informs how much negotiation room exists.
- Schools are B-rated — typically a magnet for longer-tenancy family renters. What's the average tenant stay here, and is there a school-zone premium baked into asking?
- The area grade is low — what's the realistic commute time and amenity access for the typical tenant pool here? Any planned neighborhood developments (good or bad) we should know about?
- What's the average days-on-market for RENTAL listings here right now (not sales)? A rising rental-DOM trend means longer vacancies and softer asking-rent achievability than the comps imply.
- What's the recent tenant-quality profile in this submarket — average credit score on applications, eviction rate, late-payment / NSF rate, and stable-employment percentage? A property-management company in the area should have these aggregated.
- How much new for-sale + rental construction is in the pipeline within 1–3 miles? Heavy new supply typically softens prices + rents 12–24 months out; constrained supply supports both.
Investment metrics
- 1% rule
- 0.87% ✗
- Cap rate
- 6.12%
- Cash-on-cash
- -0.60%
- DSCR
- 0.97
- GRM
- 9.5
CMA / ARV
No comps found within radius.
Projected returns pro-forma
-3.0% appreciation · 3.0% rent growth · sell at horizon
- IRR
- -17.3%
- Equity multiple
- 0.39×
- Total profit
- $-47,657
- Equity at exit
- $41,600
- IRR
- -9.2%
- Equity multiple
- 0.43×
- Total profit
- $-44,486
- Equity at exit
- $24,123
Cash invested: $78,120 (down + closing). Projections, not guarantees.
Landlord ↔ Tenant lean methodology
- Overall (STATE)
- 87 Strongly Landlord-Friendly
- State Florida
- 87 Strongly Landlord-Friendly · R+3
- County
- — inherits STATE
- City
- — inherits STATE
ZIP-level market 33030
- Home prices YoY
- -33.9%
- Active inventory
- 311
- Price-to-rent
- 9.5×
Monthly cashflow live
- Estimated rent
- $2,436 high interval (Pro) →
- Mortgage (P&I)
- −$1,463
- Tax from tax record
- −$383 /mo · $4,602/yr
- Insurance
- −$116
- HOA
- −$1
- Vacancy / Maint / Mgmt
- −$512
- Net cashflow
- $-39
Break-even live
Sensitivity live
| Price | -10% $119 | -5% $40 | +0% $-39 | +5% $-118 | +10% $-197 |
|---|---|---|---|---|---|
| Rent | -10% $-232 | -5% $-136 | +0% $-39 | +5% $57 | +10% $153 |
| Rate | -1.0pp $101 | -0.5pp $32 | base $-39 | +0.5pp $-112 | +1.0pp $-185 |
UW: 25.0% down · 7.5% · 30yr · 1.5% tax · 5.0% vac · 8.0% maint · 8.0% mgmt
Financing live
Cash to close
- Down payment
- $69,750
- Closing costs
- $8,370
- Reserves months
- —
- Total cash needed
- —
Loan-product check · same deal, 3 products live
Conventional
25% down · 7.5% · 30yr
- Down + closing
- —
- Monthly P&I
- —
- Monthly cashflow
- —
- DSCR
- —
- Eligible?
- —
Personal DTI + credit; lowest rate.
DSCR
20% down · 8.5% · 30yr
- Down + closing
- —
- Monthly P&I
- —
- Monthly cashflow
- —
- DSCR
- —
- Eligible?
- —
No personal income docs; deal must DSCR.
Hard money
10% down · 12.0% · 12mo
- Down + closing
- —
- Monthly P&I
- —
- Monthly cashflow
- —
- DSCR
- —
- Eligible?
- —
Short-term bridge; refi at stabilization.
Rent comps 40 comps
| Address | Beds | Baths | Sqft | Rent | $/sqft | DOM | Units | Dist |
|---|---|---|---|---|---|---|---|---|
| 55 SW 14th Ter #55 Homestead, FL | 3.0 | 2.0 | 1189 | $2,100 | $1.77 | 9d | 1 | 0.02mi |
| 58 SW 14th Ter Unit N/A Homestead, FL | 3.0 | 2.0 | 1232 | $2,500 | $2.03 | 7d | 1 | 0.02mi |
| 58 SW 14th Ter Homestead, FL | 3.0 | 2.0 | 1232 | $2,250 | $1.83 | 26d | 1 | 0.02mi |
| 5 SW 14th Ter Homestead, FL | 3.0 | 2.0 | 1189 | $1,950 | $1.64 | 5d | 1 | 0.03mi |
| 5 SW 14th Ter Homestead, FL | 3.0 | 2.0 | 1189 | $1,950 | $1.64 | 4d | 1 | 0.03mi |
| 4 SW 16th Ave Homestead, FL | 3.0 | 2.0 | 1189 | $1,975 | $1.66 | 7d | 1 | 0.19mi |
| 1666 SW 3rd Ct Homestead, FL | 3.0 | 2.0 | 1232 | $2,800 | $2.27 | 23d | 1 | 0.30mi |
| 19101 SW 318th Ter Homestead, FL | 3.0 | 2.0 | 1300 | $2,800 | $2.15 | 26d | 1 | 0.40mi |
| 944 NW 14th St Homestead, FL | 3.0 | 2.0 | 1320 | $2,200 | $1.67 | 26d | 1 | 0.59mi |
| 1371 NW 9th Ct Florida City, FL | 3.0 | 2.0 | 1240 | $2,700 | $2.18 | 16d | 1 | 0.62mi |
| 1351 NW 9th Ct Florida City, FL | 4.0 | 2.0 | 1415 | $3,000 | $2.12 | 16d | 1 | 0.63mi |
| 1351 NW 9th Ct Florida City, FL | 4.0 | 2.0 | 1415 | $3,200 | $2.26 | 6d | 1 | 0.63mi |
| 565 SW 7th St Unit 7 Homestead, FL | 2.0 | 1.0 | 750 | $1,200 | $1.60 | 26d | 1 | 0.69mi |
| 1236 NW 8th Pl Homestead, FL | 3.0 | 2.0 | 1000 | $1,795 | $1.79 | 4d | 1 | 0.69mi |
| 1218 NW 8th Pl Homestead, FL | 3.0 | 2.0 | 1000 | $1,750 | $1.75 | 26d | 1 | 0.70mi |
| 705 NW 13th Ter Homestead, FL | 4.0 | 2.0 | 1395 | $2,800 | $2.01 | 4d | 1 | 0.73mi |
| 705 NW 13th Ter Homestead, FL | 4.0 | 2.0 | 1395 | $2,990 | $2.14 | 26d | 1 | 0.73mi |
| 705 NW 13th Ter Homestead, FL | 4.0 | 2.0 | 1395 | $2,800 | $2.01 | 7d | 1 | 0.73mi |
| 705 NW 13th Ter Homestead, FL | 4.0 | 2.0 | 1395 | $3,100 | $2.22 | 13d | 1 | 0.73mi |
| 501 NW 5th Ave Florida City, FL | 1.0–3.0 | 1.0–2.0 | 968 | $1,174 | $1.21 | 23d | 1 | 0.77mi |
| 565 SW 8th St Unit 8 Homestead, FL | 2.0 | 1.0 | 800 | $1,200 | $1.50 | 26d | 1 | 0.77mi |
| 839 NW 12th St Unit 839-5 Florida City, FL | 3.0 | 2.0 | 1400 | $2,195 | $1.57 | 4d | 1 | 0.78mi |
| 957 NW 10th St #2 Florida City, FL | 3.0 | 2.5 | 1292 | $2,600 | $2.01 | 12d | 1 | 0.81mi |
| 957 NW 10th St #2 Florida City, FL | 3.0 | 2.5 | 1292 | $2,600 | $2.01 | 9d | 1 | 0.81mi |
| 1329 NW 6th Ave Unit A Florida City, FL | 2.0 | 1.0 | 940 | $1,900 | $2.02 | 4d | 1 | 0.86mi |
| 1329 NW 6th Ave Unit A Florida City, FL | 2.0 | 1.0 | 940 | $1,900 | $2.02 | 5d | 1 | 0.86mi |
| 30651 SW 189th Ave Unit N/A Homestead, FL | 3.0 | 2.0 | 1393 | $3,400 | $2.44 | 18d | 1 | 0.92mi |
| 845 NW 12th St Florida City, FL | 3.0 | 2.0 | 1000 | $1,895 | $1.90 | 23d | 1 | 0.97mi |
| 440 NW 13th St Florida City, FL | 2.0 | 1.0 | 800 | $2,400 | $3.00 | 23d | 1 | 0.98mi |
| 426 NW 13th St Florida City, FL | 2.0 | 1.0 | 800 | $2,400 | $3.00 | 26d | 1 | 1.00mi |
| 448 NW 12th St #448 Florida City, FL | 3.0 | 2.5 | 1464 | $2,350 | $1.61 | 18d | 1 | 1.02mi |
| 440 NW 11th St Unit 1 Florida City, FL | 3.0 | 3.0 | 1425 | $2,550 | $1.79 | 26d | 1 | 1.03mi |
| 415 NW 13th Ct Florida City, FL | 4.0 | 3.0 | 1500 | $2,900 | $1.93 | 26d | 1 | 1.03mi |
| 389 NW 10th St Florida City, FL | 3.0 | 3.0 | 1380 | $2,200 | $1.59 | 26d | 1 | 1.05mi |
| 1037 NW 5th Ave Unit 1037 Florida City, FL | 3.0 | 3.0 | 1425 | $2,700 | $1.89 | 19d | 1 | 1.07mi |
| 696 NW 6th St Homestead, FL | 3.0 | 2.5 | 1466 | $2,700 | $1.84 | 26d | 1 | 1.11mi |
| 696 NW 6th St Homestead, FL | 3.0 | 2.5 | 1466 | $2,500 | $1.71 | 7d | 1 | 1.11mi |
| 1041 NW 5th St Unit 1041 Florida City, FL | 3.0 | 3.0 | 1425 | $2,350 | $1.65 | 9d | 1 | 1.13mi |
| 1041 NW 5th St Unit 1041 Florida City, FL | 3.0 | 3.0 | 1425 | $2,390 | $1.68 | 26d | 1 | 1.13mi |
| 1073 NW 5th St Unit 1073 Florida City, FL | 3.0 | 3.0 | 1425 | $2,500 | $1.75 | 26d | 1 | 1.14mi |
HOA detail
- Monthly dues
- $1 · $12/yr
Listing history 33 events
-
2026-06-21days on market $279,000 Active 118 DOM
-
2026-06-18days on market $279,000 Active 115 DOM
-
2026-06-17days on market $279,000 Active 114 DOM
-
2026-06-16days on market $279,000 Active 113 DOM
-
2026-06-15days on market $279,000 Active 112 DOM
-
2026-06-13days on market $279,000 Active 110 DOM
-
2026-06-09days on market $279,000 Active 106 DOM
-
2026-06-08days on market $279,000 Active 105 DOM
-
2026-06-07days on market $279,000 Active 104 DOM
-
2026-06-04days on market $279,000 Active 101 DOM
-
2026-06-03days on market $279,000 Active 100 DOM
-
2026-06-02days on market $279,000 Active 99 DOM
-
2026-06-01days on market $279,000 Active 98 DOM
-
2026-05-31days on market $279,000 Active 97 DOM
-
2026-05-25price $279,000
-
2026-05-15price $281,000
-
2026-05-06price $283,000
-
2026-04-29historical $2,400
-
2026-04-22price $285,000
-
2026-04-10price $287,000
-
2026-03-28price $289,000
-
2026-03-20price $291,000
-
2026-03-11price $293,000
-
2026-02-24$2,400
-
2026-02-19$295,000 Active
-
2015-10-18historical
-
2015-01-28price $95,500
-
2015-01-28$45,500 Active
-
2015-01-24historical
-
2014-10-21$99,900 Active
-
2003-01-02soldstatus $75,000
-
1996-11-05soldstatus $25,000
-
1995-06-07soldstatus $23,400
ⓘ Source: listings_history table (triggers on properties + properties_extension) + one-shot
backfill from property_details.listing_events for pre-trigger history.
Tax reassessment forecast FL · Resets to sale price
- Current annual tax
- $4,602 · $383/mo
- Projected year-2 tax
- $4,602 · $383/mo
- Expected delta
- $0/yr ($0/mo · 0.0%)
ⓘ Screening estimate from a state-policy table — verify with the county assessor before closing.
Climate risk First Street
- Flood 4/10 Moderate FEMA zone X (unshaded) · 13% chance over 30 yrs
- Wildfire 1/10 Low
- Heat 10/10 Extreme 7 d/yr ≥107°F today · 31 d/yr by 30 yrs out
- Wind 10/10 Extreme 99% chance of damaging wind over 30 yrs
- Air quality 2/10 Low 0 unhealthy d/yr today · 1 by 30 yrs out
Nearby sold comps map
Loading sold comps map…
Walkable amenities ~0.75 mi
Loading nearby amenities…
Taxation est. · year 1
- Rental income
- $29,233
- − Mortgage interest
- −$15,628
- − Property taxes
- −$4,602
- − Insurance
- −$1,395
- − Repairs & maintenance
- −$2,339
- − Management
- −$2,339
- − HOA
- −$12
- − Depreciation
- −$8,116
- Taxable loss
- −$5,198
- Est. tax savings @ 24.0%
- +$1,247
- After-tax cash flow
- $775/yr
For passive investors: Depreciation is non-cash, so a rental often shows a tax loss while cash-flowing — sheltering income. Rental losses are passive: they offset passive income freely, and up to $25,000/yr can offset ordinary (W-2) income if you actively participate and your MAGI is under $100k (phasing out to $0 by $150k); unused losses carry forward. On sale, claimed depreciation is recaptured at up to 25%, and gains may owe capital-gains tax (a 1031 exchange can defer both). Figures are a year-1 estimate at your 24.0% rate — not tax advice; consult a CPA.
Schools (NCES district)
- District
- Miami-Dade
- NCES district ID
- 1200390
- Math proficiency
- 45% ▼ -16.00%
- Reading proficiency
- 54% ▼ -5.00%
- Median HH income
- $43,928
- Composite
- 41.76/100
- National rank
- #3397
- State rank
- #40 of 73 in FL
Livability — Homestead
- Score
- 78/100
- State rank
- #158
- US rank
- #2408
Category grades
Schools grade is shown separately in the Schools card above.
Census & demographics
- Census place
- Homestead, FL
- County
- Miami-Dade County · 2,697,751 people
- City population
- 191,470
- Metro
- Miami-Fort Lauderdale-Pompano Beach, FL
- Population (ZIP)
- 37,678
- Household income
- $46,202
- Rent vs Own
- Severe rent burden
- 2737.0
Population outlook (Miami-Dade County) Hauer SSP2
- Today (2025)
- 3,126,439 people
- By 2030
- 3,325,765 · +6.4%
- By 2040
- 3,697,561 · +18.3%
- By 2050
- 4,012,134 · +28.3%
- By 2075
- 4,605,612 · +47.3%
- By 2100
- 4,866,598 · +55.7%
Race, ethnicity, and origin ACS 2023
- Neighborhood character
- Predominantly Hispanic (76%)
- Race & ethnicity
- Hispanic / Latino 76% Two or more races 26% Black 13% White 9% Native American 3%
- Hispanic origin (detail)
- Mexican 15% Puerto Rican 4% Cuban 19% Dominican 2%
- Common ancestry
- Hispanic 4%
- Foreign-born
- 44% · Canada, Jamaica
- Languages at home
- 26% English-only · Spanish 67% French/Haitian/Cajun 3% Other Indo-European 1%
Political lean MEDSL · Miami-Dade
- 2024 margin
- R (+11.4) · D 43.9% · R 55.4%
- 2008→2024 swing
- -27.6pp toward R · 2008: 16.1pp · 2024: -11.4pp
- All cycles
- 2024: R+11.4 2020: D+7.3 2016: D+29.6 2012: D+23.7 2008: D+16.1
Not yet ingested
- Civics
- —
Market trends
- HPI YoY
- ▼ -237.89%
- Current HPI
- 463.2221
- Rent YoY
- —
- Metro
- Miami-Fort Lauderdale-Pompano Beach, FL
- State GDP YoY
- ▲ 3.28%
- F500 in state
- 36
Industry mix (Fortune 500 HQ in FL)
| Industry | F500 HQs | Revenue |
|---|---|---|
| Industrial Technology | 2 | $29B |
|
||
| Insurance | 2 | $17B |
|
||
| Retail | 1 | $60B |
|
||
| Technology Distribution | 1 | $58B |
|
||
| Homebuilding | 1 | $35B |
|
||
| Technology Manufacturing | 1 | $35B |
|
||
Price history
+1092.3% since first listed19 events — show timeline
- 2026-05-25 Price Changed $279,000 MARMLS
- 2026-05-15 Price Changed $281,000 MARMLS
- 2026-05-06 Price Changed $283,000 MARMLS
- 2026-04-29 Rental Removed $2,400 MARMLS
- 2026-04-22 Price Changed $285,000 MARMLS
- 2026-04-10 Price Changed $287,000 MARMLS
- 2026-03-28 Price Changed $289,000 MARMLS
- 2026-03-20 Price Changed $291,000 MARMLS
- 2026-03-11 Price Changed $293,000 MARMLS
- 2026-02-24 Listed for Rent $2,400 MARMLS
- 2026-02-19 Listed $295,000 MARMLS
- 2015-10-18 Listing Removed — MARMLS
- 2015-01-28 Price Changed $95,500 MARMLS
- 2015-01-28 Listed $45,500 MARMLS
- 2015-01-24 Listing Removed — MARMLS
- 2014-10-21 Listed $99,900 MARMLS
- 2003-01-02 Sold (Public Records) $75,000 Public Records
- 1996-11-05 Sold (Public Records) $25,000 Public Records
- 1995-06-07 Sold (Public Records) $23,400 Public Records
Property tax history
+13.1%/yrLatest (2025): $4,602 · +10.9% YoY. Source: county tax records.
Cash-flow waterfall
monthlySold comps — $/sqft
last 12 mo · ≤1 miLoading sold comps…