7766 Cahill Ln · Jacksonville, FL
Flood risk No data
- FEMA flood zone
- —
- Chance of flooding over 30 yrs
- —
- Est. flood insurance / yr
- —
Fire risk No data
- Est. fire insurance / yr
- —
Heat risk No data
- Hot days now (above threshold)
- —
- Hot days in 30 yrs
- —
Wind risk No data
- Chance of severe wind over 30 yrs
- —
Air-quality risk No data
- Unhealthy air days now
- —
- Unhealthy air days in 30 yrs
- —
Risk factors via First Street. Map © Google.
Why this score? — see what drove the F grade
The composite is a weighted blend of 9 inputs, each scored 0–100. Each bar is that input's sub-score; the figure is the points it added to the 100-point composite (weight × sub-score).
- Cash flow +8.5/30.0
- ARV discount +7.5/15.0
- Livability +4.2/5.0
- Schools +3.9/10.0
- Condition / age +2.5/5.0
- Rent growth +2.4/5.0
- DSCR +2.3/10.0
- 1% rule +1.9/10.0
- Appreciation +0.0/10.0
$309,990
🖨 Deal sheet (PDF) 📄 Offer letter ✓ Due diligence
Listing remarks
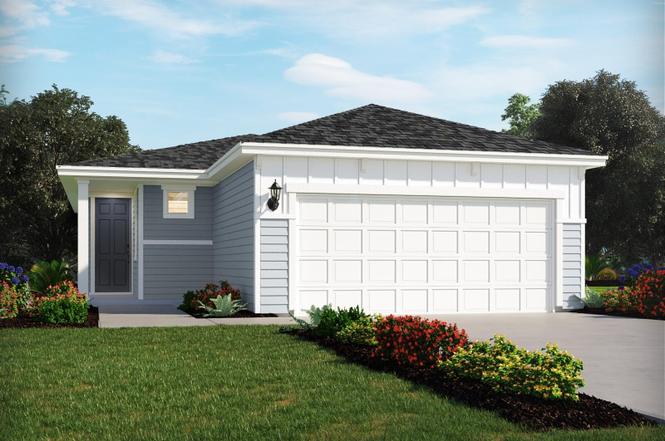
Brand new, energy-efficient home available by Mar 2026! Entertain guests with ease in the open kitchen, dining, and great room that flow to the outside patio. The primary suite is tucked in the rear of the home offering plenty of privacy and features a spacious walk-in closet and standalone shower. Kings Preserve is a beautiful community of single-family homes located in Duval County that offers a natural setting of serene wetland and pond views. Residents will have access to community amenities including a resort-style pool and playground. Just minutes from the I-295 beltway, Kings Preserve offers easy access to all areas of Jacksonville. Five open-concept floorplans offer the features you
Key facts
- Outside patio
- Walk-in closet
- Primary suite
Tags
Neighborhood map
What this means for you Summary
Snapshot
- This is a 4-bed/2.0-bath land listed at $310k.
Deal economics
- At list price, monthly cash flow is $-271 ($-3k/yr) — negative.
- To cash-flow at today's rent, offer at most $262k (15.5% below list).
- To meet the 1% rule (rent ≥ 1% of price), the offer needs to be $214k (30.9% below list).
- Recommended offer: $214k (30.9% below list) — sets the bar for 1% rule.
- Cap rate 5.2% vs local median 3.9% in Jacksonville — top-decile yield for the area; either an underpriced asset or a hidden risk that comps aren't pricing in. Stress-test before assuming the spread holds.
Location & tenants
- Location reads 83/100 on livability (#50 in FL, #911 nationally) — a professional / high-income tenant draw. Strengths: amenities A+, commute A+, housing A+.
- Duval (urban): math 46% / reading 45% proficiency, ranked #48 of 73 in FL (top 66%) — families likely to look elsewhere, expect single-tenant / working-renter base with shorter leases.
- Zoned schools: Dinsmore Elementary School (math 61% / reading 47%, grade C, #936 of 2,144 statewide, top 44%, 595 students, 53% FRL); Highlands Middle School (math 31% / reading 21%, grade F, #506 of 571 statewide, top 89%, 697 students, 73% FRL); Jean Ribault High School (math 22% / reading 25%, grade F, #533 of 667 statewide, top 80%, 1,385 students, 71% FRL) — zoned schools average 66% FRL vs 49% district-wide (16 pts higher); higher-poverty schools than district average — tighter screening recommended.
- Market conditions: Rents soft (-0.2%/yr); 549 active listings in the ZIP; 7 comparable units currently listed for rent nearby; rentals at typical pace (median 26d on market — plan ~3-4 weeks tenant-placement turnaround); 6,503 units permitted in Duval County in 2024 (1,131 in 5+ unit buildings).
- This rent runs 36% of the median local income ($72k/yr) — at the standard rent-burdened threshold; future hikes will face affordability resistance.
Forward outlook
- Local home prices are declining (-3.0%/yr); year-one equity from $2k of loan paydown is wiped out by about $9k of value loss. Plan a longer hold.
- Duval County population projected at +19% by 2050 — long-run rental-demand tailwind backs the buy-and-hold thesis.
Negotiation context
- It's been on market 31 days — a 3% lower offer ($301k) is reasonable based on typical stale-listing flexibility.
- 2 sale attempts with the ask held roughly flat each time — persistent listings suggest the price (not the market) is what's stuck; bring a comps-based counter.
Questions for the listing agent
- What do current leases actually rent for vs. the listed asking? Can we see a recent rent roll and the last 12 months of T-12 income?
- It's been on market 31 days. Have you received any prior offers? Is the seller open to a 31% concession, seller financing, or rate buy-down credit?
- What does the HOA fee cover, when was the last increase, and are there any pending special assessments or reserve-fund shortfalls?
- Is there a deadline driving the sale (1031 exchange, divorce, estate, relocation)? That informs how much negotiation room exists.
- Schools are B-rated — typically a magnet for longer-tenancy family renters. What's the average tenant stay here, and is there a school-zone premium baked into asking?
- The area grade is low — what's the realistic commute time and amenity access for the typical tenant pool here? Any planned neighborhood developments (good or bad) we should know about?
- What's the average days-on-market for RENTAL listings here right now (not sales)? A rising rental-DOM trend means longer vacancies and softer asking-rent achievability than the comps imply.
- What's the recent tenant-quality profile in this submarket — average credit score on applications, eviction rate, late-payment / NSF rate, and stable-employment percentage? A property-management company in the area should have these aggregated.
- How much new for-sale + rental construction is in the pipeline within 1–3 miles? Heavy new supply typically softens prices + rents 12–24 months out; constrained supply supports both.
Investment metrics
- 1% rule
- 0.69% ✗
- Cap rate
- 5.24%
- Cash-on-cash
- -3.75%
- DSCR
- 0.83
- GRM
- 12.1
CMA / ARV
No comps found within radius.
Projected returns pro-forma
-3.0% appreciation · 0.0% rent growth · sell at horizon
- IRR
- -25.7%
- Equity multiple
- 0.15×
- Total profit
- $-73,852
- Equity at exit
- $46,221
- IRR
- -34.0%
- Equity multiple
- -0.28×
- Total profit
- $-111,110
- Equity at exit
- $26,802
Cash invested: $86,797 (down + closing). Projections, not guarantees.
Landlord ↔ Tenant lean methodology
- Overall (STATE)
- 87 Strongly Landlord-Friendly
- State Florida
- 87 Strongly Landlord-Friendly · R+3
- County
- — inherits STATE
- City
- — inherits STATE
ZIP-level market 32219
- Home prices YoY
- -22.3%
- Rents YoY
- -0.2%
- Active inventory
- 549
- Price-to-rent
- 12.1×
Monthly cashflow live
- Estimated rent
- $2,141 high interval (Pro) →
- Mortgage (P&I)
- −$1,626
- Tax from tax record
- −$205 /mo · $2,456/yr
- Insurance
- −$129
- HOA
- −$3
- Vacancy / Maint / Mgmt
- −$450
- Net cashflow
- $-271
Break-even live
Sensitivity live
| Price | -10% $-96 | -5% $-183 | +0% $-271 | +5% $-359 | +10% $-447 |
|---|---|---|---|---|---|
| Rent | -10% $-440 | -5% $-356 | +0% $-271 | +5% $-187 | +10% $-102 |
| Rate | -1.0pp $-115 | -0.5pp $-192 | base $-271 | +0.5pp $-351 | +1.0pp $-433 |
UW: 25.0% down · 7.5% · 30yr · 1.5% tax · 5.0% vac · 8.0% maint · 8.0% mgmt
Financing live
Cash to close
- Down payment
- $77,498
- Closing costs
- $9,300
- Reserves months
- —
- Total cash needed
- —
Loan-product check · same deal, 3 products live
Conventional
25% down · 7.5% · 30yr
- Down + closing
- —
- Monthly P&I
- —
- Monthly cashflow
- —
- DSCR
- —
- Eligible?
- —
Personal DTI + credit; lowest rate.
DSCR
20% down · 8.5% · 30yr
- Down + closing
- —
- Monthly P&I
- —
- Monthly cashflow
- —
- DSCR
- —
- Eligible?
- —
No personal income docs; deal must DSCR.
Hard money
10% down · 12.0% · 12mo
- Down + closing
- —
- Monthly P&I
- —
- Monthly cashflow
- —
- DSCR
- —
- Eligible?
- —
Short-term bridge; refi at stabilization.
Rent comps 7 comps
| Address | Beds | Baths | Sqft | Rent | $/sqft | DOM | Units | Dist |
|---|---|---|---|---|---|---|---|---|
| 7843 Greatford Way Jacksonville, FL | 3.0 | 2.0 | 1484 | $1,779 | $1.20 | 23d | 1 | 0.16mi |
| 7053 Civic Club Dr Jacksonville, FL | 4.0 | 2.5 | 1771 | $2,180 | $1.23 | 6d | 1 | 0.82mi |
| 10136 Lancashire Dr Jacksonville, FL | 4.0 | 3.0 | 2114 | $1,995 | $0.94 | 25d | 1 | 0.89mi |
| 7294 Gateway Ct Jacksonville, FL | 3.0 | 2.0 | 1558 | $1,800 | $1.16 | 25d | 1 | 1.03mi |
| 7218 Oxfordshire Ave Jacksonville, FL | 4.0 | 2.0 | 2198 | $2,095 | $0.95 | 25d | 1 | 1.34mi |
| 7217 Nottinghamshire Dr Jacksonville, FL | 3.0 | 2.0 | 1652 | $1,895 | $1.15 | 25d | 1 | 1.36mi |
| 8768 Merseyside Ct Jacksonville, FL | 3.0 | 2.0 | 1615 | $1,839 | $1.14 | 12d | 1 | 1.41mi |
HOA detail
- Monthly dues
- $3 · $36/yr
- Likely covers
- pool
Listing history 5 events
-
2026-03-31status Pending
-
2026-03-04status Active
-
2026-02-17historical
-
2026-02-17price $309,990
-
2026-02-13$308,990 Active
ⓘ Source: listings_history table (triggers on properties + properties_extension) + one-shot
backfill from property_details.listing_events for pre-trigger history.
Tax reassessment forecast FL · Resets to sale price
- Current annual tax
- $2,456 · $205/mo
- Projected year-2 tax
- $2,573 · $214/mo
- Expected delta
- +$117/yr (+$10/mo · 4.7%)
ⓘ Screening estimate from a state-policy table — verify with the county assessor before closing.
Nearby sold comps map
Loading sold comps map…
Walkable amenities ~0.75 mi
Loading nearby amenities…
Taxation est. · year 1
- Rental income
- $25,691
- − Mortgage interest
- −$17,364
- − Property taxes
- −$2,456
- − Insurance
- −$1,550
- − Repairs & maintenance
- −$2,055
- − Management
- −$2,055
- − HOA
- −$36
- − Depreciation
- −$9,018
- Taxable loss
- −$8,844
- Est. tax savings @ 24.0%
- +$2,122
- After-tax cash flow
- $-1,131/yr
For passive investors: Depreciation is non-cash, so a rental often shows a tax loss while cash-flowing — sheltering income. Rental losses are passive: they offset passive income freely, and up to $25,000/yr can offset ordinary (W-2) income if you actively participate and your MAGI is under $100k (phasing out to $0 by $150k); unused losses carry forward. On sale, claimed depreciation is recaptured at up to 25%, and gains may owe capital-gains tax (a 1031 exchange can defer both). Figures are a year-1 estimate at your 24.0% rate — not tax advice; consult a CPA.
Schools (NCES district)
- District
- Duval
- NCES district ID
- 1200480
- Math proficiency
- 46% ▼ -11.00%
- Reading proficiency
- 45% ▼ -4.00%
- Median HH income
- $48,987
- Composite
- 38.97/100
- National rank
- #4076
- State rank
- #48 of 73 in FL
Livability — Jacksonville
- Score
- 83/100
- State rank
- #50
- US rank
- #911
Category grades
Schools grade is shown separately in the Schools card above.
Census & demographics
- Census place
- Jacksonville, FL
- County
- Duval County · 1,015,274 people
- City population
- 979,034
- Metro
- Jacksonville, FL
- Population (ZIP)
- 14,302
- Household income
- $72,184
- Rent vs Own
- Severe rent burden
- 173.0
Population outlook (Duval County) Hauer SSP2
- Today (2025)
- 1,013,010 people
- By 2030
- 1,059,228 · +4.6%
- By 2040
- 1,141,439 · +12.7%
- By 2050
- 1,205,258 · +19.0%
- By 2075
- 1,324,282 · +30.7%
- By 2100
- 1,319,620 · +30.3%
Race, ethnicity, and origin ACS 2023
- Neighborhood character
- Majority Black (55%)
- Race & ethnicity
- Black 55% White 39% Hispanic / Latino 4% Two or more races 3%
- Common ancestry
- Italian 2% Romanian 1% Hispanic 1%
- Foreign-born
- 4% · Canada, Jamaica
- Languages at home
- 95% English-only · Spanish 3% French/Haitian/Cajun 0%
Political lean MEDSL · Duval
- 2024 margin
- Toss-up / Even · D 48.7% · R 50.1% · Other 1.2%
- 2008→2024 swing
- +0.4pp no change · 2008: -1.9pp · 2024: -1.5pp
- All cycles
- 2024: R+1.5 2020: D+3.8 2016: R+1.5 2012: R+3.6 2008: R+1.9
Not yet ingested
- Civics
- —
Market trends
- HPI YoY
- ▼ -75.90%
- Current HPI
- 263.8901
- Rent YoY
- ▼ -0.25%
- Metro
- Jacksonville, FL
- State GDP YoY
- ▲ 3.28%
- F500 in state
- 36
Industry mix (Fortune 500 HQ in FL)
| Industry | F500 HQs | Revenue |
|---|---|---|
| Industrial Technology | 2 | $29B |
|
||
| Insurance | 2 | $17B |
|
||
| Retail | 1 | $60B |
|
||
| Technology Distribution | 1 | $58B |
|
||
| Homebuilding | 1 | $35B |
|
||
| Technology Manufacturing | 1 | $35B |
|
||
Price history
+0.3% since first listed5 events — show timeline
- 2026-03-31 Pending — realMLS
- 2026-03-04 Relisted — realMLS
- 2026-02-17 Price Changed $309,990 realMLS
- 2026-02-17 Listing Removed — realMLS
- 2026-02-13 Listed $308,990 realMLS
Cash-flow waterfall
monthlySold comps — $/sqft
last 12 mo · ≤1 miLoading sold comps…