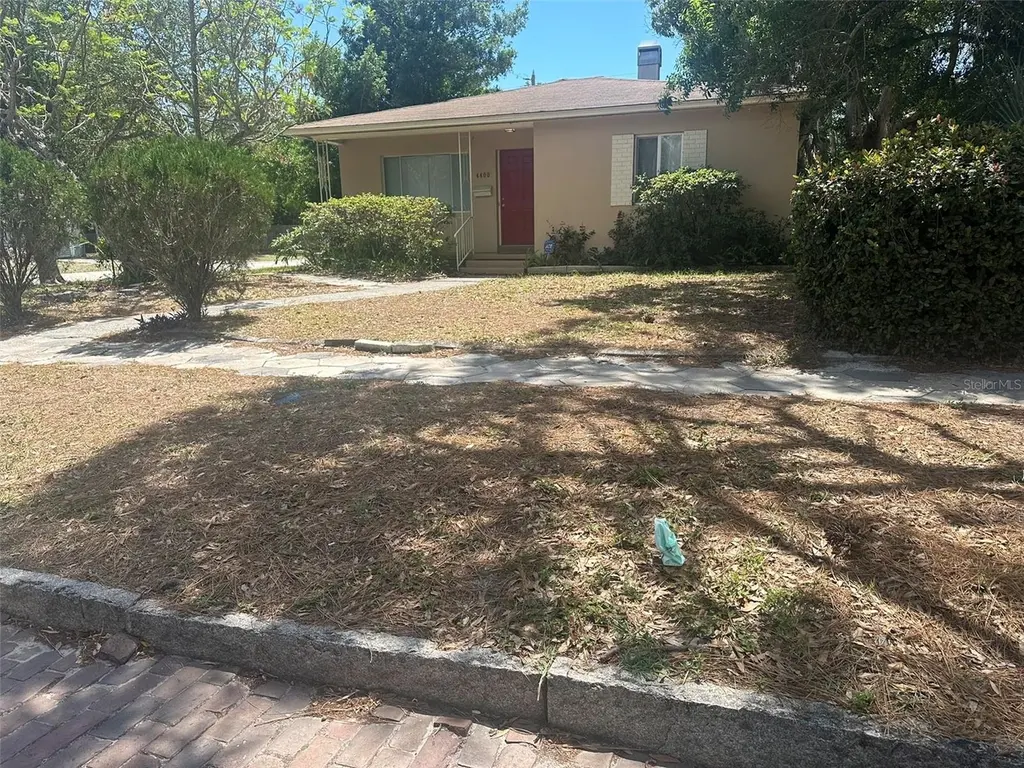
4400 3rd Ave S · St. Petersburg, FL
Flood risk 1/10 · Minimal
- FEMA flood zone
- X (unshaded)
- Chance of flooding over 30 yrs
- 0.0%
- Est. flood insurance / yr
- $507 – $1,088
Fire risk 1/10 · Minimal
- Est. fire insurance / yr
- $947 – $1,759
Heat risk 10/10 · Severe
- Hot days now (above 106°F)
- 7 days/yr
- Hot days in 30 yrs
- 26 days/yr
Wind risk 10/10 · Severe
- Chance of severe wind over 30 yrs
- 99.0%
Air-quality risk 4/10 · Minor
- Unhealthy air days now
- 4 days/yr
- Unhealthy air days in 30 yrs
- 4 days/yr
Risk factors via First Street. Map © Google.
Why this score? — see what drove the C- grade
The composite is a weighted blend of 9 inputs, each scored 0–100. Each bar is that input's sub-score; the figure is the points it added to the 100-point composite (weight × sub-score).
- Cash flow +15.8/30.0
- ARV discount +15.0/15.0
- DSCR +4.9/10.0
- Schools +4.3/10.0
- 1% rule +4.1/10.0
- Livability +2.5/5.0
- Condition / age +2.5/5.0
- Rent growth +2.1/5.0
- Appreciation +0.0/10.0
$239,000
🖨 Deal sheet (PDF) 📄 Offer letter ✓ Due diligence
Listing remarks
Under contract-accepting backup offers. CASH OR HARD MONEY ONLY!!!!! Located in the highly sought-after Central Avenue district, this charming St. Pete classic offers solid block construction and timeless character. Featuring 1,135 square feet of living space, this home sits on a desirable corner lot along a picturesque brick road in a premium location. The property boasts newer windows, central air conditioning, and a spacious floor plan with plenty of potential to make it your own. While the home could benefit from updates and repairs, it has been priced accordingly making it a fantastic opportunity for investors or buyers looking to add value.
Key facts
- Spacious floor plan
- Newer windows
- Corner lot
Tags
Property features AI
Finance
- Other: Unfurnished
- Financial info: No lease restrictions
- HOA & community: No association
Exterior
- Parking: Driveway; Attached 1-car garage
- Utilities: Public water; Public sewer; Electricity available
- Home design: Single family residence; Residential property; One story; Faces north
- Construction: Block construction; Shingle roof; Slab foundation; Built area approximately 1,522 sq ft
- Exterior features: Front porch; Sidewalk; Mature landscaping; Corner lot; Within city limits; Asphalt/paved roads
Interior
- Kitchen: Dishwasher; Microwave; Range; Refrigerator
- Bedrooms: 2 bedrooms
- Flooring: Carpet
- Bathrooms: 1 full bathroom
- Heating & cooling: Central heating; Central air conditioning
- Interior features: Ceiling fans; Blinds
- Laundry & utility: Laundry: Other
Neighborhood map
What this means for you Summary
Snapshot
- This is a 2-bed/1.0-bath single-family listed at $239k.
Deal economics
- At list price, monthly cash flow is $111 ($1k/yr) — positive.
- The deal already cash-flows at list — no discount required.
- To meet the 1% rule (rent ≥ 1% of price), the offer needs to be $218k (8.8% below list).
- Recommended offer: $218k (8.8% below list) — sets the bar for 1% rule.
- Cap rate 6.8% vs local median 2.6% in St. Petersburg — top-decile yield for the area; either an underpriced asset or a hidden risk that comps aren't pricing in. Stress-test before assuming the spread holds.
Location & tenants
- Location reads: area grade C — affects rentability + tenant quality, not the cash-flow math above.
- Pinellas (suburban): math 51% / reading 51% proficiency, ranked #31 of 73 in FL (top 42%) — acceptable for families but not a draw, mixed tenant base, ~2y average lease.
- Zoned schools: Bear Creek Elementary School (math 47% / reading 42%, grade F, #1,288 of 2,144 statewide, top 62%, 286 students, 82% FRL); Azalea Middle School (math 26% / reading 27%, grade F, #503 of 571 statewide, top 88%, 678 students, 74% FRL); Boca Ciega High School (math 24% / reading 33%, grade F, #458 of 667 statewide, top 69%, 1,423 students, 64% FRL) — zoned schools average 73% FRL vs 48% district-wide (25 pts higher); higher-poverty schools than district average — tighter screening recommended.
- Zoned-school proficiency averages 33% at this address vs 51% district-wide (-18 pts) — the specific schools serving this property underperform the Pinellas average; the district grade overstates school quality for this exact location.
- Market conditions: Rents soft (-1.5%/yr); 267 active listings in the ZIP; 40 comparable units currently listed for rent nearby; rentals leasing fast (median 6d on market — plan ~1-2 weeks tenant-placement turnaround); 2,676 units permitted in Pinellas County in 2024 (1,422 in 5+ unit buildings).
Forward outlook
- Local home prices are declining (-3.0%/yr); year-one equity from $2k of loan paydown is wiped out by about $7k of value loss. Plan a longer hold.
- Pinellas County population projected at +14% by 2050 — modest demand growth; plan on rents tracking national, not racing it.
Negotiation context
- It's been on market 26 days — a 2% lower offer ($235k) is reasonable based on typical stale-listing flexibility.
- 3 sale attempts with the ask held roughly flat each time — persistent listings suggest the price (not the market) is what's stuck; bring a comps-based counter.
- Current owner paid $170k; 41% above their basis — modest negotiation headroom, anchor on the comps not their cost.
Risks & watch-outs
- Watch-outs: built in 1952 — expect roof / HVAC / electrical / plumbing capex.
- Climate carrying-cost: severe wind risk, 99% chance of damaging wind over 30y; extreme-heat days projected 7→26/yr by 2055 (HVAC capex compounding) — expect insurance premiums to compound above CPI over the hold.
Questions for the listing agent
- Built in 1952 — when were the roof, HVAC, electrical panel, plumbing, and water heater last replaced?
- Is there a deadline driving the sale (1031 exchange, divorce, estate, relocation)? That informs how much negotiation room exists.
- What's the average days-on-market for RENTAL listings here right now (not sales)? A rising rental-DOM trend means longer vacancies and softer asking-rent achievability than the comps imply.
- What's the recent tenant-quality profile in this submarket — average credit score on applications, eviction rate, late-payment / NSF rate, and stable-employment percentage? A property-management company in the area should have these aggregated.
- How much new for-sale + rental construction is in the pipeline within 1–3 miles? Heavy new supply typically softens prices + rents 12–24 months out; constrained supply supports both.
Investment metrics
- 1% rule
- 0.91% ✗
- Cap rate
- 6.85%
- Cash-on-cash
- 1.99%
- DSCR
- 1.09
- GRM
- 9.1
CMA / ARV
- ARV (on-the-fly)
- $359,795
- Comps found
- 12
Show comp detail 12 sales within ~0.75 mi
| Address | Dist | Beds/Ba | Sqft | Sold | Price | $/sf | Match |
|---|---|---|---|---|---|---|---|
| 4400 3rd Ave S | 0.00mi | 2/1.0 | 1,135 (0%) | 1mo | $221,900 | $196 | 99 |
| 4650 2nd Ave S | 0.23mi | 2/1.5 | 1,146 (+1%) | 1mo | $365,000 | $318 | 85 |
| 4221 1st Ave N | 0.32mi | 2/1.0 | 1,176 (+4%) | 2mo | $477,000 | $406 | 78 |
| 4801 Emerson Ave S | 0.36mi | 2/2.0 | 1,044 (-8%) | 1mo | $315,000 | $302 | 65 |
| 5001 3rd Ave S | 0.50mi | 2/1.0 | 1,263 (+11%) | 0mo | $400,000 | $317 | 58 |
| 4545 Burlington Ave N | 0.43mi | 3/2.0 (+1) | 1,212 (+7%) | 2mo | $475,000 | $392 | 58 |
| 4424 1st Ave N | 0.24mi | 3/2.0 (+1) | 1,283 (+13%) | 0mo | $310,000 | $242 | 58 |
| 4510 Burlington Ave N | 0.39mi | 2/1.0 | 1,290 (+14%) | 3mo | $385,000 | $298 | 57 |
| 4251 4th Ave N | 0.55mi | 3/2.0 (+1) | 1,190 (+5%) | 1mo | $530,000 | $445 | 56 |
| 4659 9th Ave S | 0.53mi | 3/2.0 (+1) | 1,060 (-7%) | 3mo | $295,000 | $278 | 53 |
| 4127 12th Ave S | 0.70mi | 3/1.0 (+1) | 1,032 (-9%) | 0mo | $300,000 | $291 | 47 |
| 3835 4th Ave N | 0.71mi | 3/2.0 (+1) | 1,246 (+10%) | 2mo | $479,000 | $384 | 40 |
Match score weights: distance 35% · size 25% · config 20% · recency 20%. Top-matched comps best support the ARV.
Projected returns pro-forma
-3.0% appreciation · 0.0% rent growth · sell at horizon
- IRR
- -16.5%
- Equity multiple
- 0.43×
- Total profit
- $-38,043
- Equity at exit
- $35,636
- IRR
- -14.7%
- Equity multiple
- 0.27×
- Total profit
- $-48,686
- Equity at exit
- $20,664
Cash invested: $66,920 (down + closing). Projections, not guarantees.
Landlord ↔ Tenant lean methodology
- Overall (STATE)
- 87 Strongly Landlord-Friendly
- State Florida
- 87 Strongly Landlord-Friendly · R+3
- County
- — inherits STATE
- City
- — inherits STATE
ZIP-level market 33711
- Rents YoY
- -1.5%
- Active inventory
- 267
- Price-to-rent
- 9.1×
Monthly cashflow live
- Estimated rent
- $2,180 high interval (Pro) →
- Mortgage (P&I)
- −$1,253
- Tax from tax record
- −$258 /mo · $3,098/yr
- Insurance
- −$100
- HOA
- −$0
- Vacancy / Maint / Mgmt
- −$458
- Net cashflow
- $111
Break-even live
Sensitivity live
| Price | -10% $246 | -5% $179 | +0% $111 | +5% $43 | +10% $-24 |
|---|---|---|---|---|---|
| Rent | -10% $-61 | -5% $25 | +0% $111 | +5% $197 | +10% $283 |
| Rate | -1.0pp $231 | -0.5pp $172 | base $111 | +0.5pp $49 | +1.0pp $-14 |
UW: 25.0% down · 7.5% · 30yr · 1.5% tax · 5.0% vac · 8.0% maint · 8.0% mgmt
Financing live
Cash to close
- Down payment
- $59,750
- Closing costs
- $7,170
- Reserves months
- —
- Total cash needed
- —
Loan-product check · same deal, 3 products live
Conventional
25% down · 7.5% · 30yr
- Down + closing
- —
- Monthly P&I
- —
- Monthly cashflow
- —
- DSCR
- —
- Eligible?
- —
Personal DTI + credit; lowest rate.
DSCR
20% down · 8.5% · 30yr
- Down + closing
- —
- Monthly P&I
- —
- Monthly cashflow
- —
- DSCR
- —
- Eligible?
- —
No personal income docs; deal must DSCR.
Hard money
10% down · 12.0% · 12mo
- Down + closing
- —
- Monthly P&I
- —
- Monthly cashflow
- —
- DSCR
- —
- Eligible?
- —
Short-term bridge; refi at stabilization.
Rent comps 40 comps
| Address | Beds | Baths | Sqft | Rent | $/sqft | DOM | Units | Dist |
|---|---|---|---|---|---|---|---|---|
| 505 43rd St S Unit 5051/2 St. Petersburg, FL | 2.0 | 1.0 | 800 | $2,000 | $2.50 | 26d | 1 | 0.15mi |
| 4541 6th Ave S Saint Petersburg, FL | 3.0 | 1.0 | 945 | $1,100 | $1.16 | 16d | 1 | 0.25mi |
| 450 47th St S Saint Petersburg, FL | 3.0 | 1.0 | 960 | $2,950 | $3.07 | 5d | 1 | 0.26mi |
| 4018 2nd Ave S Saint Petersburg, FL | 3.0 | 1.0 | 1176 | $2,095 | $1.78 | 5d | 1 | 0.31mi |
| 4711 Fairfield Ave S Saint Petersburg, FL | 3.0 | 2.0 | 1135 | $2,800 | $2.47 | 5d | 1 | 0.39mi |
| 404 Madison St S Saint Petersburg, FL | 3.0 | 1.0 | 1391 | $2,500 | $1.80 | 5d | 1 | 0.40mi |
| 3938 2nd Ave N Saint Petersburg, FL | 2.0 | 1.0 | 1000 | $2,495 | $2.50 | 5d | 1 | 0.49mi |
| 4948 5th Ave S Saint Petersburg, FL | 3.0 | 1.5 | 1379 | $2,450 | $1.78 | 5d | 1 | 0.50mi |
| 3801 1st Ave S Saint Petersburg, FL | 2.0 | 1.0 | 900 | $1,975 | $2.19 | 19d | 1 | 0.51mi |
| 5034 2nd Ave S Unit A St. Petersburg, FL | 2.0 | 1.0 | 1062 | $1,950 | $1.84 | 6d | 1 | 0.55mi |
| 3815 1st Ave N Unit A St. Petersburg, FL | 2.0 | 1.5 | 700 | $1,895 | $2.71 | 0d | 1 | 0.56mi |
| 3815 1st Ave N Unit A St. Petersburg, FL | 2.0 | 1.5 | 1100 | $1,950 | $1.77 | 26d | 1 | 0.56mi |
| 3815 1st Ave N Unit A St. Petersburg, FL | 2.0 | 1.5 | 700 | $1,895 | $2.71 | 12d | 1 | 0.56mi |
| 5055 3rd Ave S Saint Petersburg, FL | 3.0 | 2.0 | 1254 | $2,100 | $1.67 | 5d | 1 | 0.57mi |
| 3823 2nd Ave N Saint Petersburg, FL | 2.0 | 1.0 | 944 | $2,300 | $2.44 | 5d | 1 | 0.58mi |
| 3844 Burlington Ave N Saint Petersburg, FL | 2.0 | 1.0 | 828 | $1,895 | $2.29 | 21d | 1 | 0.59mi |
| 4421 11th Ave S Saint Petersburg, FL | 3.0 | 2.0 | 945 | $2,000 | $2.12 | 6d | 1 | 0.60mi |
| 4700 10th Ave S Saint Petersburg, FL | 3.0 | 2.0 | 1300 | $2,500 | $1.92 | 22d | 1 | 0.62mi |
| 4801 10th Ave S Unit 1 St. Petersburg, FL | 3.0 | 1.0 | 1100 | $2,200 | $2.00 | 26d | 1 | 0.63mi |
| 5050 2nd Ave N Saint Petersburg, FL | 2.0 | 1.0 | 816 | $1,495 | $1.83 | 5d | 1 | 0.64mi |
| 5156 5th Ave S Saint Petersburg, FL | 3.0 | 1.0 | 1139 | $1,995 | $1.75 | 26d | 1 | 0.65mi |
| 4227 5th Ave N Saint Petersburg, FL | 2.0 | 1.0 | 930 | $2,100 | $2.26 | 6d | 1 | 0.67mi |
| 4526 6th Ave N Saint Petersburg, FL | 2.0 | 1.0 | 888 | $1,950 | $2.20 | 6d | 1 | 0.69mi |
| 3550 2nd Ave S St. Petersburg, FL | 2.0 | 1.0 | 720 | $2,800 | $3.89 | 26d | 1 | 0.69mi |
| 800 51st St S Gulfport, FL | 3.0 | 2.0 | 1258 | $3,200 | $2.54 | 6d | 1 | 0.69mi |
| 3653 2nd Ave N Saint Petersburg, FL | 2.0 | 1.0 | 1024 | $2,500 | $2.44 | 26d | 1 | 0.69mi |
| 3720 3rd Ave N Unit 1/2 St. Petersburg, FL | 3.0 | 3.0 | 1392 | $3,000 | $2.16 | 26d | 1 | 0.71mi |
| 3750 4th Ave N Saint Petersburg, FL | 2.0 | 1.0 | 881 | $2,100 | $2.38 | 26d | 1 | 0.72mi |
| 250 37th St N Saint Petersburg, FL | 2.0 | 1.0 | 826 | $1,798 | $2.18 | 5d | 1 | 0.72mi |
| 250 37th St N Saint Petersburg, FL | 2.0 | 1.0 | 826 | $1,813 | $2.19 | 9d | 1 | 0.72mi |
| 201 35th St S Saint Petersburg, FL | 2.0 | 1.0 | 850 | $1,680 | $1.98 | 3d | 1 | 0.74mi |
| 3901 5th Ave N Unit 3901 5th D St. Petersburg, FL | 2.0 | 1.0 | 825 | $1,595 | $1.93 | 9d | 1 | 0.76mi |
| 600 40th St N Saint Petersburg, FL | 1.0–3.0 | 1.0–2.5 | 1187 | $1,598 | $1.35 | 6d | 12 | 0.76mi |
| 4029 13th Ave S St Petersburg, FL | 3.0 | 2.0 | 1152 | $2,650 | $2.30 | 26d | 1 | 0.77mi |
| 1327 43rd St S Saint Petersburg, FL | 3.0 | 1.5 | 959 | $2,250 | $2.35 | 6d | 1 | 0.78mi |
| 3421 4th Ave S Saint Petersburg, FL | 2.0 | 1.5 | 938 | $1,805 | $1.92 | 5d | 1 | 0.79mi |
| 4938 12th Ave S Gulfport, FL | 3.0 | 2.0 | 990 | $1,795 | $1.81 | 0d | 1 | 0.83mi |
| 4933 13th Ave S Gulfport, FL | 2.0 | 1.0 | 939 | $2,200 | $2.34 | 22d | 1 | 0.84mi |
| 630 50th St N Saint Petersburg, FL | 2.0 | 1.0 | 1085 | $2,070 | $1.91 | 26d | 1 | 0.89mi |
| 3435 3rd Ave N Saint Petersburg, FL | 1.0–2.0 | 1.0 | 772 | $1,795 | $2.32 | 3d | 4 | 0.91mi |
Listing history 9 events
-
2026-05-15status Pending
-
2026-05-07price $239,000
-
2026-04-29status Active
-
2026-04-25status Pending
-
2026-04-22status Active
-
2026-04-17status Pending
-
2026-04-10$249,000 Active
-
2026-04-10soldstatus $170,000
-
1983-09-01soldstatus $35,000
ⓘ Source: listings_history table (triggers on properties + properties_extension) + one-shot
backfill from property_details.listing_events for pre-trigger history.
Tax reassessment forecast FL · Resets to sale price
- Current annual tax
- $3,098 · $258/mo
- Projected year-2 tax
- $3,098 · $258/mo
- Expected delta
- $0/yr ($0/mo · 0.0%)
ⓘ Screening estimate from a state-policy table — verify with the county assessor before closing.
Climate risk First Street
- Flood 1/10 Low FEMA zone X (unshaded) · 0% chance over 30 yrs
- Wildfire 1/10 Low
- Heat 10/10 Extreme 7 d/yr ≥106°F today · 26 d/yr by 30 yrs out
- Wind 10/10 Extreme 99% chance of damaging wind over 30 yrs
- Air quality 4/10 Moderate 4 unhealthy d/yr today · 4 by 30 yrs out
Nearby sold comps map
Loading sold comps map…
Walkable amenities ~0.75 mi
Loading nearby amenities…
Taxation est. · year 1
- Rental income
- $26,158
- − Mortgage interest
- −$13,388
- − Property taxes
- −$3,098
- − Insurance
- −$1,195
- − Repairs & maintenance
- −$2,093
- − Management
- −$2,093
- − Depreciation
- −$6,953
- Taxable loss
- −$2,661
- Est. tax savings @ 24.0%
- +$639
- After-tax cash flow
- $1,970/yr
For passive investors: Depreciation is non-cash, so a rental often shows a tax loss while cash-flowing — sheltering income. Rental losses are passive: they offset passive income freely, and up to $25,000/yr can offset ordinary (W-2) income if you actively participate and your MAGI is under $100k (phasing out to $0 by $150k); unused losses carry forward. On sale, claimed depreciation is recaptured at up to 25%, and gains may owe capital-gains tax (a 1031 exchange can defer both). Figures are a year-1 estimate at your 24.0% rate — not tax advice; consult a CPA.
Schools (NCES district)
- District
- Pinellas
- NCES district ID
- 1201560
- Math proficiency
- 51% ▼ -5.00%
- Reading proficiency
- 51% ▼ -3.00%
- Median HH income
- $46,270
- Composite
- 43.27/100
- National rank
- #3046
- State rank
- #31 of 73 in FL
Livability — St. Petersburg
No livability data for this city. (Only ~50 U.S. cities are tracked.)
Census & demographics
- Census place
- St. Petersburg, FL
- County
- Pinellas County · 939,478 people
- City population
- 249,151
- Metro
- Tampa-St. Petersburg-Clearwater, FL
- Population (ZIP)
- 20,013
- Household income
- $66,540
- Rent vs Own
- Severe rent burden
- 903.0
Population outlook (Pinellas County) Hauer SSP2
- Today (2025)
- 1,027,532 people
- By 2030
- 1,063,586 · +3.5%
- By 2040
- 1,125,020 · +9.5%
- By 2050
- 1,168,637 · +13.7%
- By 2075
- 1,265,188 · +23.1%
- By 2100
- 1,260,357 · +22.7%
Race, ethnicity, and origin ACS 2023
- Neighborhood character
- Diverse neighborhood (Simpson 0.59)
- Race & ethnicity
- White 45% Black 45% Hispanic / Latino 6% Two or more races 6%
- Hispanic origin (detail)
- Puerto Rican 1%
- Common ancestry
- Romanian 2% Lithuanian 2% Italian 1%
- Foreign-born
- 7% · Canada, Dominican Republic
- Languages at home
- 91% English-only · Spanish 4% French/Haitian/Cajun 3% Other Indo-European 1%
Political lean MEDSL · Pinellas
- 2024 margin
- Lean R (+5.2) · D 46.9% · R 52.1%
- 2008→2024 swing
- -13.5pp toward R · 2008: 8.3pp · 2024: -5.2pp
- All cycles
- 2024: R+5.2 2020: D+0.2 2016: R+1.1 2012: D+5.6 2008: D+8.3
Not yet ingested
- Civics
- —
Market trends
- HPI YoY
- ▼ -313.54%
- Current HPI
- 338.2712
- Rent YoY
- ▼ -1.47%
- Metro
- Tampa-St. Petersburg-Clearwater, FL
- State GDP YoY
- ▲ 3.28%
- F500 in state
- 36
Industry mix (Fortune 500 HQ in FL)
| Industry | F500 HQs | Revenue |
|---|---|---|
| Industrial Technology | 2 | $29B |
|
||
| Insurance | 2 | $17B |
|
||
| Retail | 1 | $60B |
|
||
| Technology Distribution | 1 | $58B |
|
||
| Homebuilding | 1 | $35B |
|
||
| Technology Manufacturing | 1 | $35B |
|
||
Price history
+582.9% since first listed9 events — show timeline
- 2026-05-15 Pending — Stellar MLS as Distributed by MLS Grid
- 2026-05-07 Price Changed $239,000 Stellar MLS as Distributed by MLS Grid
- 2026-04-29 Relisted — Stellar MLS as Distributed by MLS Grid
- 2026-04-25 Pending — Stellar MLS as Distributed by MLS Grid
- 2026-04-22 Relisted — Stellar MLS as Distributed by MLS Grid
- 2026-04-17 Pending — Stellar MLS as Distributed by MLS Grid
- 2026-04-10 Sold (Public Records) $170,000 Public Records
- 2026-04-10 Listed $249,000 Stellar MLS as Distributed by MLS Grid
- 1983-09-01 Sold (Public Records) $35,000 Public Records
Property tax history
+12.3%/yrLatest (2025): $3,098 · +12.8% YoY. Source: county tax records.
Cash-flow waterfall
monthlySold comps — $/sqft
last 12 mo · ≤1 miLoading sold comps…