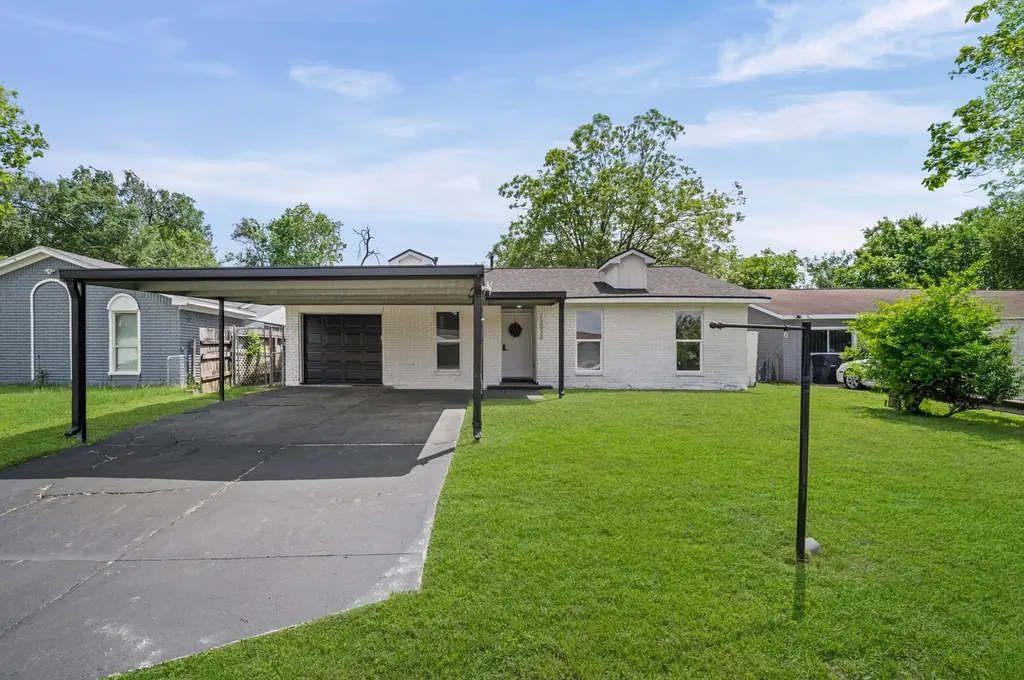
12939 Segrest Dr · Houston, TX
Flood risk 1/10 · Minimal
- FEMA flood zone
- X (unshaded)
- Chance of flooding over 30 yrs
- 0.0%
- Est. flood insurance / yr
- $507 – $1,088
Fire risk 2/10 · Minimal
- Est. fire insurance / yr
- $1,222 – $2,270
Heat risk 9/10 · Severe
- Hot days now (above 109°F)
- 6 days/yr
- Hot days in 30 yrs
- 21 days/yr
Wind risk 9/10 · Severe
- Chance of severe wind over 30 yrs
- 99.0%
Air-quality risk 2/10 · Minimal
- Unhealthy air days now
- 2 days/yr
- Unhealthy air days in 30 yrs
- 2 days/yr
Risk factors via First Street. Map © Google.
Why this score? — see what drove the C+ grade
The composite is a weighted blend of 9 inputs, each scored 0–100. Each bar is that input's sub-score; the figure is the points it added to the 100-point composite (weight × sub-score).
- Cash flow +24.3/30.0
- ARV discount +15.0/15.0
- DSCR +7.9/10.0
- 1% rule +6.5/10.0
- Livability +3.7/5.0
- Schools +2.7/10.0
- Condition / age +2.5/5.0
- Rent growth +2.4/5.0
- Appreciation +0.0/10.0
$205,000
🖨 Deal sheet (PDF) 📄 Offer letter ✓ Due diligence
Listing remarks MLS
3 BEDROOM 1.5 BATH HOME WITH LARGE DEN, FRONT YARD, AND 2 CAR CARPORT. REPAIRS ARE NEEDED. CALL TODAY
Key facts
- Large living area
- Spacious backyard
- Open kitchen
Tags
Property features AI
Exterior
- Parking: Attached garage (1 car); Attached carport (2 spaces)
- Utilities: Public water
- Home design: Residential property; Built in 1971; Slab foundation; Composition roof
- Construction: Construction materials: Unknown
- Exterior features: Subdivision lot
Interior
- Kitchen: Dishwasher
- Bedrooms: Primary bedroom on the first floor (18 x 14); Two additional bedrooms on the first floor (each 9 x 15); Total of 4 rooms
- Bathrooms: 2 full bathrooms
- Heating & cooling: Central heating (gas); Central air conditioning (gas)
- Interior features: Dishwasher
Neighborhood map
What this means for you Summary
Snapshot
- This is a 3-bed/1.5-bath single-family listed at $205k.
Deal economics
- At list price, monthly cash flow is $414 ($5k/yr) — positive.
- The deal already cash-flows at list — no discount required.
- Meets the 1% rule at list price ($2k rent vs $205k).
- Recommended offer: $199k (3.0% below list) — sets the bar for market timing.
- Cap rate 8.7% vs local median 3.2% in Houston — top-decile yield for the area; either an underpriced asset or a hidden risk that comps aren't pricing in. Stress-test before assuming the spread holds.
Location & tenants
- Location reads 74/100 on livability (#184 in TX, #4,771 nationally) — a middle-class / working-renter tenant base. Strengths: amenities A+, cost of living A+, housing A+; Watch: crime F.
- Houston ISD (urban): math 27% / reading 35% proficiency, ranked #593 of 826 in TX (top 72%) — families likely to look elsewhere, expect single-tenant / working-renter base with shorter leases; 71% free/reduced lunch — lower-income household profile, screen leases tightly.
- Zoned schools: Thomas Middle (math 3% / reading 13%, grade F, #1,654 of 1,662 statewide, top 100%, 526 students, 98% FRL); Worthing H S (math 22% / reading 21%, grade F, #1,377 of 1,632 statewide, top 85%, 827 students, 96% FRL) — zoned schools average 97% FRL vs 71% district-wide (26 pts higher); higher-poverty schools than district average — tighter screening recommended.
- Zoned-school proficiency averages 15% at this address vs 31% district-wide (-16 pts) — the specific schools serving this property underperform the Houston ISD average; the district grade overstates school quality for this exact location.
- Market conditions: Rents soft (-0.2%/yr); 284 active listings in the ZIP; 17 comparable units currently listed for rent nearby; rentals leasing fast (median 9d on market — plan ~1-2 weeks tenant-placement turnaround); solid renter incomes; 29,883 units permitted in Harris County in 2024 (8,621 in 5+ unit buildings).
- This rent runs 36% of the median local income ($79k/yr) — at the standard rent-burdened threshold; future hikes will face affordability resistance.
Forward outlook
- Local home prices are declining (-3.0%/yr); year-one equity from $1k of loan paydown is wiped out by about $6k of value loss. Plan a longer hold.
- Harris County population projected at +47% by 2050 — long-run rental-demand tailwind backs the buy-and-hold thesis.
Negotiation context
- It's been on market 32 days — a 3% lower offer ($199k) is reasonable based on typical stale-listing flexibility.
- 4 sale attempts with the ask held roughly flat each time — persistent listings suggest the price (not the market) is what's stuck; bring a comps-based counter.
Risks & watch-outs
- Climate carrying-cost: severe wind risk, 99% chance of damaging wind over 30y; extreme-heat days projected 6→21/yr by 2055 (HVAC capex compounding) — expect insurance premiums to compound above CPI over the hold.
Questions for the listing agent
- It's been on market 32 days. Have you received any prior offers? Is the seller open to a 3% concession, seller financing, or rate buy-down credit?
- Built in 1971 — when were the roof, HVAC, electrical panel, plumbing, and water heater last replaced?
- Is there a deadline driving the sale (1031 exchange, divorce, estate, relocation)? That informs how much negotiation room exists.
- Schools are D-rated, which usually means shorter tenancies and higher turnover. Who's the typical renter profile here, and what's been the actual vacancy rate?
- Crime grade is F in this area — have there been break-ins, vandalism, or insurance claims at this property in the last 3 years? What carrier currently insures it and at what premium?
- What's the average days-on-market for RENTAL listings here right now (not sales)? A rising rental-DOM trend means longer vacancies and softer asking-rent achievability than the comps imply.
- What's the recent tenant-quality profile in this submarket — average credit score on applications, eviction rate, late-payment / NSF rate, and stable-employment percentage? A property-management company in the area should have these aggregated.
- How much new for-sale + rental construction is in the pipeline within 1–3 miles? Heavy new supply typically softens prices + rents 12–24 months out; constrained supply supports both.
Investment metrics
- 1% rule
- 1.15% ✓
- Cap rate
- 8.72%
- Cash-on-cash
- 8.66%
- DSCR
- 1.39
- GRM
- 7.2
CMA / ARV
- ARV (on-the-fly)
- $287,591
- Comps found
- 12
Show comp detail 12 sales within ~0.75 mi
| Address | Dist | Beds/Ba | Sqft | Sold | Price | $/sf | Match |
|---|---|---|---|---|---|---|---|
| 12939 Segrest Dr | 0.00mi | 3/2.0 | 2,069 (0%) | 1mo | $205,000 | $99 | 97 |
| 3718 Kilkenny Dr | 0.24mi | 3/2.5 | 2,077 (+0%) | 6mo | $369,999 | $178 | 79 |
| 3714 Kilkenny Dr | 0.23mi | 3/2.5 | 2,077 (+0%) | 9mo | $375,000 | $181 | 77 |
| 3727 Kildare Dr | 0.23mi | 4/2.0 (+1) | 2,092 (+1%) | 7mo | $250,000 | $120 | 75 |
| 4302 Marchant Rd | 0.40mi | 3/2.0 | 2,014 (-3%) | 4mo | $255,000 | $127 | 71 |
| 4018 Marchant Rd | 0.33mi | 3/2.0 | 1,800 (-13%) | 3mo | $249,990 | $139 | 58 |
| 3710 Kilkenny Dr | 0.23mi | 3/2.5 | 1,786 (-14%) | 7mo | $339,999 | $190 | 57 |
| 12022 Leitrim Way | 0.58mi | 4/2.5 (+1) | 2,161 (+4%) | 18mo | $279,900 | $130 | 42 |
| 3012 Stock Orchard Ln | 0.74mi | 3/2.5 | 1,844 (-11%) | 7mo | $355,000 | $193 | 37 |
| 12819 Cape Hyannis Dr | 0.66mi | 4/2.0 (+1) | 1,783 (-14%) | 5mo | $149,950 | $84 | 35 |
| 3023 Maughan Heights Trl | 0.73mi | 4/2.5 (+1) | 2,297 (+11%) | 6mo | $345,000 | $150 | 33 |
| 12807 Cape Hyannis Dr | 0.67mi | 3/2.5 | 1,816 (-12%) | 14mo | $249,500 | $137 | 32 |
Match score weights: distance 35% · size 25% · config 20% · recency 20%. Top-matched comps best support the ARV.
Projected returns pro-forma
-3.0% appreciation · 0.0% rent growth · sell at horizon
- IRR
- -6.7%
- Equity multiple
- 0.76×
- Total profit
- $-13,701
- Equity at exit
- $30,566
- IRR
- -1.3%
- Equity multiple
- 0.92×
- Total profit
- $-4,448
- Equity at exit
- $17,725
Cash invested: $57,400 (down + closing). Projections, not guarantees.
Landlord ↔ Tenant lean methodology
- Overall (STATE)
- 87 Strongly Landlord-Friendly
- State Texas
- 87 Strongly Landlord-Friendly · R+5
- County
- — inherits STATE
- City
- — inherits STATE
ZIP-level market 77047
- Home prices YoY
- -10.1%
- Rents YoY
- -0.2%
- Active inventory
- 284
- Price-to-rent
- 7.2×
Monthly cashflow live
- Estimated rent
- $2,357 high interval (Pro) →
- Mortgage (P&I)
- −$1,075
- Tax from tax record
- −$288 /mo · $3,454/yr
- Insurance
- −$85
- HOA
- −$0
- Vacancy / Maint / Mgmt
- −$495
- Net cashflow
- $414
Break-even live
Sensitivity live
| Price | -10% $530 | -5% $472 | +0% $414 | +5% $356 | +10% $298 |
|---|---|---|---|---|---|
| Rent | -10% $228 | -5% $321 | +0% $414 | +5% $507 | +10% $600 |
| Rate | -1.0pp $517 | -0.5pp $466 | base $414 | +0.5pp $361 | +1.0pp $307 |
UW: 25.0% down · 7.5% · 30yr · 1.5% tax · 5.0% vac · 8.0% maint · 8.0% mgmt
Financing live
Cash to close
- Down payment
- $51,250
- Closing costs
- $6,150
- Reserves months
- —
- Total cash needed
- —
Loan-product check · same deal, 3 products live
Conventional
25% down · 7.5% · 30yr
- Down + closing
- —
- Monthly P&I
- —
- Monthly cashflow
- —
- DSCR
- —
- Eligible?
- —
Personal DTI + credit; lowest rate.
DSCR
20% down · 8.5% · 30yr
- Down + closing
- —
- Monthly P&I
- —
- Monthly cashflow
- —
- DSCR
- —
- Eligible?
- —
No personal income docs; deal must DSCR.
Hard money
10% down · 12.0% · 12mo
- Down + closing
- —
- Monthly P&I
- —
- Monthly cashflow
- —
- DSCR
- —
- Eligible?
- —
Short-term bridge; refi at stabilization.
Rent comps 17 comps
| Address | Beds | Baths | Sqft | Rent | $/sqft | DOM | Units | Dist |
|---|---|---|---|---|---|---|---|---|
| 12207 Duane Ct Houston, TX | 3.0 | 2.0 | 1548 | $1,646 | $1.06 | 0d | 1 | 0.69mi |
| 3020 Gunnersbury Dr Houston, TX | 4.0 | 2.0 | 1670 | $1,499 | $0.90 | 16d | 1 | 0.69mi |
| 12227 Cape Hyannis Dr Houston, TX | 3.0 | 2.0 | 1432 | $1,705 | $1.19 | 15d | 1 | 0.71mi |
| 3013 Maughan Heights Trl Houston, TX | 4.0 | 2.5 | 2386 | $5,000 | $2.10 | 0d | 1 | 0.76mi |
| 11819 Leitrim Way Houston, TX | 3.0 | 1.0 | 1476 | $1,150 | $0.78 | 6d | 1 | 0.78mi |
| 2920 Stamford Hill Ln Houston, TX | 3.0 | 2.0 | 1690 | $2,200 | $1.30 | 45d | 1 | 0.78mi |
| 12210 Roandale Dr Houston, TX | 3.0 | 2.0 | 1738 | $1,775 | $1.02 | 45d | 1 | 0.79mi |
| 4510 Bungalow Ln Houston, TX | 3.0 | 2.5 | 2100 | $1,995 | $0.95 | 45d | 1 | 0.87mi |
| 13851 Bonner Bluff Ln Houston, TX | 4.0 | 3.5 | 2980 | $2,130 | $0.71 | 45d | 1 | 0.90mi |
| 3002 Crown Gate Dr Unit 1568481P Houston, TX | 4.0 | 2.5 | 2195 | $3,345 | $1.52 | 0d | 1 | 0.93mi |
| 12320 Chesney Downs Dr Houston, TX | 4.0 | 2.5 | 2000 | $3,500 | $1.75 | 4d | 1 | 0.95mi |
| 3110 Kainer Meadows Ln Houston, TX | 3.0 | 2.0 | 1469 | $1,900 | $1.29 | 9d | 1 | 0.99mi |
| 13426 Sombrero Cay Dr Houston, TX | 4.0 | 3.0 | 2108 | $2,300 | $1.09 | 45d | 1 | 1.01mi |
| 2706 Skyview Downs Dr Houston, TX | 4.0 | 2.5 | 2464 | $2,200 | $0.89 | 3d | 1 | 1.04mi |
| 13802 Greyfield Ln Houston, TX | 4.0 | 2.5 | 2350 | $2,400 | $1.02 | 0d | 1 | 1.08mi |
| 4111 Oakview Creek Ln Houston, TX | 4.0 | 2.5 | 1885 | $2,150 | $1.14 | 45d | 1 | 1.26mi |
| 3403 Orchid Trace Ln Houston, TX | 3.0 | 2.5 | 1602 | $1,920 | $1.20 | 4d | 1 | 1.37mi |
Listing history 17 events
-
2026-05-19status Pending
-
2026-04-28historical Active Under Contract
-
2026-04-20price $205,000
-
2026-04-17$210,000 Active
-
2026-04-08historical
-
2026-04-03price $225,000
-
2026-03-27historical $2,200
-
2026-03-25price $233,975
-
2026-02-24$2,200
-
2026-02-09price $240,775
-
2026-02-04price $244,900
-
2026-01-17price $250,000
-
2025-12-20$255,000 Active
-
2025-08-27soldstatus Closed 101-char remark
Show marketing remark (101 chars)
3 BEDROOM 1.5 BATH HOME WITH LARGE DEN, FRONT YARD, AND 2 CAR CARPORT. REPAIRS ARE NEEDED. CALL TODAY
-
2025-08-13status Pending 101-char remark
Show marketing remark (101 chars)
3 BEDROOM 1.5 BATH HOME WITH LARGE DEN, FRONT YARD, AND 2 CAR CARPORT. REPAIRS ARE NEEDED. CALL TODAY
-
2025-07-17$100,000 Active 101-char remark
Show marketing remark (101 chars)
3 BEDROOM 1.5 BATH HOME WITH LARGE DEN, FRONT YARD, AND 2 CAR CARPORT. REPAIRS ARE NEEDED. CALL TODAY
-
1988-01-02soldstatus
ⓘ Source: listings_history table (triggers on properties + properties_extension) + one-shot
backfill from property_details.listing_events for pre-trigger history.
Tax reassessment forecast TX · Resets to sale price
- Current annual tax
- $3,454 · $288/mo
- Projected year-2 tax
- $3,752 · $313/mo
- Expected delta
- +$298/yr (+$25/mo · 8.6%)
ⓘ Screening estimate from a state-policy table — verify with the county assessor before closing.
Climate risk First Street
- Flood 1/10 Low FEMA zone X (unshaded) · 0% chance over 30 yrs
- Wildfire 2/10 Low
- Heat 9/10 Extreme 6 d/yr ≥109°F today · 21 d/yr by 30 yrs out
- Wind 9/10 Extreme 99% chance of damaging wind over 30 yrs
- Air quality 2/10 Low 2 unhealthy d/yr today · 2 by 30 yrs out
Nearby sold comps map
Loading sold comps map…
Walkable amenities ~0.75 mi
Loading nearby amenities…
Taxation est. · year 1
- Rental income
- $28,289
- − Mortgage interest
- −$11,483
- − Property taxes
- −$3,454
- − Insurance
- −$1,025
- − Repairs & maintenance
- −$2,263
- − Management
- −$2,263
- − Depreciation
- −$5,964
- Taxable income
- $1,837
- Est. tax owed @ 24.0%
- −$441
- After-tax cash flow
- $4,528/yr
For passive investors: Depreciation is non-cash, so a rental often shows a tax loss while cash-flowing — sheltering income. Rental losses are passive: they offset passive income freely, and up to $25,000/yr can offset ordinary (W-2) income if you actively participate and your MAGI is under $100k (phasing out to $0 by $150k); unused losses carry forward. On sale, claimed depreciation is recaptured at up to 25%, and gains may owe capital-gains tax (a 1031 exchange can defer both). Figures are a year-1 estimate at your 24.0% rate — not tax advice; consult a CPA.
Schools (NCES district)
- District
- Houston ISD
- NCES district ID
- 4823640
- Math proficiency
- 27% ▼ -18.00%
- Reading proficiency
- 35% ▼ -6.00%
- Median HH income
- $46,054
- Composite
- 26.63/100
- National rank
- #7173
- State rank
- #593 of 826 in TX
Livability — Houston
- Score
- 74/100
- State rank
- #184
- US rank
- #4771
Category grades
Schools grade is shown separately in the Schools card above.
Census & demographics
- Census place
- Houston, TX
- County
- Harris County · 4,702,590 people
- City population
- 3,226,434
- Metro
- Houston-The Woodlands-Sugar Land, TX
- Population (ZIP)
- 34,987
- Household income
- $78,538
- Rent vs Own
- Severe rent burden
- 1109.0
Population outlook (Harris County) Hauer SSP2
- Today (2025)
- 5,571,493 people
- By 2030
- 6,089,821 · +9.3%
- By 2040
- 7,142,806 · +28.2%
- By 2050
- 8,185,864 · +46.9%
- By 2075
- 10,574,329 · +89.8%
- By 2100
- 12,109,958 · +117.4%
Race, ethnicity, and origin ACS 2023
- Neighborhood character
- Diverse neighborhood (Simpson 0.58)
- Race & ethnicity
- Black 57% Hispanic / Latino 29% Two or more races 15% White 6% Asian 3% Pacific Islander 1%
- Hispanic origin (detail)
- Mexican 24% Puerto Rican 1%
- Common ancestry
- Lithuanian 1%
- Foreign-born
- 15% · Canada, Vietnam
- Languages at home
- 70% English-only · Spanish 23% Vietnamese 1% Other Indo-European 1%
Political lean MEDSL · Harris
- 2024 margin
- Lean D (+5.5) · D 52.0% · R 46.4% · Other 1.6%
- 2008→2024 swing
- +3.9pp toward D · 2008: 1.6pp · 2024: 5.5pp
- All cycles
- 2024: D+5.5 2020: D+13.3 2016: D+12.4 2012: D+0.1 2008: D+1.6
Not yet ingested
- Civics
- —
Market trends
- HPI YoY
- ▼ -26.76%
- Current HPI
- 239.2287
- Rent YoY
- ▼ -0.21%
- Metro
- Houston-The Woodlands-Sugar Land, TX
- State GDP YoY
- ▲ 3.95%
- F500 in state
- 110
Industry mix (Fortune 500 HQ in TX)
| Industry | F500 HQs | Revenue |
|---|---|---|
| Energy | 16 | $1,198B |
|
||
| Technology | 5 | $198B |
|
||
| Engineering / Construction | 4 | $72B |
|
||
| Energy Services | 3 | $60B |
|
||
| Utilities | 3 | $41B |
|
||
| Healthcare | 2 | $330B |
|
||
Price history
+105.0% since first listed17 events — show timeline
- 2026-05-19 Pending — HARMLS
- 2026-04-28 Contingent — HARMLS
- 2026-04-20 Price Changed $205,000 HARMLS
- 2026-04-17 Listed $210,000 HARMLS
- 2026-04-08 Listing Removed — HARMLS
- 2026-04-03 Price Changed $225,000 HARMLS
- 2026-03-27 Rental Removed $2,200 Avail
- 2026-03-25 Price Changed $233,975 HARMLS
- 2026-02-24 Listed for Rent $2,200 Avail
- 2026-02-09 Price Changed $240,775 HARMLS
- 2026-02-04 Price Changed $244,900 HARMLS
- 2026-01-17 Price Changed $250,000 HARMLS
- 2025-12-20 Listed $255,000 HARMLS
- 2025-08-27 Sold (MLS) — HARMLS
- 2025-08-13 Pending — HARMLS
- 2025-07-17 Listed $100,000 HARMLS
- 1988-01-02 Sold (Public Records) — Public Records
Property tax history
+2.7%/yrLatest (2025): $3,454 · +11.6% YoY. Source: county tax records.
Cash-flow waterfall
monthlySold comps — $/sqft
last 12 mo · ≤1 miLoading sold comps…