 9-Plex
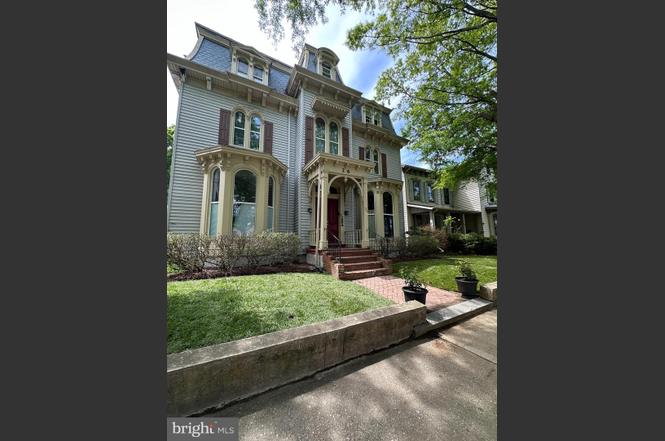
26 S State St · Dover, DE
Flood risk No data
- FEMA flood zone
- —
- Chance of flooding over 30 yrs
- —
- Est. flood insurance / yr
- —
Fire risk No data
- Est. fire insurance / yr
- —
Heat risk No data
- Hot days now (above threshold)
- —
- Hot days in 30 yrs
- —
Wind risk No data
- Chance of severe wind over 30 yrs
- —
Air-quality risk No data
- Unhealthy air days now
- —
- Unhealthy air days in 30 yrs
- —
Risk factors via First Street. Map © Google.
Why this score? — see what drove the B- grade
The composite is a weighted blend of 9 inputs, each scored 0–100. Each bar is that input's sub-score; the figure is the points it added to the 100-point composite (weight × sub-score).
- Cash flow +30.0/30.0
- DSCR +10.0/10.0
- 1% rule +8.0/10.0
- ARV discount +7.5/15.0
- Livability +3.4/5.0
- Rent growth +3.0/5.0
- Condition / age +2.5/5.0
- Schools +2.0/10.0
- Appreciation +0.0/10.0
$1,200,000
🖨 Deal sheet (PDF) 📄 Offer letter ✓ Due diligence
Multi-family units
County records classify this as Multi-Family (5+ Unit). Listing-text estimate: 9 units. confirmed
5+ unit building — per-unit beds/baths from public records are typically unavailable; the breakdown below (if shown) is an estimate from the listing text.
Listing remarks MLS
Turnkey 9-unit multifamily investment in Dover, surrounded by historic character and ongoing area revitalization. Stabilized asset producing approximately $11,700 per month (4-1-26) in rental income, plus additional income from on-site central washer and dryer facilities. Tenants pay their own gas heat and electric. Owner pays water, sewer, trash, and central hot water. Property has seen numerous recent improvements including updated windows, interior upgrades, select new kitchens, and recently installed flooring in most units. Hallways have been refreshed with new flooring and paint. Capital improvements include a new fire escape and some newer heating systems. Strong in-place income with additional ancillary revenue and continued upside through future unit improvements and long-term rental demand in the Dover market. Ideal for investors seeking a stabilized asset with proven cash flow.
Key facts
- 7,492 sq ft lot
- Built 1900
- Listed 81 days
Neighborhood map
What this means for you Summary
Snapshot
- This is a 9 × 2-bed/1-bath units multifamily listed at $1.20M.
Deal economics
- At list price, monthly cash flow is $5k ($62k/yr) — positive. Per door: $571/mo.
- The deal already cash-flows at list — no discount required.
- Meets the 1% rule at list price ($16k rent vs $1.20M).
- Recommended offer: $1.13M (6.0% below list) — sets the bar for market timing.
- Cap rate 11.4% vs local median 5.2% in Dover — top-decile yield for the area; either an underpriced asset or a hidden risk that comps aren't pricing in. Stress-test before assuming the spread holds.
Location & tenants
- Location reads 67/100 on livability (#38 in DE) — a middle-class / working-renter tenant base. Strengths: amenities A+, cost of living A+, housing A+; Watch: crime F, commute F, employment D-.
- Capital School District (urban): math 14% / reading 31% proficiency, ranked #24 of 26 in DE (top 92%) — low school quality limits family demand, transient renter base, plan for 1-2y turnover.
- Zoned schools: Booker T. Washington Elementary School (math 27% / reading 42%, grade F, #34 of 105 statewide, top 37%, 334 students, 0% FRL); Central Middle School (math 12% / reading 31%, grade F, #27 of 36 statewide, top 77%, 860 students, 0% FRL); Dover High School (math 21% / reading 45%, grade F, #22 of 40 statewide, top 56%, 1,771 students, 0% FRL) — zoned schools average 0% FRL vs 56% district-wide (56 pts lower); this property's tenant base skews higher-income than the district average.
- Market conditions: Rents rising (+2.0%/yr); 190 active listings in the ZIP; 1,201 units permitted in Kent County in 2024 (116 in 5+ unit buildings).
- At $15,602/mo this rent would consume 282% of the median local household income ($66k/yr) (locally 1320% of renters already pay >50% of income on rent) — very limited rent-growth headroom before tenants either downsize or default.
Forward outlook
- Local home prices are declining (-3.0%/yr); year-one equity from $8k of loan paydown is wiped out by about $36k of value loss. Plan a longer hold.
- Kent County population projected at +22% by 2050 — long-run rental-demand tailwind backs the buy-and-hold thesis.
- At projected returns (-3.0% appreciation + 2.0% rent growth), your $336k cash investment doubles in ~8 years — after that, you're playing with house money.
Negotiation context
- It's been on market 81 days — a 6% lower offer ($1.13M) is reasonable based on typical stale-listing flexibility.
- Current owner paid $900k; 33% above their basis — modest negotiation headroom, anchor on the comps not their cost.
Risks & watch-outs
- Watch-outs: built in 1900 — expect roof / HVAC / electrical / plumbing capex.
Questions for the listing agent
- It's been on market 81 days. Have you received any prior offers? Is the seller open to a 6% concession, seller financing, or rate buy-down credit?
- Can we see the unit-by-unit rent roll, current vacancy, and any below-market leases? What's the average tenancy length?
- What capital expenditures (roof, boiler, parking lot, exteriors) have been made in the last 5 years, and what's planned in the next 2?
- Built in 1900 — when were the roof, HVAC, electrical panel, plumbing, and water heater last replaced?
- Why hasn't it sold? Are there any deal-killer items the seller is aware of (foundation, flood, title, zoning, code violations)?
- Is there a deadline driving the sale (1031 exchange, divorce, estate, relocation)? That informs how much negotiation room exists.
- Crime grade is F in this area — have there been break-ins, vandalism, or insurance claims at this property in the last 3 years? What carrier currently insures it and at what premium?
- What's the average days-on-market for RENTAL listings here right now (not sales)? A rising rental-DOM trend means longer vacancies and softer asking-rent achievability than the comps imply.
- What's the recent tenant-quality profile in this submarket — average credit score on applications, eviction rate, late-payment / NSF rate, and stable-employment percentage? A property-management company in the area should have these aggregated.
- How much new apartment / multifamily construction is in the pipeline within 1–3 miles? Heavy new supply (>2% of stock underway) typically softens rents 12–24 months out; light construction supports rent growth.
Investment metrics
- 1% rule
- 1.30% ✓
- Cap rate
- 11.43%
- Cash-on-cash
- 18.36%
- DSCR
- 1.82
- GRM
- 6.4
CMA / ARV
No comps found within radius.
Projected returns pro-forma
-3.0% appreciation · 2.03% rent growth · sell at horizon
- IRR
- 9.0%
- Equity multiple
- 1.35×
- Total profit
- $117,367
- Equity at exit
- $178,924
- IRR
- 17.4%
- Equity multiple
- 2.37×
- Total profit
- $461,212
- Equity at exit
- $103,754
Cash invested: $336,000 (down + closing). Projections, not guarantees.
Landlord ↔ Tenant lean methodology
- Overall (STATE)
- 70 Landlord-Friendly
- State Delaware
- 70 Landlord-Friendly · D+7
- County
- — inherits STATE
- City
- — inherits STATE
ZIP-level market 19901
- Rents YoY
- 2.0%
- Active inventory
- 190
- Price-to-rent
- 57.7×
Monthly cashflow live
- Estimated rent
- $15,602 medium interval (Pro) →
- Mortgage (P&I)
- −$6,293
- Tax from tax record
- −$393 /mo · $4,716/yr
- Insurance
- −$500
- HOA
- −$0
- Vacancy / Maint / Mgmt
- −$3,276
- Net cashflow
- $5,140
Break-even live
Sensitivity live
| Price | -10% $5,819 | -5% $5,479 | +0% $5,140 | +5% $4,800 | +10% $4,460 |
|---|---|---|---|---|---|
| Rent | -10% $3,907 | -5% $4,523 | +0% $5,140 | +5% $5,756 | +10% $6,372 |
| Rate | -1.0pp $5,744 | -0.5pp $5,445 | base $5,140 | +0.5pp $4,829 | +1.0pp $4,512 |
9-unit breakdown (identical units grouped — click to expand)
| Units | Beds | Baths | Est. rent |
|---|---|---|---|
| 9× units | 2 | 1 | $15,606 |
| #1 | 2 | 1 | $1,734 |
| #2 | 2 | 1 | $1,734 |
| #3 | 2 | 1 | $1,734 |
| #4 | 2 | 1 | $1,734 |
| #5 | 2 | 1 | $1,734 |
| #6 | 2 | 1 | $1,734 |
| #7 | 2 | 1 | $1,734 |
| #8 | 2 | 1 | $1,734 |
| #9 | 2 | 1 | $1,734 |
| Total (9 units) | $15,602 | ||
UW: 25.0% down · 7.5% · 30yr · 1.5% tax · 5.0% vac · 8.0% maint · 8.0% mgmt
Financing live
Cash to close
- Down payment
- $300,000
- Closing costs
- $36,000
- Reserves months
- —
- Total cash needed
- —
Loan-product check · same deal, 3 products live
Conventional
25% down · 7.5% · 30yr
- Down + closing
- —
- Monthly P&I
- —
- Monthly cashflow
- —
- DSCR
- —
- Eligible?
- —
Personal DTI + credit; lowest rate.
DSCR
20% down · 8.5% · 30yr
- Down + closing
- —
- Monthly P&I
- —
- Monthly cashflow
- —
- DSCR
- —
- Eligible?
- —
No personal income docs; deal must DSCR.
Hard money
10% down · 12.0% · 12mo
- Down + closing
- —
- Monthly P&I
- —
- Monthly cashflow
- —
- DSCR
- —
- Eligible?
- —
Short-term bridge; refi at stabilization.
Listing history 12 events
-
2026-06-22days on market $1,200,000 Active 81 DOM
-
2026-06-19days on market $1,200,000 Active 79 DOM
-
2026-06-18days on market $1,200,000 Active 78 DOM
-
2026-06-17days on market $1,200,000 Active 77 DOM
-
2026-06-16days on market $1,200,000 Active 76 DOM
-
2026-06-15status $1,200,000 Active 75 DOM
-
2026-03-13$1,200,000 Active 900-char remark
Show marketing remark (900 chars)
Turnkey 9-unit multifamily investment in Dover, surrounded by historic character and ongoing area revitalization. Stabilized asset producing approximately $11,700 per month (4-1-26) in rental income, plus additional income from on-site central washer and dryer facilities. Tenants pay their own gas heat and electric. Owner pays water, sewer, trash, and central hot water. Property has seen numerous recent improvements including updated windows, interior upgrades, select new kitchens, and recently installed flooring in most units. Hallways have been refreshed with new flooring and paint. Capital improvements include a new fire escape and some newer heating systems. Strong in-place income with additional ancillary revenue and continued upside through future unit improvements and long-term rental demand in the Dover market. Ideal for investors seeking a stabilized asset with proven cash flow.
-
2026-02-19historical $1,200,000 900-char remark
Show marketing remark (900 chars)
Turnkey 9-unit multifamily investment in Dover, surrounded by historic character and ongoing area revitalization. Stabilized asset producing approximately $11,700 per month (4-1-26) in rental income, plus additional income from on-site central washer and dryer facilities. Tenants pay their own gas heat and electric. Owner pays water, sewer, trash, and central hot water. Property has seen numerous recent improvements including updated windows, interior upgrades, select new kitchens, and recently installed flooring in most units. Hallways have been refreshed with new flooring and paint. Capital improvements include a new fire escape and some newer heating systems. Strong in-place income with additional ancillary revenue and continued upside through future unit improvements and long-term rental demand in the Dover market. Ideal for investors seeking a stabilized asset with proven cash flow.
-
2023-02-28soldstatus $900,000
-
2018-05-04soldstatus $910,000
-
2009-04-23soldstatus $50,050
-
2009-03-19soldstatus $4,066
ⓘ Source: listings_history table (triggers on properties + properties_extension) + one-shot
backfill from property_details.listing_events for pre-trigger history.
Tax reassessment forecast DE · Partial reset (capped growth)
- Current annual tax
- $4,716 · $393/mo
- Projected year-2 tax
- $5,838 · $487/mo
- Expected delta
- +$1,122/yr (+$93/mo · 23.8%)
ⓘ Screening estimate from a state-policy table — verify with the county assessor before closing.
Nearby sold comps map
Loading sold comps map…
Walkable amenities ~0.75 mi
Loading nearby amenities…
Taxation est. · year 1
- Rental income
- $187,224
- − Mortgage interest
- −$67,219
- − Property taxes
- −$4,716
- − Insurance
- −$6,000
- − Repairs & maintenance
- −$14,978
- − Management
- −$14,978
- − Depreciation
- −$34,909
- Taxable income
- $44,424
- Est. tax owed @ 24.0%
- −$10,662
- After-tax cash flow
- $51,014/yr
For passive investors: Depreciation is non-cash, so a rental often shows a tax loss while cash-flowing — sheltering income. Rental losses are passive: they offset passive income freely, and up to $25,000/yr can offset ordinary (W-2) income if you actively participate and your MAGI is under $100k (phasing out to $0 by $150k); unused losses carry forward. On sale, claimed depreciation is recaptured at up to 25%, and gains may owe capital-gains tax (a 1031 exchange can defer both). Figures are a year-1 estimate at your 24.0% rate — not tax advice; consult a CPA.
Schools (NCES district)
- District
- Capital School District
- NCES district ID
- 1000190
- Math proficiency
- 14% ▼ -17.00%
- Reading proficiency
- 31% ▼ -12.00%
- Median HH income
- $48,499
- Composite
- 19.78/100
- National rank
- #8703
- State rank
- #24 of 26 in DE
Livability — Dover
- Score
- 67/100
- State rank
- #38
- US rank
- #10574
Category grades
Schools grade is shown separately in the Schools card above.
Census & demographics
- Census place
- Dover, DE
- County
- Kent County · 82,184 people
- City population
- 76,581
- Metro
- Dover, DE
- Population (ZIP)
- 37,763
- Household income
- $66,388
- Rent vs Own
- Severe rent burden
- 1320.0
Population outlook (Kent County) Hauer SSP2
- Today (2025)
- 194,477 people
- By 2030
- 204,351 · +5.1%
- By 2040
- 222,135 · +14.2%
- By 2050
- 236,483 · +21.6%
- By 2075
- 266,327 · +36.9%
- By 2100
- 275,335 · +41.6%
Race, ethnicity, and origin ACS 2023
- Neighborhood character
- Diverse neighborhood (Simpson 0.68)
- Race & ethnicity
- White 44% Black 34% Hispanic / Latino 13% Two or more races 11% Asian 2%
- Hispanic origin (detail)
- Mexican 3% Puerto Rican 6%
- Common ancestry
- Romanian 2% Hispanic 1% Lithuanian 1%
- Foreign-born
- 7% · Canada, South Korea
- Languages at home
- 88% English-only · Spanish 7% French/Haitian/Cajun 1% Other Asian/Pacific 1%
Political lean MEDSL · Kent
- 2024 margin
- Toss-up / Even · D 50.2% · R 48.2% · Other 1.7%
- 2008→2024 swing
- -7.8pp toward R · 2008: 9.8pp · 2024: 2.0pp
- All cycles
- 2024: D+2.0 2020: D+4.1 2016: R+4.9 2012: D+4.9 2008: D+9.8
Not yet ingested
- Civics
- —
Market trends
- HPI YoY
- ▼ -113.29%
- Current HPI
- 199.5132
- Rent YoY
- ▲ 2.03%
- Metro
- Dover, DE
- State GDP YoY
- —
- F500 in state
- 0
Price history
+29413.0% since first listed6 events — show timeline
- 2026-03-13 Listed $1,200,000 BRIGHT MLS
- 2026-02-19 Coming Soon $1,200,000 BRIGHT MLS
- 2023-02-28 Sold (Public Records) $900,000 Public Records
- 2018-05-04 Sold (Public Records) $910,000 Public Records
- 2009-04-23 Sold (Public Records) $50,050 Public Records
- 2009-03-19 Sold (Public Records) $4,066 Public Records
Property tax history
+9.5%/yrLatest (2025): $4,716 · +3.5% YoY. Source: county tax records.
Cash-flow waterfall
monthlySold comps — $/sqft
last 12 mo · ≤1 miLoading sold comps…