 🏗️ New Construction
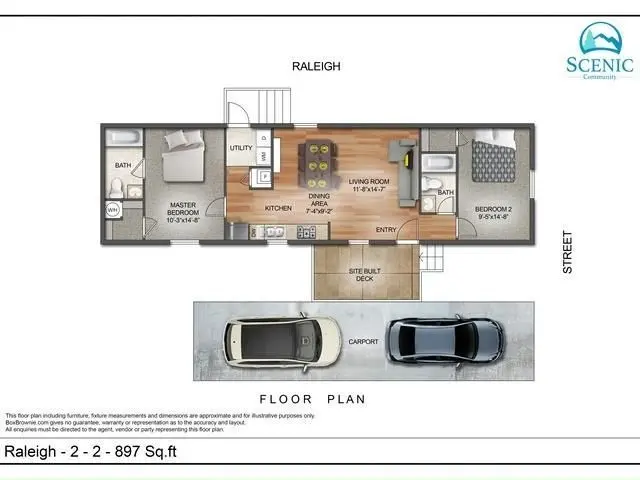
Raleigh Plan · Asheville, NC
Flood risk 1/10 · Minimal
- FEMA flood zone
- X (unshaded)
- Chance of flooding over 30 yrs
- 0.0%
- Est. flood insurance / yr
- $473 – $860
Fire risk 3/10 · Minor
- Est. fire insurance / yr
- $906 – $1,684
Heat risk 4/10 · Minor
- Hot days now (above 93°F)
- 9 days/yr
- Hot days in 30 yrs
- 24 days/yr
Wind risk 2/10 · Minimal
- Chance of severe wind over 30 yrs
- —
Air-quality risk 3/10 · Minor
- Unhealthy air days now
- 3 days/yr
- Unhealthy air days in 30 yrs
- 4 days/yr
Risk factors via First Street. Map © Google.
Why this score? — see what drove the B grade
The composite is a weighted blend of 9 inputs, each scored 0–100. Each bar is that input's sub-score; the figure is the points it added to the 100-point composite (weight × sub-score).
- Cash flow +30.0/30.0
- 1% rule +10.0/10.0
- DSCR +10.0/10.0
- ARV discount +7.5/15.0
- Schools +4.0/10.0
- Condition / age +3.8/5.0
- Rent growth +3.6/5.0
- Livability +3.6/5.0
- Appreciation +0.0/10.0
$95,900
🖨 Deal sheet 📄 Offer letter ✓ Due diligence
Key facts
- Listed 953 days
Neighborhood map
What this means for you Summary
Snapshot
- This is a 2-bed/2.0-bath manufactured listed at $96k. Condition is rated good.
Deal economics
- At list price, monthly cash flow is $565 ($7k/yr) — positive.
- The deal already cash-flows at list — no discount required.
- Meets the 1% rule at list price ($2k rent vs $96k).
- Recommended offer: $84k (12.0% below list) — sets the bar for market timing.
- Cap rate 13.4% vs local median 2.4% in Asheville — top-decile yield for the area; either an underpriced asset or a hidden risk that comps aren't pricing in. Stress-test before assuming the spread holds.
Location & tenants
- Location reads 72/100 on livability (#96 in NC) — a middle-class / working-renter tenant base. Strengths: commute A+, health & safety A+, housing A-; Watch: crime F.
- Buncombe County Schools (suburban): math 45% / reading 50% proficiency, ranked #72 of 178 in NC (top 40%) — families likely to look elsewhere, expect single-tenant / working-renter base with shorter leases.
- Market conditions: Rents rising fast (+4.4%/yr); 167 active listings in the ZIP; solid renter incomes; 3,305 units permitted in Buncombe County in 2024 (1,855 in 5+ unit buildings).
Forward outlook
- Local home prices are declining (-3.0%/yr); year-one equity from $663 of loan paydown is wiped out by about $3k of value loss. Plan a longer hold.
- Buncombe County population projected at +24% by 2050 — long-run rental-demand tailwind backs the buy-and-hold thesis.
- At projected returns (-3.0% appreciation + 4.4% rent growth), your $27k cash investment doubles in ~5 years — after that, you're playing with house money.
Negotiation context
- It's been on market 953 days — a 12% lower offer ($84k) is reasonable based on typical stale-listing flexibility.
Questions for the listing agent
- It's been on market 953 days. Have you received any prior offers? Is the seller open to a 12% concession, seller financing, or rate buy-down credit?
- Why hasn't it sold? Are there any deal-killer items the seller is aware of (foundation, flood, title, zoning, code violations)?
- Is there a deadline driving the sale (1031 exchange, divorce, estate, relocation)? That informs how much negotiation room exists.
- Schools are B-rated — typically a magnet for longer-tenancy family renters. What's the average tenant stay here, and is there a school-zone premium baked into asking?
- Crime grade is F in this area — have there been break-ins, vandalism, or insurance claims at this property in the last 3 years? What carrier currently insures it and at what premium?
- What's the average days-on-market for RENTAL listings here right now (not sales)? A rising rental-DOM trend means longer vacancies and softer asking-rent achievability than the comps imply.
- What's the recent tenant-quality profile in this submarket — average credit score on applications, eviction rate, late-payment / NSF rate, and stable-employment percentage? A property-management company in the area should have these aggregated.
- How much new for-sale + rental construction is in the pipeline within 1–3 miles? Heavy new supply typically softens prices + rents 12–24 months out; constrained supply supports both.
Investment metrics
- 1% rule
- 1.62% ✓
- Cap rate
- 13.36%
- Cash-on-cash
- 25.24%
- DSCR
- 2.12
- GRM
- 5.1
CMA / ARV
No comps found within radius.
Projected returns pro-forma
-3.0% appreciation · 4.38% rent growth · sell at horizon
- IRR
- 20.3%
- Equity multiple
- 1.84×
- Total profit
- $22,638
- Equity at exit
- $14,299
- IRR
- 29.5%
- Equity multiple
- 3.81×
- Total profit
- $75,352
- Equity at exit
- $8,292
Cash invested: $26,852 (down + closing). Projections, not guarantees.
Landlord ↔ Tenant lean methodology
- Overall (STATE)
- 85 Strongly Landlord-Friendly
- State North Carolina
- 85 Strongly Landlord-Friendly · R+3
- County
- — inherits STATE
- City
- — inherits STATE
ZIP-level market 28805
- Rents YoY
- 4.4%
- Active inventory
- 167
- Price-to-rent
- 5.1×
Monthly cashflow live
- Estimated rent
- $1,554 medium interval (Pro) →
- Mortgage (P&I)
- −$503
- Tax est. 1.5%
- −$120 /mo · $1,438/yr
- Insurance
- −$40
- HOA
- −$0
- Vacancy / Maint / Mgmt
- −$326
- Net cashflow
- $565
Break-even live
UW: 25.0% down · 7.5% · 30yr · 1.5% tax · 5.0% vac · 8.0% maint · 8.0% mgmt
Financing live
Cash to close
- Down payment
- $23,975
- Closing costs
- $2,877
- Reserves months
- —
- Total cash needed
- —
Loan-product check · same deal, 3 products live
Conventional
25% down · 7.5% · 30yr
- Down + closing
- —
- Monthly P&I
- —
- Monthly cashflow
- —
- DSCR
- —
- Eligible?
- —
Personal DTI + credit; lowest rate.
DSCR
20% down · 8.5% · 30yr
- Down + closing
- —
- Monthly P&I
- —
- Monthly cashflow
- —
- DSCR
- —
- Eligible?
- —
No personal income docs; deal must DSCR.
Hard money
10% down · 12.0% · 12mo
- Down + closing
- —
- Monthly P&I
- —
- Monthly cashflow
- —
- DSCR
- —
- Eligible?
- —
Short-term bridge; refi at stabilization.
Listing history 15 events
-
2026-06-18days on market $95,900 Active 953 DOM
-
2026-06-17days on market $95,900 Active 952 DOM
-
2026-06-16days on market $95,900 Active 951 DOM
-
2026-06-15days on market $95,900 Active 950 DOM
-
2026-06-14days on market $95,900 Active 948 DOM
-
2026-06-10days on market $95,900 Active 945 DOM
-
2026-06-09days on market $95,900 Active 944 DOM
-
2026-06-08days on market $95,900 Active 943 DOM
-
2026-06-07days on market $95,900 Active 942 DOM
-
2026-06-03days on market $95,900 Active 938 DOM
-
2026-06-02days on market $95,900 Active 937 DOM
-
2026-06-01days on market $95,900 Active 936 DOM
-
2026-05-31days on market $95,900 Active 935 DOM
-
2026-05-30days on market $95,900 Active 934 DOM
-
2023-11-08$95,900 Active
ⓘ Source: listings_history table (triggers on properties + properties_extension) + one-shot
backfill from property_details.listing_events for pre-trigger history.
Climate risk First Street
- Flood 1/10 Low FEMA zone X (unshaded) · 0% chance over 30 yrs
- Wildfire 3/10 Moderate
- Heat 4/10 Moderate 9 d/yr ≥93°F today · 24 d/yr by 30 yrs out
- Wind 2/10 Low
- Air quality 3/10 Moderate 3 unhealthy d/yr today · 4 by 30 yrs out
Nearby sold comps map
Loading sold comps map…
Walkable amenities ~0.75 mi
Loading nearby amenities…
Taxation est. · year 1
- Rental income
- $18,645
- − Mortgage interest
- −$5,372
- − Property taxes
- −$1,438
- − Insurance
- −$480
- − Repairs & maintenance
- −$1,492
- − Management
- −$1,492
- − Depreciation
- −$2,790
- Taxable income
- $5,582
- Est. tax owed @ 24.0%
- −$1,340
- After-tax cash flow
- $5,437/yr
For passive investors: Depreciation is non-cash, so a rental often shows a tax loss while cash-flowing — sheltering income. Rental losses are passive: they offset passive income freely, and up to $25,000/yr can offset ordinary (W-2) income if you actively participate and your MAGI is under $100k (phasing out to $0 by $150k); unused losses carry forward. On sale, claimed depreciation is recaptured at up to 25%, and gains may owe capital-gains tax (a 1031 exchange can defer both). Figures are a year-1 estimate at your 24.0% rate — not tax advice; consult a CPA.
Condition & rehab AI · 7 photos
This manufactured home in Raleigh, NC, is in good condition with a good condition score of 75. It has a good roof, exterior, and foundation, and is move-in ready with minor cosmetic updates needed to enhance its resale and rental value.
Value-add opportunities
- Both Paint interior walls — Fresh paint can enhance the home's curb appeal and interior aesthetics.
- Resale Upgrade kitchen appliances — Modern appliances can attract more buyers.
- Both Install smart home features — Smart home features can increase both resale and rental value by making the home more convenient and energy-efficient.
Renovation cost estimate screening
Value-add ROI direction
- Both Paint interior walls — Fresh paint can enhance the home's curb appeal and interior aesthetics. ↑
- Resale Upgrade kitchen appliances — Modern appliances can attract more buyers. ↑
- Both Install smart home features — Smart home features can increase both resale and rental value by making the home more convenient and energy-efficient. ↑
ⓘ Cost ranges are severity-bucket heuristics (US national rule-of-thumb). Get contractor quotes + a written scope before underwriting a rehab budget.
Schools (NCES district)
- District
- Buncombe County Schools
- NCES district ID
- 3700450
- Math proficiency
- 45% ▬ 0.00%
- Reading proficiency
- 50% ▲ 2.00%
- Median HH income
- $45,981
- Composite
- 40.32/100
- National rank
- #3749
- State rank
- #72 of 178 in NC
Livability — Asheville
- Score
- 72/100
- State rank
- #96
- US rank
- #6307
Category grades
Schools grade is shown separately in the Schools card above.
Census & demographics
- County
- Buncombe County · 241,085 people
- City population
- 137,611
- Metro
- Asheville, NC
- Population (ZIP)
- 19,993
- Household income
- $75,151
- Rent vs Own
- Severe rent burden
- 678.0
Population outlook (Buncombe County) Hauer SSP2
- Today (2025)
- 286,475 people
- By 2030
- 302,237 · +5.5%
- By 2040
- 330,687 · +15.4%
- By 2050
- 356,370 · +24.4%
- By 2075
- 409,383 · +42.9%
- By 2100
- 437,270 · +52.6%
Race, ethnicity, and origin ACS 2023
- Neighborhood character
- Predominantly White (81%)
- Race & ethnicity
- White 81% Black 8% Two or more races 6% Hispanic / Latino 6%
- Hispanic origin (detail)
- Mexican 2% Puerto Rican 1%
- Common ancestry
- Lithuanian 4% Slovak 3% Serbian 3%
- Foreign-born
- 7% · Canada
- Languages at home
- 94% English-only · Spanish 4% Russian/Polish/Slavic 1% Arabic 1%
Political lean MEDSL · Buncombe
- 2024 margin
- Strong D (+24.8) · D 61.7% · R 36.9% · Other 1.4%
- 2008→2024 swing
- +10.9pp toward D · 2008: 13.9pp · 2024: 24.8pp
- All cycles
- 2024: D+24.8 2020: D+21.1 2016: D+14.6 2012: D+12.4 2008: D+13.9
Not yet ingested
- Civics
- —
Market trends
- HPI YoY
- ▼ -333.54%
- Current HPI
- 287.7647
- Rent YoY
- ▲ 4.38%
- Metro
- Asheville, NC
- State GDP YoY
- ▲ 3.28%
- F500 in state
- 26
Industry mix (Fortune 500 HQ in NC)
| Industry | F500 HQs | Revenue |
|---|---|---|
| Financial Services | 2 | $213B |
|
||
| Retail | 2 | $95B |
|
||
| Industrial Conglomerate | 1 | $38B |
|
||
| Metals / Steel | 1 | $35B |
|
||
| Utilities | 1 | $30B |
|
||
| Industrial Machinery | 1 | $19B |
|
||
Price history
1 event — show timeline
- 2023-11-08 Listed $95,900 Zillow
Cash-flow waterfall
monthlySold comps — $/sqft
last 12 mo · ≤1 miLoading sold comps…