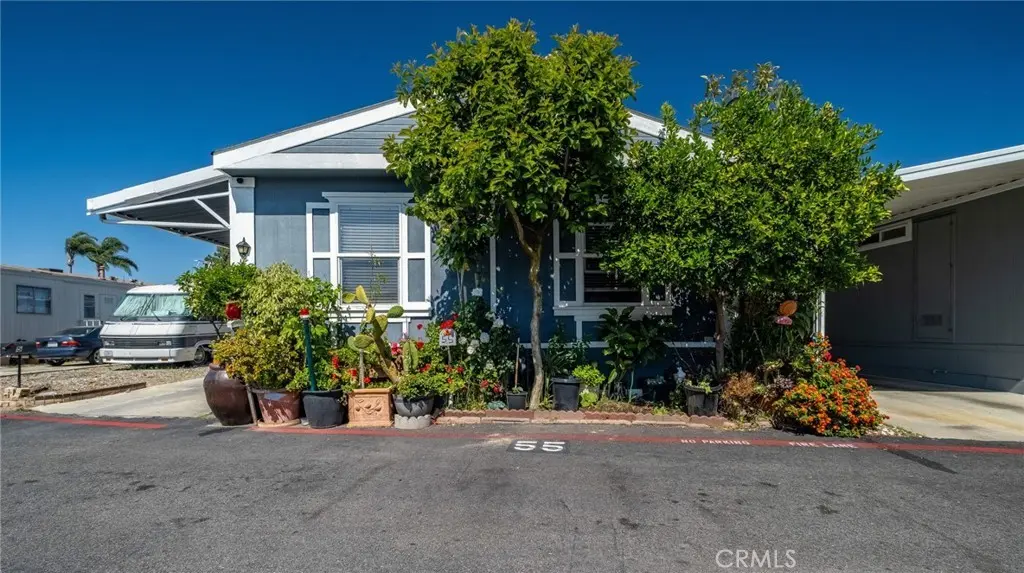
23701 S Western Ave #55 · Torrance, CA
Flood risk 1/10 · Minimal
- FEMA flood zone
- X (unshaded)
- Chance of flooding over 30 yrs
- 0.0%
- Est. flood insurance / yr
- $507 – $1,088
Fire risk 1/10 · Minimal
- Est. fire insurance / yr
- $659 – $1,223
Heat risk 3/10 · Minor
- Hot days now (above 86°F)
- 7 days/yr
- Hot days in 30 yrs
- 22 days/yr
Wind risk 1/10 · Minimal
- Chance of severe wind over 30 yrs
- —
Air-quality risk 5/10 · Moderate
- Unhealthy air days now
- 7 days/yr
- Unhealthy air days in 30 yrs
- 7 days/yr
Risk factors via First Street. Map © Google.
Why this score? — see what drove the B- grade
The composite is a weighted blend of 9 inputs, each scored 0–100. Each bar is that input's sub-score; the figure is the points it added to the 100-point composite (weight × sub-score).
- Cash flow +30.0/30.0
- 1% rule +10.0/10.0
- DSCR +10.0/10.0
- Schools +5.9/10.0
- Livability +3.8/5.0
- Rent growth +3.3/5.0
- Condition / age +2.5/5.0
- ARV discount +0.0/15.0
- Appreciation +0.0/10.0
$145,000
🖨 Deal sheet 📄 Offer letter ✓ Due diligence
Listing remarks
Welcome to this spacious 4-bedroom, 2-bath manufactured home in the desirable Knolls Lodge, an all-age community in Torrance. Featuring soaring vaulted ceilings, abundant natural light, and an open-concept layout, this home offers comfort, functionality, and charm throughout. The living and dining areas flow seamlessly into the kitchen with ample cabinetry, generous counter space, and a breakfast bar ideal for everyday living and entertaining. The spacious primary suite includes high ceilings and an en-suite bath with soaking tub and separate shower. Additional bedrooms offer flexibility for family, guests, or a home office. Updated flooring, bright interiors, large windows, mature landscap
Key facts
- Ample cabinetry
- Soaking tub
- Primary suite
Tags
Property features AI
Finance
- Other: Accessibility: parking
- Financial info: Land lease amount listed
- HOA & community: Land lease (monthly); Community features include street lighting and urban setting; Park name: Knolls Lodge Mobile Home Park; Manager approval required
Exterior
- Parking: Assigned covered carport (2 spaces); Guest parking
- Security: Gated community; Carbon monoxide and smoke detectors; Smoke detector
- Utilities: Public sewer; District/public water; Natural gas connected; Electricity connected; Sewer connected; Water connected
- Home design: Single-story; Entry: park entry then front door; Mobile home remains (12' x 48')
- Construction: Vinyl exterior; Shingle roof; Additions/alterations noted; Year built per public records
- Exterior features: Association pool (in-ground, fenced); Paved lot; Storage building
Interior
- Kitchen: Granite counters; Garbage disposal; Vented exhaust fan; Water purifier; Water heater unit
- Bedrooms: Primary bedroom (main level)
- Flooring: Vinyl flooring; Laminate flooring
- Bathrooms: 2 full bathrooms; Bathtub; Shower-in-tub
- Heating & cooling: Ductless heating; Ductless cooling
- Interior features: High ceilings (9 feet+); Open floor plan; Copper full plumbing; Skylights; Gated community; Carbon monoxide and smoke detectors
- Laundry & utility: Inside laundry in an individual room
Neighborhood map
What this means for you Summary
Snapshot
- This is a 4-bed/2.0-bath manufactured listed at $145k.
Deal economics
- At list price, monthly cash flow is $2k ($26k/yr) — positive.
- The deal already cash-flows at list — no discount required.
- Meets the 1% rule at list price ($4k rent vs $145k).
- Recommended offer: $141k (3.0% below list) — sets the bar for market timing.
- Cap rate 23.9% vs local median 2.1% in Torrance — top-decile yield for the area; either an underpriced asset or a hidden risk that comps aren't pricing in. Stress-test before assuming the spread holds.
Location & tenants
- Location reads 76/100 on livability (#95 in CA, #3,501 nationally) — a middle-class / working-renter tenant base. Strengths: schools A+, amenities A+, commute A+; Watch: health & safety C-, crime D+, cost of living F.
- Torrance Unified (urban): math 62% / reading 67% proficiency, ranked #150 of 1,400 in CA (top 11%) — acceptable for families but not a draw, mixed tenant base, ~2y average lease; only 20% free/reduced lunch — higher-income household profile.
- Market conditions: Rents rising (+3.2%/yr); 96 active listings in the ZIP; 13 comparable units currently listed for rent nearby; rentals at typical pace (median 22d on market — plan ~3-4 weeks tenant-placement turnaround); 46% of comp listings sitting > 30 days — soft ceiling on asking rent; solid renter incomes; 19,697 units permitted in Los Angeles County in 2024 (9,426 in 5+ unit buildings).
- At $3,786/mo this rent would consume 49% of the median local household income ($93k/yr) (locally 1972% of renters already pay >50% of income on rent) — very limited rent-growth headroom before tenants either downsize or default.
Forward outlook
- Local home prices are declining (-3.0%/yr); year-one equity from $1k of loan paydown is wiped out by about $4k of value loss. Plan a longer hold.
- Los Angeles County population projected at +9% by 2050 — modest demand growth; plan on rents tracking national, not racing it.
- At projected returns (-3.0% appreciation + 3.2% rent growth), your $41k cash investment doubles in ~2 years — after that, you're playing with house money.
Negotiation context
- It's been on market 36 days — a 3% lower offer ($141k) is reasonable based on typical stale-listing flexibility.
- 7 sale attempts since 29y ago with the ask held roughly flat each time — persistent listings suggest the price (not the market) is what's stuck; bring a comps-based counter.
- Current owner paid $32k; list at $145k implies a 353% gain — meaningful room to come down on a strong offer.
Questions for the listing agent
- It's been on market 36 days. Have you received any prior offers? Is the seller open to a 3% concession, seller financing, or rate buy-down credit?
- Is there a deadline driving the sale (1031 exchange, divorce, estate, relocation)? That informs how much negotiation room exists.
- Schools are A-rated — typically a magnet for longer-tenancy family renters. What's the average tenant stay here, and is there a school-zone premium baked into asking?
- Crime grade is D in this area — have there been break-ins, vandalism, or insurance claims at this property in the last 3 years? What carrier currently insures it and at what premium?
- What's the average days-on-market for RENTAL listings here right now (not sales)? A rising rental-DOM trend means longer vacancies and softer asking-rent achievability than the comps imply.
- What's the recent tenant-quality profile in this submarket — average credit score on applications, eviction rate, late-payment / NSF rate, and stable-employment percentage? A property-management company in the area should have these aggregated.
- How much new for-sale + rental construction is in the pipeline within 1–3 miles? Heavy new supply typically softens prices + rents 12–24 months out; constrained supply supports both.
Investment metrics
- 1% rule
- 2.61% ✓
- Cap rate
- 23.88%
- Cash-on-cash
- 62.81%
- DSCR
- 3.79
- GRM
- 3.2
CMA / ARV
- ARV (median comp)
- $104,322
- List price
- $145,000
- Delta
- 38.99%
- Verdict
- OVERPRICED
- Comps
- 20 within 1.0 mi
Show comp detail 10 sales within ~0.75 mi
| Address | Dist | Beds/Ba | Sqft | Sold | Price | $/sf | Match |
|---|---|---|---|---|---|---|---|
| 23701 S Western Unit 78A | 0.00mi | 3/2.0 (-1) | 1,176 (+2%) | 1mo | $160,000 | $136 | 91 |
| 23701 S Western Ave #262 | 0.05mi | 3/2.0 (-1) | 1,152 (0%) | 10mo | $154,900 | $134 | 84 |
| 23701 S Western Ave #172 | 0.00mi | 3/2.0 (-1) | 1,232 (+7%) | 7mo | $115,000 | $93 | 78 |
| 23701 S Western Ave #231 | 0.00mi | 3/2.0 (-1) | 1,080 (-6%) | 10mo | $95,000 | $88 | 76 |
| 24200 Walnut St #50 | 0.22mi | 3/2.0 (-1) | 1,140 (-1%) | 13mo | $225,000 | $197 | 72 |
| 24200 Walnut St #64 | 0.22mi | 3/2.0 (-1) | 1,108 (-4%) | 11mo | $210,000 | $190 | 69 |
| 23701 S Western Ave #7 | 0.08mi | 3/2.0 (-1) | 1,040 (-10%) | 11mo | $144,000 | $138 | 66 |
| 23701 S Western Ave #213 | 0.00mi | 3/2.0 (-1) | 1,009 (-12%) | 15mo | $149,600 | $148 | 62 |
| 24200 Walnut #62 | 0.23mi | 3/2.0 (-1) | 1,040 (-10%) | 14mo | $80,000 | $77 | 56 |
| 23701 S Western Ave #241 | 0.00mi | 3/2.0 (-1) | 1,000 (-13%) | 22mo | $155,000 | $155 | 55 |
Match score weights: distance 35% · size 25% · config 20% · recency 20%. Top-matched comps best support the ARV.
Projected returns pro-forma
-3.0% appreciation · 3.25% rent growth · sell at horizon
- IRR
- 62.0%
- Equity multiple
- 3.78×
- Total profit
- $112,773
- Equity at exit
- $21,620
- IRR
- 66.7%
- Equity multiple
- 7.81×
- Total profit
- $276,303
- Equity at exit
- $12,537
Cash invested: $40,600 (down + closing). Projections, not guarantees.
Landlord ↔ Tenant lean methodology
- Overall (STATE)
- 18 Strongly Tenant-Friendly
- State California
- 18 Strongly Tenant-Friendly · D+13
- County
- — inherits STATE
- City
- — inherits STATE
ZIP-level market 90501
- Rents YoY
- 3.2%
- Active inventory
- 96
- Price-to-rent
- 3.2×
Monthly cashflow live
- Estimated rent
- $3,786 high interval (Pro) →
- Mortgage (P&I)
- −$760
- Tax from tax record
- −$45 /mo · $540/yr
- Insurance
- −$60
- HOA
- −$0
- Vacancy / Maint / Mgmt
- −$795
- Net cashflow
- $2,125
Break-even live
UW: 25.0% down · 7.5% · 30yr · 1.5% tax · 5.0% vac · 8.0% maint · 8.0% mgmt
Financing live
Cash to close
- Down payment
- $36,250
- Closing costs
- $4,350
- Reserves months
- —
- Total cash needed
- —
Loan-product check · same deal, 3 products live
Conventional
25% down · 7.5% · 30yr
- Down + closing
- —
- Monthly P&I
- —
- Monthly cashflow
- —
- DSCR
- —
- Eligible?
- —
Personal DTI + credit; lowest rate.
DSCR
20% down · 8.5% · 30yr
- Down + closing
- —
- Monthly P&I
- —
- Monthly cashflow
- —
- DSCR
- —
- Eligible?
- —
No personal income docs; deal must DSCR.
Hard money
10% down · 12.0% · 12mo
- Down + closing
- —
- Monthly P&I
- —
- Monthly cashflow
- —
- DSCR
- —
- Eligible?
- —
Short-term bridge; refi at stabilization.
Rent comps 13 comps
| Address | Beds | Baths | Sqft | Rent | $/sqft | DOM | Units | Dist |
|---|---|---|---|---|---|---|---|---|
| 24223 Ambassador Pl Harbor City, CA | 3.0 | 2.0 | 1208 | $3,800 | $3.15 | 5d | 1 | 0.49mi |
| 1570 W 226th St Torrance, CA | 3.0 | 2.0 | 1200 | $3,750 | $3.12 | 22d | 1 | 0.80mi |
| 22423 Harvard Blvd Torrance, CA | 3.0 | 1.0 | 1150 | $3,750 | $3.26 | 5d | 1 | 0.89mi |
| 22919 Mariposa Ave Torrance, CA | 2.0–3.0 | 2.5–4.0 | 1480 | $4,000 | $2.70 | 44d | 2 | 0.90mi |
| 1435 Lomita Blvd #105 Harbor City, CA | 3.0 | 2.0 | 1260 | $3,250 | $2.58 | 44d | 1 | 0.92mi |
| 1732 251st St Lomita, CA | 3.0 | 1.0 | 1200 | $4,000 | $3.33 | 44d | 1 | 0.93mi |
| 2222 248th St Unit 2228 Lomita, CA | 3.0 | 2.0 | 1199 | $3,200 | $2.67 | 8d | 1 | 0.96mi |
| 25021 Oak St Lomita, CA | 3.0 | 2.0 | 1281 | $3,995 | $3.12 | 8d | 1 | 0.96mi |
| 1918 252nd St Lomita, CA | 3.0 | 2.0 | 1488 | $3,900 | $2.62 | 44d | 1 | 1.01mi |
| 25326 Oak St Unit 1 Lomita, CA | 3.0 | 2.0 | 1300 | $3,650 | $2.81 | 44d | 1 | 1.16mi |
| 2023 Border Ave Torrance, CA | 3.0 | 2.0 | 1224 | $4,500 | $3.68 | 19d | 1 | 1.20mi |
| 25205 Cypress St Unit 3 Lomita, CA | 3.0 | 2.5 | 1397 | $3,395 | $2.43 | 44d | 1 | 1.24mi |
| 1751 Cabrillo Ave Unit K Torrance, CA | 3.0 | 2.0 | 1150 | $3,295 | $2.87 | 13d | 1 | 1.40mi |
Listing history 34 events
-
2026-06-18days on market $145,000 Active 36 DOM
-
2026-06-17days on market $145,000 Active 35 DOM
-
2026-06-16days on market $145,000 Active 34 DOM
-
2026-06-15days on market $145,000 Active 33 DOM
-
2026-06-13days on market $145,000 Active 31 DOM
-
2026-06-13days on market $145,000 Active 30 DOM
-
2026-06-09days on market $145,000 Active 27 DOM
-
2026-06-08days on market $145,000 Active 26 DOM
-
2026-06-07days on market $145,000 Active 25 DOM
-
2026-06-04days on market $145,000 Active 22 DOM
-
2026-06-03days on market $145,000 Active 21 DOM
-
2026-06-02days on market $145,000 Active 20 DOM
-
2026-06-01days on market $145,000 Active 19 DOM
-
2026-05-31days on market $145,000 Active 18 DOM
-
2026-05-13$145,000 Active 840-char remark
-
2016-02-16price $374,876
-
2014-10-10historical
-
2014-08-27$25,000 Active
-
2014-08-27historical
-
2014-08-27$25,000 Active
-
2011-09-07soldstatus $32,000 Closed
-
2011-07-18status Pending
-
2011-04-12$34,500 Active
-
2006-08-16historical
-
2005-06-17price $85,000
-
2005-06-17price $85,000
-
2005-06-17price $85,000
-
2005-06-16$75,000
-
2005-03-29historical
-
2005-01-14price $374,876
-
2005-01-14price $374,876
-
2005-01-02$85,000
-
1997-09-20historical
-
1997-06-20$12,000
ⓘ Source: listings_history table (triggers on properties + properties_extension) + one-shot
backfill from property_details.listing_events for pre-trigger history.
Tax reassessment forecast CA · Resets to sale price
- Current annual tax
- $540 · $45/mo
- Projected year-2 tax
- $1,102 · $92/mo
- Expected delta
- +$562/yr (+$47/mo · 104.1%)
ⓘ Screening estimate from a state-policy table — verify with the county assessor before closing.
Climate risk First Street
- Flood 1/10 Low FEMA zone X (unshaded) · 0% chance over 30 yrs
- Wildfire 1/10 Low
- Heat 3/10 Moderate 7 d/yr ≥86°F today · 22 d/yr by 30 yrs out
- Wind 1/10 Low
- Air quality 5/10 Major 7 unhealthy d/yr today · 7 by 30 yrs out
Nearby sold comps map
Loading sold comps map…
Walkable amenities ~0.75 mi
Loading nearby amenities…
Taxation est. · year 1
- Rental income
- $45,429
- − Mortgage interest
- −$8,122
- − Property taxes
- −$540
- − Insurance
- −$725
- − Repairs & maintenance
- −$3,634
- − Management
- −$3,634
- − Depreciation
- −$4,218
- Taxable income
- $24,556
- Est. tax owed @ 24.0%
- −$5,893
- After-tax cash flow
- $19,606/yr
For passive investors: Depreciation is non-cash, so a rental often shows a tax loss while cash-flowing — sheltering income. Rental losses are passive: they offset passive income freely, and up to $25,000/yr can offset ordinary (W-2) income if you actively participate and your MAGI is under $100k (phasing out to $0 by $150k); unused losses carry forward. On sale, claimed depreciation is recaptured at up to 25%, and gains may owe capital-gains tax (a 1031 exchange can defer both). Figures are a year-1 estimate at your 24.0% rate — not tax advice; consult a CPA.
Schools (NCES district)
- District
- Torrance Unified
- NCES district ID
- 0639420
- Math proficiency
- 62% ▲ 2.00%
- Reading proficiency
- 67% ▬ 0.00%
- Median HH income
- $78,640
- Composite
- 58.96/100
- National rank
- #1969
- State rank
- #150 of 1400 in CA
Livability — Torrance
- Score
- 76/100
- State rank
- #95
- US rank
- #3501
Category grades
Schools grade is shown separately in the Schools card above.
Census & demographics
- Census place
- Torrance, CA
- County
- Los Angeles County · 9,444,647 people
- City population
- 153,473
- Metro
- Los Angeles-Long Beach-Anaheim, CA
- Population (ZIP)
- 41,787
- Household income
- $92,923
- Rent vs Own
- Severe rent burden
- 1972.0
Population outlook (Los Angeles County) Hauer SSP2
- Today (2025)
- 10,940,515 people
- By 2030
- 11,256,481 · +2.9%
- By 2040
- 11,729,929 · +7.2%
- By 2050
- 11,948,407 · +9.2%
- By 2075
- 11,818,114 · +8.0%
- By 2100
- 10,842,928 · -0.9%
Race, ethnicity, and origin ACS 2023
- Neighborhood character
- Diverse neighborhood (Simpson 0.70)
- Race & ethnicity
- Hispanic / Latino 43% Asian 27% White 20% Two or more races 15% Black 5%
- Hispanic origin (detail)
- Mexican 34%
- Common ancestry
- Slovak 1% Lithuanian 1% British 1%
- Foreign-born
- 33% · Canada, South Korea, China
- Languages at home
- 46% English-only · Spanish 32% Other Asian/Pacific 5% Korean 5%
Political lean MEDSL · Los Angeles
- 2024 margin
- Solid D (+32.9) · D 64.8% · R 31.9% · Other 3.3%
- 2008→2024 swing
- -7.4pp toward R · 2008: 40.4pp · 2024: 32.9pp
- All cycles
- 2024: D+32.9 2020: D+44.2 2016: D+48.0 2012: D+40.0 2008: D+40.4
Not yet ingested
- Civics
- —
Market trends
- HPI YoY
- ▼ -755.95%
- Current HPI
- 334.9041
- Rent YoY
- ▲ 3.25%
- Metro
- Los Angeles-Long Beach-Anaheim, CA
- State GDP YoY
- ▲ 3.21%
- F500 in state
- 116
Industry mix (Fortune 500 HQ in CA)
| Industry | F500 HQs | Revenue |
|---|---|---|
| Technology | 27 | $1,492B |
|
||
| Financial Services | 3 | $174B |
|
||
| Retail | 3 | $44B |
|
||
| Insurance | 3 | $26B |
|
||
| Media / Entertainment | 2 | $115B |
|
||
| Pharmaceuticals / Biotech | 2 | $62B |
|
||
Price history
+1108.3% since first listed20 events — show timeline
- 2026-05-13 Listed $145,000 CRMLS
- 2016-02-16 Price Changed $374,876 CRMLS
- 2014-10-10 Listing Removed — CRMLS
- 2014-08-27 Listed $25,000 CRMLS
- 2014-08-27 Listing Removed — CRMLS
- 2014-08-27 Listed $25,000 CRMLS
- 2011-09-07 Sold (MLS) $32,000 CRMLS
- 2011-07-18 Pending — CRMLS
- 2011-04-12 Listed $34,500 CRMLS
- 2006-08-16 Listing Removed — CRMLS
- 2005-06-17 Price Changed $85,000 CRMLS
- 2005-06-17 Price Changed $85,000 CRMLS
- 2005-06-17 Price Changed $85,000 CRMLS
- 2005-06-16 Listed $75,000 CRMLS
- 2005-03-29 Listing Removed — CRMLS
- 2005-01-14 Price Changed $374,876 CRMLS
- 2005-01-14 Price Changed $374,876 CRMLS
- 2005-01-02 Listed $85,000 CRMLS
- 1997-09-20 Listing Removed — CRMLS
- 1997-06-20 Listed $12,000 CRMLS
Property tax history
+4.3%/yrLatest (2025): $540 · +4.3% YoY. Source: county tax records.
Cash-flow waterfall
monthlySold comps — $/sqft
last 12 mo · ≤1 miLoading sold comps…