 🏗️ New Construction
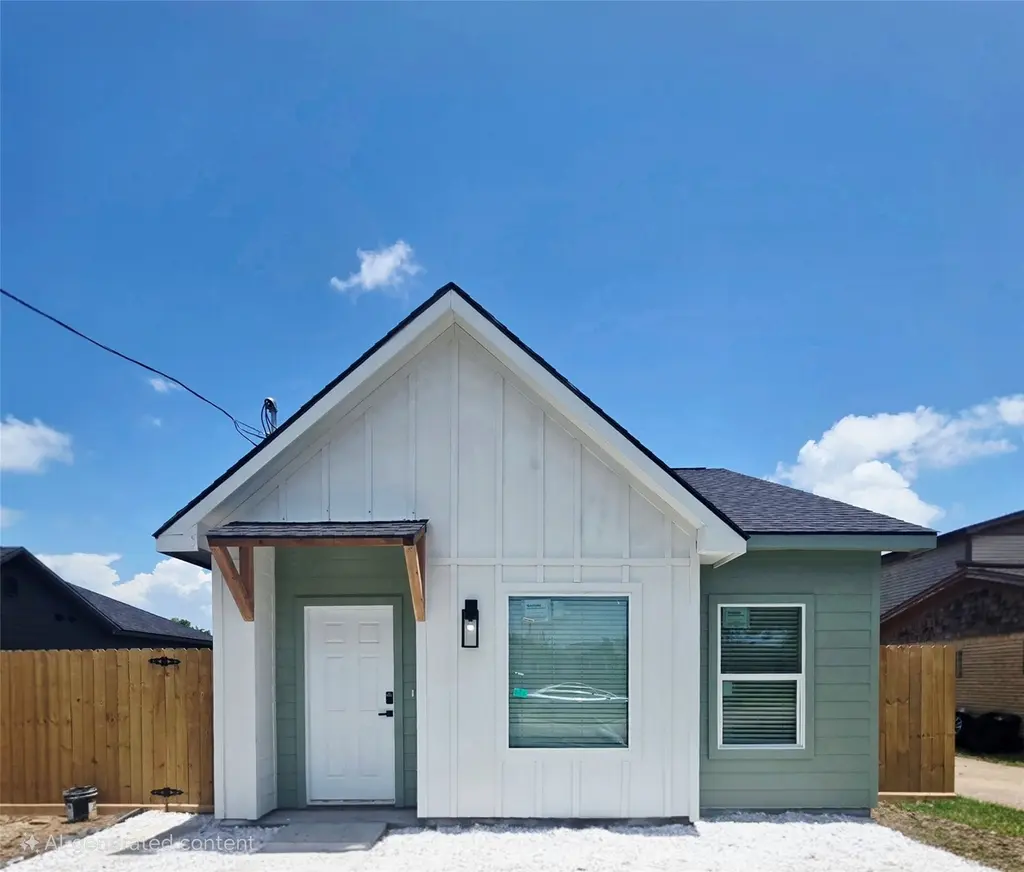
715 Rosedale St · La Marque, TX
Flood risk 7/10 · Major
- FEMA flood zone
- X
- Chance of flooding over 30 yrs
- 0.6%
- Est. flood insurance / yr
- $507 – $1,088
Fire risk 1/10 · Minimal
- Est. fire insurance / yr
- $1,222 – $2,270
Heat risk 10/10 · Severe
- Hot days now (above 109°F)
- 7 days/yr
- Hot days in 30 yrs
- 27 days/yr
Wind risk 10/10 · Severe
- Chance of severe wind over 30 yrs
- 99.0%
Air-quality risk 3/10 · Minor
- Unhealthy air days now
- 2 days/yr
- Unhealthy air days in 30 yrs
- 2 days/yr
Risk factors via First Street. Map © Google.
Why this score? — see what drove the D+ grade
The composite is a weighted blend of 9 inputs, each scored 0–100. Each bar is that input's sub-score; the figure is the points it added to the 100-point composite (weight × sub-score).
- Cash flow +19.5/30.0
- ARV discount +7.5/15.0
- DSCR +6.2/10.0
- 1% rule +5.2/10.0
- Rent growth +3.5/5.0
- Livability +3.0/5.0
- Condition / age +2.5/5.0
- Schools +2.4/10.0
- Appreciation +0.0/10.0
$199,000
🖨 Deal sheet (PDF) 📄 Offer letter ✓ Due diligence
Listing remarks
Newly constructed home that embodies modern architectural elegance, offering a perfect blend of simplicity and practicality. This home spans 1120 sq. ft. and features 3 bedrooms, 2 Bathrooms, and an abundance of natural light throughout. You'll find high ceilings throughout the home that complements the spacious open concept. Designer style kitchen complete with a generous island, ideal for cooking and entertaining. The Living give access to a large side and backyard. The beautiful primary suite is a true sanctuary, boasting high ceilings, and a large walk-in closet. Its en-suite primary bath showcases beautifully crafted fixtures and tiles. Schedule a tour!
Key facts
- 6,085 sq ft lot
- Built 2025
- Listed 41 days
Property features AI
Exterior
- Parking: No dedicated parking
- Utilities: Public water; Public sewer
- Home design: Residential property; New construction (2025); Single-level entry (first-floor living)
- Construction: Cement and wood siding; Composition roof; Slab foundation; Builder: Dirty and Stinky Junk Removal llc.; Living area approximately 1,120
- Exterior features: Subdivision lot; Other lot features
Interior
- Kitchen: Dishwasher; Electric range; Microwave; Garbage disposal
- Bedrooms: Primary bedroom on first floor (approx. 14' x 11'); Two additional bedrooms on first floor (each approx. 10' x 12')
- Bathrooms: Two full bathrooms; Primary bathroom on first floor (approx. 10' x 5')
- Heating & cooling: Central heating (electric); Central air conditioning (electric)
- Interior features: Seller provided disclosure available
- Laundry & utility: Washer hookup; Electric dryer hookup
Neighborhood map
What this means for you Summary
Snapshot
- This is a 3-bed/2.0-bath land listed at $199k.
Deal economics
- At list price, monthly cash flow is $105 ($1k/yr) — positive.
- To cash-flow at today's rent, offer at most $166k (16.7% below list).
- To meet the 1% rule (rent ≥ 1% of price), the offer needs to be $153k (22.9% below list).
- Recommended offer: $153k (22.9% below list) — sets the bar for 1% rule.
- Cap rate 7.7% vs local median 5.6% in La Marque — top-decile yield for the area; either an underpriced asset or a hidden risk that comps aren't pricing in. Stress-test before assuming the spread holds.
Location & tenants
- Location reads 59/100 on livability (#1,136 in TX) — a working-class tenant base; expect higher turnover. Strengths: cost of living A+, housing A+; Watch: employment D, crime F, amenities F.
- Texas City ISD (suburban): math 28% / reading 29% proficiency, ranked #655 of 826 in TX (top 79%) — low school quality limits family demand, transient renter base, plan for 1-2y turnover; 66% free/reduced lunch — lower-income household profile, screen leases tightly.
- Zoned schools: Hayley El (math 7% / reading 11%, grade F, #4,293 of 4,322 statewide, top 99%, 562 students, 92% FRL); La Marque H S (math 27% / reading 20%, grade F, #1,342 of 1,632 statewide, top 82%, 647 students, 91% FRL) — zoned schools average 92% FRL vs 66% district-wide (26 pts higher); higher-poverty schools than district average — tighter screening recommended.
- Zoned-school proficiency averages 16% at this address vs 28% district-wide (-12 pts) — the specific schools serving this property underperform the Texas City ISD average; the district grade overstates school quality for this exact location.
- Market conditions: Rents rising (+4.0%/yr); 661 active listings in the ZIP; 16 comparable units currently listed for rent nearby; rentals at typical pace (median 26d on market — plan ~3-4 weeks tenant-placement turnaround); 3,258 units permitted in Galveston County in 2024 (0 in 5+ unit buildings).
Forward outlook
- Local home prices are declining (-3.0%/yr); year-one equity from $1k of loan paydown is wiped out by about $5k of value loss. Plan a longer hold.
- Galveston County population projected at +43% by 2050 — long-run rental-demand tailwind backs the buy-and-hold thesis.
Negotiation context
- It's been on market 41 days — a 3% lower offer ($193k) is reasonable based on typical stale-listing flexibility.
- 3 sale attempts with the ask held roughly flat each time — persistent listings suggest the price (not the market) is what's stuck; bring a comps-based counter.
Risks & watch-outs
- Watch-outs: flood insurance adds $66/mo.
- Climate carrying-cost: major flood risk; severe wind risk, 99% chance of damaging wind over 30y; extreme-heat days projected 7→27/yr by 2055 (HVAC capex compounding) — expect insurance premiums to compound above CPI over the hold.
Questions for the listing agent
- It's been on market 41 days. Have you received any prior offers? Is the seller open to a 23% concession, seller financing, or rate buy-down credit?
- What's the actual annual flood-insurance premium (NFIP or private), and is the property in a SFHA with mandatory coverage?
- Is there a deadline driving the sale (1031 exchange, divorce, estate, relocation)? That informs how much negotiation room exists.
- Schools are F-rated, which usually means shorter tenancies and higher turnover. Who's the typical renter profile here, and what's been the actual vacancy rate?
- Crime grade is F in this area — have there been break-ins, vandalism, or insurance claims at this property in the last 3 years? What carrier currently insures it and at what premium?
- The area grade is low — what's the realistic commute time and amenity access for the typical tenant pool here? Any planned neighborhood developments (good or bad) we should know about?
- What's the average days-on-market for RENTAL listings here right now (not sales)? A rising rental-DOM trend means longer vacancies and softer asking-rent achievability than the comps imply.
- What's the recent tenant-quality profile in this submarket — average credit score on applications, eviction rate, late-payment / NSF rate, and stable-employment percentage? A property-management company in the area should have these aggregated.
- How much new for-sale + rental construction is in the pipeline within 1–3 miles? Heavy new supply typically softens prices + rents 12–24 months out; constrained supply supports both.
Investment metrics
- 1% rule
- 1.02% ✓
- Cap rate
- 7.66%
- Cash-on-cash
- 4.88%
- DSCR
- 1.22
- GRM
- 8.2
CMA / ARV
- ARV (median comp)
- $150,499
- List price
- $199,000
- Delta
- 32.23%
- Verdict
- OVERPRICED
- Comps
- 20 within 1.0 mi
Projected returns pro-forma
-3.0% appreciation · 3.95% rent growth · sell at horizon
- IRR
- -10.4%
- Equity multiple
- 0.62×
- Total profit
- $-16,160
- Equity at exit
- $22,440
- IRR
- 0.3%
- Equity multiple
- 1.02×
- Total profit
- $984
- Equity at exit
- $13,012
Cash invested: $42,140 (down + closing). Projections, not guarantees.
Landlord ↔ Tenant lean methodology
- Overall (STATE)
- 87 Strongly Landlord-Friendly
- State Texas
- 87 Strongly Landlord-Friendly · R+5
- County
- — inherits STATE
- City
- — inherits STATE
ZIP-level market 77568
- Home prices YoY
- -22.7%
- Rents YoY
- 4.0%
- Active inventory
- 661
- Price-to-rent
- 10.8×
Monthly cashflow live
- Estimated rent
- $1,533 high interval (Pro) →
- Mortgage (P&I)
- −$789
- Tax est. 1.5%
- −$188 /mo · $2,257/yr
- Insurance
- −$63
- Flood insurance flood zone
- −$66 /mo · $798/yr
- HOA
- −$0
- Vacancy / Maint / Mgmt
- −$322
- Net cashflow
- $105
Break-even live
Sensitivity live
| Price | -10% $209 | -5% $157 | +0% $105 | +5% $53 | +10% $1 |
|---|---|---|---|---|---|
| Rent | -10% $-16 | -5% $44 | +0% $105 | +5% $166 | +10% $226 |
| Rate | -1.0pp $181 | -0.5pp $143 | base $105 | +0.5pp $66 | +1.0pp $26 |
UW: 25.0% down · 7.5% · 30yr · 1.5% tax · 5.0% vac · 8.0% maint · 8.0% mgmt
Financing live
Cash to close
- Down payment
- $37,625
- Closing costs
- $4,515
- Reserves months
- —
- Total cash needed
- —
Loan-product check · same deal, 3 products live
Conventional
25% down · 7.5% · 30yr
- Down + closing
- —
- Monthly P&I
- —
- Monthly cashflow
- —
- DSCR
- —
- Eligible?
- —
Personal DTI + credit; lowest rate.
DSCR
20% down · 8.5% · 30yr
- Down + closing
- —
- Monthly P&I
- —
- Monthly cashflow
- —
- DSCR
- —
- Eligible?
- —
No personal income docs; deal must DSCR.
Hard money
10% down · 12.0% · 12mo
- Down + closing
- —
- Monthly P&I
- —
- Monthly cashflow
- —
- DSCR
- —
- Eligible?
- —
Short-term bridge; refi at stabilization.
Rent comps 16 comps
| Address | Beds | Baths | Sqft | Rent | $/sqft | DOM | Units | Dist |
|---|---|---|---|---|---|---|---|---|
| 711 Avenue A Unit 4 La Marque, TX | 2.0 | 1.0 | 750 | $799 | $1.07 | 45d | 1 | 0.05mi |
| 509 Bluebonnet Dr La Marque, TX | 4.0 | 1.0 | 1223 | $1,550 | $1.27 | 45d | 1 | 0.25mi |
| 203 Beatrice St La Marque, TX | 3.0 | 1.0 | 1304 | $1,395 | $1.07 | 26d | 1 | 0.60mi |
| 4417 Edward St Texas City, TX | 2.0 | 2.0 | 983 | $1,100 | $1.12 | 5d | 1 | 0.73mi |
| 4417 Edward St Texas City, TX | 2.0 | 2.0 | 983 | $1,150 | $1.17 | 4d | 1 | 0.73mi |
| 113 N Pecan Dr Texas City, TX | 4.0 | 2.0 | 1468 | $3,000 | $2.04 | 45d | 1 | 0.77mi |
| 2328 Boss St La Marque, TX | 2.0 | 1.0 | 848 | $925 | $1.09 | 14d | 2 | 0.93mi |
| 309 S Bell Dr Texas City, TX | 2.0 | 2.0 | 1316 | $1,650 | $1.25 | 45d | 1 | 0.96mi |
| 1825 Bayou Rd La Marque, TX | 2.0 | 1.0 | 1200 | $1,195 | $1.00 | 45d | 1 | 0.96mi |
| 306 Lake Rd Unit B La Marque, TX | 2.0 | 1.0 | 816 | $995 | $1.22 | 45d | 1 | 1.03mi |
| 222 Ruslee St La Marque, TX | 3.0 | 1.0 | 849 | $1,350 | $1.59 | 18d | 1 | 1.07mi |
| 1013 Margot St La Marque, TX | 3.0 | 2.0 | 1099 | $1,500 | $1.36 | 20d | 1 | 1.16mi |
| 105 Plum St La Marque, TX | 4.0 | 1.5 | 1329 | $2,100 | $1.58 | 5d | 1 | 1.25mi |
| 1006 E Camp Cir La Marque, TX | 3.0 | 1.0 | 1230 | $1,500 | $1.22 | 26d | 1 | 1.34mi |
| 619 N Vionett Ln Texas City, TX | 3.0 | 2.0 | 1204 | $1,550 | $1.29 | 7d | 1 | 1.37mi |
| 1115 Highway 146 N Texas City, TX | 1.0–2.0 | 1.0–2.0 | 757 | $1,350 | $1.78 | 1d | 8 | 1.49mi |
Listing history 22 events
-
2026-06-21days on market $199,000 Active 41 DOM
-
2026-06-18days on market $199,000 Active 38 DOM
-
2026-06-17days on market $199,000 Active 37 DOM
-
2026-06-16days on market $199,000 Active 36 DOM
-
2026-06-15days on market $199,000 Active 35 DOM
-
2026-06-13days on market $199,000 Active 33 DOM
-
2026-06-09days on market $199,000 Active 29 DOM
-
2026-06-08days on market $199,000 Active 28 DOM
-
2026-06-07days on market $199,000 Active 27 DOM
-
2026-06-04days on market $199,000 Active 24 DOM
-
2026-06-03days on market $199,000 Active 23 DOM
-
2026-06-02days on market $199,000 Active 22 DOM
-
2026-06-01days on market $199,000 Active 21 DOM
-
2026-05-31days on market $199,000 Active 20 DOM
-
2026-05-11$199,000 Active 666-char remark
-
2026-04-30historical
-
2026-04-25price $199,000
-
2026-02-27$209,000 Active
-
2026-02-26historical
-
2026-01-19price $209,000
-
2025-11-12price $219,000
-
2025-10-12$225,000 Active
ⓘ Source: listings_history table (triggers on properties + properties_extension) + one-shot
backfill from property_details.listing_events for pre-trigger history.
Climate risk First Street
- Flood 7/10 Severe FEMA zone X · 60% chance over 30 yrs
- Wildfire 1/10 Low
- Heat 10/10 Extreme 7 d/yr ≥109°F today · 27 d/yr by 30 yrs out
- Wind 10/10 Extreme 99% chance of damaging wind over 30 yrs
- Air quality 3/10 Moderate 2 unhealthy d/yr today · 2 by 30 yrs out
Nearby sold comps map
Loading sold comps map…
Walkable amenities ~0.75 mi
Loading nearby amenities…
Taxation est. · year 1
- Rental income
- $18,402
- − Mortgage interest
- −$8,430
- − Property taxes
- −$2,257
- − Insurance
- −$1,550
- − Repairs & maintenance
- −$1,472
- − Management
- −$1,472
- − Depreciation
- −$4,378
- Taxable loss
- −$1,158
- Est. tax savings @ 24.0%
- +$278
- After-tax cash flow
- $1,537/yr
For passive investors: Depreciation is non-cash, so a rental often shows a tax loss while cash-flowing — sheltering income. Rental losses are passive: they offset passive income freely, and up to $25,000/yr can offset ordinary (W-2) income if you actively participate and your MAGI is under $100k (phasing out to $0 by $150k); unused losses carry forward. On sale, claimed depreciation is recaptured at up to 25%, and gains may owe capital-gains tax (a 1031 exchange can defer both). Figures are a year-1 estimate at your 24.0% rate — not tax advice; consult a CPA.
Schools (NCES district)
- District
- Texas City ISD
- NCES district ID
- 4842510
- Math proficiency
- 28% ▼ -10.00%
- Reading proficiency
- 29% ▼ -4.00%
- Median HH income
- $44,875
- Composite
- 24.47/100
- National rank
- #7664
- State rank
- #655 of 826 in TX
Livability — La Marque
- Score
- 59/100
- State rank
- #1136
- US rank
- #20037
Category grades
Schools grade is shown separately in the Schools card above.
Census & demographics
- Census place
- La Marque, TX
- County
- Galveston County · 357,330 people
- City population
- 23,083
- Metro
- Houston-The Woodlands-Sugar Land, TX
- Population (ZIP)
- 23,083
- Household income
- $74,694
- Rent vs Own
- Severe rent burden
- 700.0
Population outlook (Galveston County) Hauer SSP2
- Today (2025)
- 390,640 people
- By 2030
- 425,226 · +8.9%
- By 2040
- 493,765 · +26.4%
- By 2050
- 559,698 · +43.3%
- By 2075
- 719,260 · +84.1%
- By 2100
- 819,628 · +109.8%
Race, ethnicity, and origin ACS 2023
- Neighborhood character
- Highly diverse neighborhood (Simpson 0.71)
- Race & ethnicity
- White 37% Hispanic / Latino 29% Black 26% Two or more races 17% Asian 3%
- Hispanic origin (detail)
- Mexican 22% Puerto Rican 1%
- Common ancestry
- Lithuanian 1% Italian 1% Serbian 1%
- Foreign-born
- 8% · Canada
- Languages at home
- 77% English-only · Spanish 21% Tagalog/Filipino 1% Other Asian/Pacific 1%
Political lean MEDSL · Galveston
- 2024 margin
- Strong R (+27.4) · D 35.7% · R 63.1% · Other 1.2%
- 2008→2024 swing
- -7.9pp toward R · 2008: -19.5pp · 2024: -27.4pp
- All cycles
- 2024: R+27.4 2020: R+22.6 2016: R+22.6 2012: R+26.9 2008: R+19.5
Not yet ingested
- Civics
- —
Market trends
- HPI YoY
- ▼ -69.39%
- Current HPI
- 236.0239
- Rent YoY
- ▲ 3.95%
- Metro
- Houston-The Woodlands-Sugar Land, TX
- State GDP YoY
- ▲ 3.95%
- F500 in state
- 110
Industry mix (Fortune 500 HQ in TX)
| Industry | F500 HQs | Revenue |
|---|---|---|
| Energy | 16 | $1,198B |
|
||
| Technology | 5 | $198B |
|
||
| Engineering / Construction | 4 | $72B |
|
||
| Energy Services | 3 | $60B |
|
||
| Utilities | 3 | $41B |
|
||
| Healthcare | 2 | $330B |
|
||
Price history
-11.6% since first listed8 events — show timeline
- 2026-05-11 Listed $199,000 HARMLS
- 2026-04-30 Listing Removed — HARMLS
- 2026-04-25 Price Changed $199,000 HARMLS
- 2026-02-27 Listed $209,000 HARMLS
- 2026-02-26 Listing Removed — HARMLS
- 2026-01-19 Price Changed $209,000 HARMLS
- 2025-11-12 Price Changed $219,000 HARMLS
- 2025-10-12 Listed $225,000 HARMLS
Property tax history
+16.4%/yrLatest (2025): $329 · +3.0% YoY. Source: county tax records.
Cash-flow waterfall
monthlySold comps — $/sqft
last 12 mo · ≤1 miLoading sold comps…