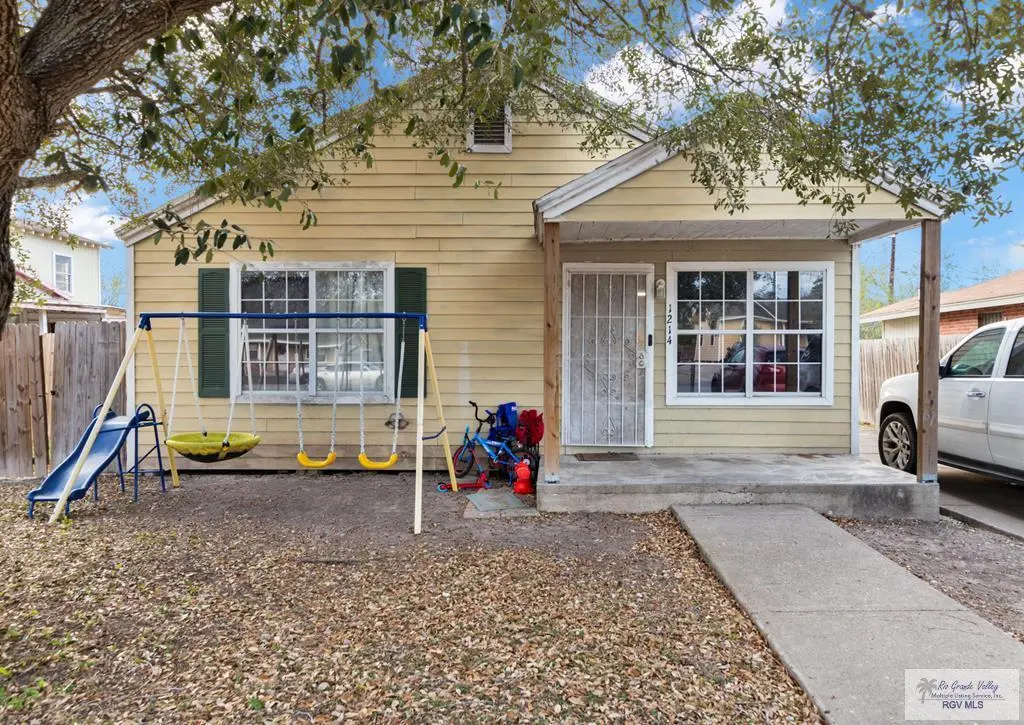
1214 S C St · Harlingen, TX
Flood risk 4/10 · Minor
- FEMA flood zone
- X (unshaded)
- Chance of flooding over 30 yrs
- 0.2%
- Est. flood insurance / yr
- $507 – $1,088
Fire risk 1/10 · Minimal
- Est. fire insurance / yr
- $1,222 – $2,270
Heat risk 9/10 · Severe
- Hot days now (above 110°F)
- 7 days/yr
- Hot days in 30 yrs
- 24 days/yr
Wind risk 8/10 · Major
- Chance of severe wind over 30 yrs
- 99.0%
Air-quality risk 1/10 · Minimal
- Unhealthy air days now
- 0 days/yr
- Unhealthy air days in 30 yrs
- 0 days/yr
Risk factors via First Street. Map © Google.
Why this score? — see what drove the C grade
The composite is a weighted blend of 9 inputs, each scored 0–100. Each bar is that input's sub-score; the figure is the points it added to the 100-point composite (weight × sub-score).
- Cash flow +18.5/30.0
- ARV discount +15.0/15.0
- DSCR +5.8/10.0
- 1% rule +5.7/10.0
- Livability +3.7/5.0
- Rent growth +3.4/5.0
- Schools +2.5/10.0
- Condition / age +2.5/5.0
- Appreciation +0.0/10.0
$95,000
🖨 Deal sheet (PDF) 📄 Offer letter ✓ Due diligence
Listing remarks MLS
2-bedroom, 1-bath frame home featuring natural wood floors and laminate flooring. Ideal as a starter home or investment property. Comfortable living room, ample kitchen cabinetry, and well-sized bedrooms. Washer and dryer connections located inside the home. Tenant occupied—24-hour notice required. Tenant is willing to remain, making this a great income-producing opportunity. Conveniently located just minutes from the expressway, offering easy access to grocery shopping, dining, and everyday amenities.
Key facts
- Natural wood floors
- Laminate flooring
- 7,000 sq ft lot
Tags
Neighborhood map
What this means for you Summary
Snapshot
- This is a 2-bed/1.0-bath single-family listed at $95k.
Deal economics
- At list price, monthly cash flow is $91 ($1k/yr) — positive.
- The deal already cash-flows at list — no discount required.
- Meets the 1% rule at list price ($1k rent vs $95k).
- Recommended offer: $84k (12.0% below list) — sets the bar for market timing.
- Cap rate 7.4% vs local median 3.8% in Harlingen — top-decile yield for the area; either an underpriced asset or a hidden risk that comps aren't pricing in. Stress-test before assuming the spread holds.
Location & tenants
- Location reads 73/100 on livability (#217 in TX) — a middle-class / working-renter tenant base. Strengths: amenities A+, cost of living A+, housing A+; Watch: crime C-, schools D+, commute F.
- Harlingen CISD (urban): math 25% / reading 35% proficiency, ranked #647 of 826 in TX (top 78%) — families likely to look elsewhere, expect single-tenant / working-renter base with shorter leases; 74% free/reduced lunch — lower-income household profile, screen leases tightly.
- Market conditions: Rents rising (+3.5%/yr); 465 active listings in the ZIP; 29 comparable units currently listed for rent nearby; rentals lingering (median 44d on market — plan ~5-8 weeks vacancy on turnover, expect pricing pressure); 55% of comp listings sitting > 30 days — soft ceiling on asking rent; 2,326 units permitted in Cameron County in 2024 (503 in 5+ unit buildings).
Forward outlook
- Local home prices are declining (-3.0%/yr); year-one equity from $657 of loan paydown is wiped out by about $3k of value loss. Plan a longer hold.
- Cameron County population projected at +3% by 2050 — modest demand growth; plan on rents tracking national, not racing it.
Negotiation context
- It's been on market 128 days — a 12% lower offer ($84k) is reasonable based on typical stale-listing flexibility.
Risks & watch-outs
- Climate carrying-cost: severe wind risk, 99% chance of damaging wind over 30y; extreme-heat days projected 7→24/yr by 2055 (HVAC capex compounding) — expect insurance premiums to compound above CPI over the hold.
Questions for the listing agent
- It's been on market 128 days. Have you received any prior offers? Is the seller open to a 12% concession, seller financing, or rate buy-down credit?
- Built in 1960 — when were the roof, HVAC, electrical panel, plumbing, and water heater last replaced?
- Why hasn't it sold? Are there any deal-killer items the seller is aware of (foundation, flood, title, zoning, code violations)?
- Is there a deadline driving the sale (1031 exchange, divorce, estate, relocation)? That informs how much negotiation room exists.
- Schools are D-rated, which usually means shorter tenancies and higher turnover. Who's the typical renter profile here, and what's been the actual vacancy rate?
- What's the average days-on-market for RENTAL listings here right now (not sales)? A rising rental-DOM trend means longer vacancies and softer asking-rent achievability than the comps imply.
- What's the recent tenant-quality profile in this submarket — average credit score on applications, eviction rate, late-payment / NSF rate, and stable-employment percentage? A property-management company in the area should have these aggregated.
- How much new for-sale + rental construction is in the pipeline within 1–3 miles? Heavy new supply typically softens prices + rents 12–24 months out; constrained supply supports both.
Investment metrics
- 1% rule
- 1.07% ✓
- Cap rate
- 7.44%
- Cash-on-cash
- 4.09%
- DSCR
- 1.18
- GRM
- 7.8
CMA / ARV
- ARV (median comp)
- $113,885
- List price
- $95,000
- Delta
- -16.58%
- Verdict
- UNDERPRICED
- Comps
- 13 within 1.0 mi
Show comp detail 1 sale within ~0.75 mi
| Address | Dist | Beds/Ba | Sqft | Sold | Price | $/sf | Match |
|---|---|---|---|---|---|---|---|
| 610 Polk Ave | 0.56mi | 3/1.0 (+1) | 876 (+4%) | 13mo | $129,900 | $148 | 51 |
Match score weights: distance 35% · size 25% · config 20% · recency 20%. Top-matched comps best support the ARV.
Projected returns pro-forma
-3.0% appreciation · 3.45% rent growth · sell at horizon
- IRR
- -9.3%
- Equity multiple
- 0.66×
- Total profit
- $-9,111
- Equity at exit
- $14,165
- IRR
- 0.8%
- Equity multiple
- 1.06×
- Total profit
- $1,617
- Equity at exit
- $8,214
Cash invested: $26,600 (down + closing). Projections, not guarantees.
Landlord ↔ Tenant lean methodology
- Overall (STATE)
- 87 Strongly Landlord-Friendly
- State Texas
- 87 Strongly Landlord-Friendly · R+5
- County
- — inherits STATE
- City
- — inherits STATE
ZIP-level market 78550
- Rents YoY
- 3.5%
- Active inventory
- 465
- Price-to-rent
- 7.8×
Monthly cashflow live
- Estimated rent
- $1,017 high interval (Pro) →
- Mortgage (P&I)
- −$498
- Tax from tax record
- −$175 /mo · $2,105/yr
- Insurance
- −$40
- HOA
- −$0
- Vacancy / Maint / Mgmt
- −$214
- Net cashflow
- $91
Break-even live
Sensitivity live
| Price | -10% $144 | -5% $117 | +0% $91 | +5% $64 | +10% $37 |
|---|---|---|---|---|---|
| Rent | -10% $10 | -5% $50 | +0% $91 | +5% $131 | +10% $171 |
| Rate | -1.0pp $138 | -0.5pp $115 | base $91 | +0.5pp $66 | +1.0pp $41 |
UW: 25.0% down · 7.5% · 30yr · 1.5% tax · 5.0% vac · 8.0% maint · 8.0% mgmt
Financing live
Cash to close
- Down payment
- $23,750
- Closing costs
- $2,850
- Reserves months
- —
- Total cash needed
- —
Loan-product check · same deal, 3 products live
Conventional
25% down · 7.5% · 30yr
- Down + closing
- —
- Monthly P&I
- —
- Monthly cashflow
- —
- DSCR
- —
- Eligible?
- —
Personal DTI + credit; lowest rate.
DSCR
20% down · 8.5% · 30yr
- Down + closing
- —
- Monthly P&I
- —
- Monthly cashflow
- —
- DSCR
- —
- Eligible?
- —
No personal income docs; deal must DSCR.
Hard money
10% down · 12.0% · 12mo
- Down + closing
- —
- Monthly P&I
- —
- Monthly cashflow
- —
- DSCR
- —
- Eligible?
- —
Short-term bridge; refi at stabilization.
Rent comps 29 comps
| Address | Beds | Baths | Sqft | Rent | $/sqft | DOM | Units | Dist |
|---|---|---|---|---|---|---|---|---|
| 501 W Pierce Ave Harlingen, TX | 3.0 | 2.0 | 847 | $950 | $1.12 | 21d | 1 | 0.30mi |
| 1005 W Garfield St Apt C2 Harlingen, TX | 2.0 | 2.0 | 1120 | $995 | $0.89 | 21d | 1 | 0.43mi |
| 619 E Pierce Ave Harlingen, TX | 2.0 | 1.0 | 1000 | $800 | $0.80 | 44d | 1 | 0.68mi |
| 1600 Clinton St Unit 1 Harlingen, TX | 3.0 | 2.0 | 1050 | $1,495 | $1.42 | 44d | 1 | 0.69mi |
| 1604 Clinton St Unit 1 Harlingen, TX | 3.0 | 2.0 | 1050 | $1,495 | $1.42 | 44d | 1 | 0.69mi |
| 1725 Clinton St Unit A Harlingen, TX | 2.0 | 2.0 | 807 | $1,295 | $1.60 | 21d | 1 | 0.75mi |
| 1725 Clinton St Unit A Harlingen, TX | 2.0 | 2.0 | 807 | $1,295 | $1.60 | 44d | 1 | 0.75mi |
| 1704 Clinton St Unit 1 Harlingen, TX | 3.0 | 2.0 | 1010 | $1,495 | $1.48 | 44d | 1 | 0.75mi |
| 1704 Clinton St Unit 2 Harlingen, TX | 2.0 | 2.0 | 1010 | $1,295 | $1.28 | 21d | 1 | 0.75mi |
| 1704 Clinton St Unit 2 Harlingen, TX | 2.0 | 2.0 | 956 | $1,295 | $1.35 | 44d | 1 | 0.75mi |
| 106 S A St Harlingen, TX | 1.0–2.0 | 1.0–2.0 | 877 | $850 | $0.97 | 14d | 3 | 0.80mi |
| 204 S 7th St Harlingen, TX | 2.0 | 1.0 | 713 | $725 | $1.02 | 21d | 1 | 0.93mi |
| 801 W Arroyo Park Ln Unit 2 Harlingen, TX | 1.0 | 1.0 | 700 | $775 | $1.11 | 21d | 1 | 1.00mi |
| 709 E Jackson St Harlingen, TX | 2.0 | 1.0 | 1100 | $1,050 | $0.95 | 14d | 1 | 1.05mi |
| 409 E Madison Ave Unit 4 Harlingen, TX | 2.0 | 1.0 | 770 | $750 | $0.97 | 44d | 1 | 1.07mi |
| 3517 S Arroyo Park Ln Unit 2 Harlingen, TX | 1.0 | 1.0 | 742 | $775 | $1.04 | 45d | 1 | 1.10mi |
| 1501 Sam Houston Dr Apt 6H Harlingen, TX | 2.0 | 1.5 | 1015 | $775 | $0.76 | 44d | 1 | 1.23mi |
| 1501 Sam Houston Dr Harlingen, TX | 1.0 | 1.0 | 752 | $650 | $0.86 | 14d | 1 | 1.23mi |
| 1501 Sam Houston Dr Harlingen, TX | 1.0 | 1.0 | 752 | $650 | $0.86 | 44d | 1 | 1.23mi |
| 225 E New Hampshire St Unit 14 Harlingen, TX | 2.0 | 2.0 | 936 | $1,300 | $1.39 | 21d | 1 | 1.26mi |
| 902 N D St Unit A Harlingen, TX | 3.0 | 2.0 | 850 | $825 | $0.97 | 44d | 1 | 1.39mi |
| 3936 Bourbon St Harlingen, TX | 2.0 | 2.0 | 880 | $750 | $0.85 | 21d | 1 | 1.40mi |
| 602 Scotch St Unit 1 Harlingen, TX | 2.0 | 1.0 | 900 | $600 | $0.67 | 44d | 1 | 1.42mi |
| 602 Scotch St Unit 8 Harlingen, TX | 2.0 | 1.0 | 900 | $650 | $0.72 | 44d | 1 | 1.42mi |
| 602 Scotch St Unit 16 Harlingen, TX | 2.0 | 1.0 | 900 | $600 | $0.67 | 21d | 1 | 1.42mi |
| 504 Rock Cir Unit 1 Harlingen, TX | 2.0 | 1.5 | 1050 | $925 | $0.88 | 21d | 1 | 1.42mi |
| 4402 Glasscock Ave Harlingen, TX | 2.0 | 2.0 | 845 | $895 | $1.06 | 44d | 1 | 1.44mi |
| 917 N 1st St Unit 917 Harlingen, TX | 2.0 | 1.0 | 700 | $770 | $1.10 | 44d | 1 | 1.44mi |
| 1722 Stone Dr Unit 2 Harlingen, TX | 2.0 | 2.5 | 1100 | $1,000 | $0.91 | 44d | 1 | 1.45mi |
Listing history 16 events
-
2026-06-18days on market $95,000 Active 128 DOM
-
2026-06-17days on market $95,000 Active 127 DOM
-
2026-06-16days on market $95,000 Active 126 DOM
-
2026-06-15days on market $95,000 Active 125 DOM
-
2026-06-14days on market $95,000 Active 123 DOM
-
2026-06-10days on market $95,000 Active 120 DOM
-
2026-06-09days on market $95,000 Active 119 DOM
-
2026-06-08days on market $95,000 Active 118 DOM
-
2026-06-07days on market $95,000 Active 117 DOM
-
2026-06-03days on market $95,000 Active 113 DOM
-
2026-06-02days on market $95,000 Active 112 DOM
-
2026-06-01days on market $95,000 Active 111 DOM
-
2026-05-31days on market $95,000 Active 110 DOM
-
2026-05-30days on market $95,000 Active 109 DOM
-
2026-01-19$95,000 Active 513-char remark
Show marketing remark (513 chars)
2-bedroom, 1-bath frame home featuring natural wood floors and laminate flooring. Ideal as a starter home or investment property. Comfortable living room, ample kitchen cabinetry, and well-sized bedrooms. Washer and dryer connections located inside the home. Tenant occupied—24-hour notice required. Tenant is willing to remain, making this a great income-producing opportunity. Conveniently located just minutes from the expressway, offering easy access to grocery shopping, dining, and everyday amenities.
-
2007-05-31soldstatus
ⓘ Source: listings_history table (triggers on properties + properties_extension) + one-shot
backfill from property_details.listing_events for pre-trigger history.
Tax reassessment forecast TX · Resets to sale price
- Current annual tax
- $2,105 · $175/mo
- Projected year-2 tax
- $2,105 · $175/mo
- Expected delta
- $0/yr ($0/mo · 0.0%)
ⓘ Screening estimate from a state-policy table — verify with the county assessor before closing.
Climate risk First Street
- Flood 4/10 Moderate FEMA zone X (unshaded) · 20% chance over 30 yrs
- Wildfire 1/10 Low
- Heat 9/10 Extreme 7 d/yr ≥110°F today · 24 d/yr by 30 yrs out
- Wind 8/10 Severe 99% chance of damaging wind over 30 yrs
- Air quality 1/10 Low 0 unhealthy d/yr today · 0 by 30 yrs out
Nearby sold comps map
Loading sold comps map…
Walkable amenities ~0.75 mi
Loading nearby amenities…
Taxation est. · year 1
- Rental income
- $12,210
- − Mortgage interest
- −$5,321
- − Property taxes
- −$2,105
- − Insurance
- −$475
- − Repairs & maintenance
- −$977
- − Management
- −$977
- − Depreciation
- −$2,764
- Taxable loss
- −$409
- Est. tax savings @ 24.0%
- +$98
- After-tax cash flow
- $1,185/yr
For passive investors: Depreciation is non-cash, so a rental often shows a tax loss while cash-flowing — sheltering income. Rental losses are passive: they offset passive income freely, and up to $25,000/yr can offset ordinary (W-2) income if you actively participate and your MAGI is under $100k (phasing out to $0 by $150k); unused losses carry forward. On sale, claimed depreciation is recaptured at up to 25%, and gains may owe capital-gains tax (a 1031 exchange can defer both). Figures are a year-1 estimate at your 24.0% rate — not tax advice; consult a CPA.
Schools (NCES district)
- District
- Harlingen CISD
- NCES district ID
- 4822530
- Math proficiency
- 25% ▼ -28.00%
- Reading proficiency
- 35% ▼ -11.00%
- Median HH income
- $37,182
- Composite
- 24.94/100
- National rank
- #7566
- State rank
- #647 of 826 in TX
Livability — Harlingen
- Score
- 73/100
- State rank
- #217
- US rank
- #5347
Category grades
Schools grade is shown separately in the Schools card above.
Census & demographics
- Census place
- Harlingen, TX
- County
- Cameron County · 310,734 people
- City population
- 95,667
- Metro
- Brownsville-Harlingen, TX
- Population (ZIP)
- 53,335
- Household income
- $49,007
- Rent vs Own
- Severe rent burden
- 2251.0
Population outlook (Cameron County) Hauer SSP2
- Today (2025)
- 441,603 people
- By 2030
- 448,113 · +1.5%
- By 2040
- 456,385 · +3.3%
- By 2050
- 456,294 · +3.3%
- By 2075
- 423,851 · -4.0%
- By 2100
- 342,787 · -22.4%
Race, ethnicity, and origin ACS 2023
- Neighborhood character
- Predominantly Hispanic (83%)
- Race & ethnicity
- Hispanic / Latino 83% Two or more races 29% White 14% Black 1%
- Hispanic origin (detail)
- Mexican 76%
- Common ancestry
- Italian 1% Lithuanian 1%
- Foreign-born
- 14% · Canada
- Languages at home
- 51% English-only · Spanish 48%
Political lean MEDSL · Cameron
- 2024 margin
- Lean R (+5.8) · D 46.7% · R 52.5%
- 2008→2024 swing
- -34.6pp toward R · 2008: 28.8pp · 2024: -5.8pp
- All cycles
- 2024: R+5.8 2020: D+13.2 2016: D+32.5 2012: D+32.4 2008: D+28.8
Not yet ingested
- Civics
- —
Market trends
- HPI YoY
- ▼ -142.60%
- Current HPI
- 167.7038
- Rent YoY
- ▲ 3.45%
- Metro
- Brownsville-Harlingen, TX
- State GDP YoY
- ▲ 3.95%
- F500 in state
- 110
Industry mix (Fortune 500 HQ in TX)
| Industry | F500 HQs | Revenue |
|---|---|---|
| Energy | 16 | $1,198B |
|
||
| Technology | 5 | $198B |
|
||
| Engineering / Construction | 4 | $72B |
|
||
| Energy Services | 3 | $60B |
|
||
| Utilities | 3 | $41B |
|
||
| Healthcare | 2 | $330B |
|
||
Price history
2 events — show timeline
- 2026-01-19 Listed $95,000 RGVMLS
- 2007-05-31 Sold (Public Records) — Public Records
Property tax history
+10.2%/yrLatest (2025): $2,105 · -3.1% YoY. Source: county tax records.
Cash-flow waterfall
monthlySold comps — $/sqft
last 12 mo · ≤1 miLoading sold comps…