17321 Caudel Rd · Bithlo, FL
Flood risk 1/10 · Minimal
- FEMA flood zone
- X (unshaded)
- Chance of flooding over 30 yrs
- 0.0%
- Est. flood insurance / yr
- $507 – $1,088
Fire risk 5/10 · Moderate
- Est. fire insurance / yr
- $947 – $1,759
Heat risk 9/10 · Severe
- Hot days now (above 107°F)
- 7 days/yr
- Hot days in 30 yrs
- 22 days/yr
Wind risk 10/10 · Severe
- Chance of severe wind over 30 yrs
- 99.0%
Air-quality risk 2/10 · Minimal
- Unhealthy air days now
- 0 days/yr
- Unhealthy air days in 30 yrs
- 1 days/yr
Risk factors via First Street. Map © Google.
Why this score? — see what drove the B- grade
The composite is a weighted blend of 9 inputs, each scored 0–100. Each bar is that input's sub-score; the figure is the points it added to the 100-point composite (weight × sub-score).
- Cash flow +30.0/30.0
- 1% rule +10.0/10.0
- DSCR +10.0/10.0
- ARV discount +7.5/15.0
- Schools +4.1/10.0
- Livability +3.0/5.0
- Rent growth +2.5/5.0
- Condition / age +2.5/5.0
- Appreciation +0.0/10.0
$139,000
🖨 Deal sheet (PDF) 📄 Offer letter ✓ Due diligence
Listing remarks
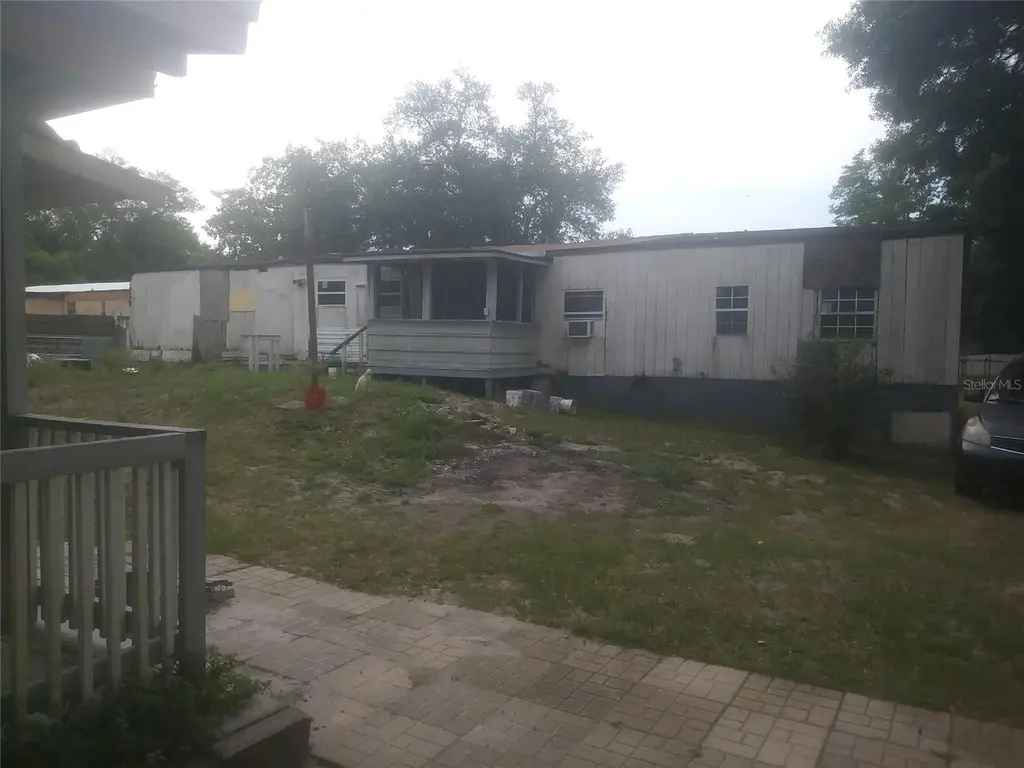
* * Investor Special * * This unique Orlando property features two homes situated on a spacious 0.59-acre lot , offering incredible potential for multi-generational living or rental income. The main residence is a well-maintained 3-bedroom, 2-bathroom ranch built in 2013, featuring a durable brick and frame exterior. While the property currently utilizes well and septic systems, city water hookups are readily available for a convenient future upgrade. Located in a high-demand area with a distress score of 79 , this listing represents a prime opportunity for investors or handy homeowners looking to build significant equity. With a competitive asking price and high value-target characteris
Key facts
- Additional dwelling
- 0.59 acre lot
- Built 1983
Tags
Property features AI
Finance
- Other: Property condition: Fixer; Lot about 0.59 acres (approximately 1/2 to less than 1 acre)
- HOA & community: No association
Exterior
- Utilities: Well water; Septic sewer; Other utilities
- Home design: Residential manufactured home (double wide); One story; South-facing entry
- Construction: Other construction materials; Other roof; Crawlspace foundation; Built as a double wide manufactured home
- Exterior features: Other exterior features; Asphalt road access
Interior
- Kitchen: Other appliances
- Bedrooms: 4 bedrooms
- Flooring: Tile flooring; Other flooring
- Bathrooms: 2 full bathrooms
- Heating & cooling: Other heating; Other cooling
- Interior features: Other interior features
- Laundry & utility: Laundry: Other
Neighborhood map
What this means for you Summary
Snapshot
- This is a 4-bed/2.0-bath single-family listed at $139k.
Deal economics
- At list price, monthly cash flow is $1k ($13k/yr) — positive.
- The deal already cash-flows at list — no discount required.
- Meets the 1% rule at list price ($3k rent vs $139k).
- Recommended offer: $135k (3.0% below list) — sets the bar for market timing.
- Cap rate 15.9% vs local median 2.5% in Bithlo — top-decile yield for the area; either an underpriced asset or a hidden risk that comps aren't pricing in. Stress-test before assuming the spread holds.
Location & tenants
- Location reads 60/100 on livability (#808 in FL) — a middle-class / working-renter tenant base. Strengths: housing A+, crime A, employment A-; Watch: amenities F, commute F, health & safety F.
- Orange (suburban): math 46% / reading 51% proficiency, ranked #43 of 73 in FL (top 59%) — families likely to look elsewhere, expect single-tenant / working-renter base with shorter leases.
- Zoned schools: Columbia Elementary (math 62% / reading 67%, grade B, #525 of 2,144 statewide, top 26%, 509 students, 50% FRL); Corner Lake Middle (math 42% / reading 47%, grade D, #320 of 571 statewide, top 57%, 841 students, 54% FRL); East River High (math 27% / reading 47%, grade F, #340 of 667 statewide, top 52%, 2,050 students, 45% FRL).
- Market conditions: 194 active listings in the ZIP; 7 comparable units currently listed for rent nearby; rentals leasing fast (median 13d on market — plan ~1-2 weeks tenant-placement turnaround); solid renter incomes; 8,053 units permitted in Orange County in 2024 (3,133 in 5+ unit buildings).
- This rent runs 32% of the median local income ($99k/yr) — at the standard rent-burdened threshold; future hikes will face affordability resistance.
Forward outlook
- Local home prices are declining (-3.0%/yr); year-one equity from $961 of loan paydown is wiped out by about $4k of value loss. Plan a longer hold.
- Orange County population projected at +52% by 2050 — long-run rental-demand tailwind backs the buy-and-hold thesis.
- At projected returns (-3.0% appreciation + 3.0% rent growth), your $39k cash investment doubles in ~4 years — after that, you're playing with house money.
Negotiation context
- It's been on market 43 days — a 3% lower offer ($135k) is reasonable based on typical stale-listing flexibility.
- Current owner paid $50k; list at $139k implies a 176% gain — meaningful room to come down on a strong offer.
Risks & watch-outs
- Climate carrying-cost: severe wind risk, 99% chance of damaging wind over 30y; moderate wildfire risk; extreme-heat days projected 7→22/yr by 2055 (HVAC capex compounding) — expect insurance premiums to compound above CPI over the hold.
Questions for the listing agent
- It's been on market 43 days. Have you received any prior offers? Is the seller open to a 3% concession, seller financing, or rate buy-down credit?
- Is there a deadline driving the sale (1031 exchange, divorce, estate, relocation)? That informs how much negotiation room exists.
- Schools are F-rated, which usually means shorter tenancies and higher turnover. Who's the typical renter profile here, and what's been the actual vacancy rate?
- What's the average days-on-market for RENTAL listings here right now (not sales)? A rising rental-DOM trend means longer vacancies and softer asking-rent achievability than the comps imply.
- What's the recent tenant-quality profile in this submarket — average credit score on applications, eviction rate, late-payment / NSF rate, and stable-employment percentage? A property-management company in the area should have these aggregated.
- How much new for-sale + rental construction is in the pipeline within 1–3 miles? Heavy new supply typically softens prices + rents 12–24 months out; constrained supply supports both.
Investment metrics
- 1% rule
- 1.89% ✓
- Cap rate
- 15.92%
- Cash-on-cash
- 34.39%
- DSCR
- 2.53
- GRM
- 4.4
CMA / ARV
No comps found within radius.
Projected returns pro-forma
-3.0% appreciation · 3.0% rent growth · sell at horizon
- IRR
- 29.8%
- Equity multiple
- 2.25×
- Total profit
- $48,545
- Equity at exit
- $20,725
- IRR
- 37.1%
- Equity multiple
- 4.44×
- Total profit
- $133,895
- Equity at exit
- $12,018
Cash invested: $38,920 (down + closing). Projections, not guarantees.
Landlord ↔ Tenant lean methodology
- Overall (STATE)
- 87 Strongly Landlord-Friendly
- State Florida
- 87 Strongly Landlord-Friendly · R+3
- County
- — inherits STATE
- City
- — inherits STATE
ZIP-level market 32833
- Home prices YoY
- -12.9%
- Active inventory
- 194
- Price-to-rent
- 4.4×
Monthly cashflow live
- Estimated rent
- $2,628 high interval (Pro) →
- Mortgage (P&I)
- −$729
- Tax est. 1.5%
- −$174 /mo · $2,085/yr
- Insurance
- −$58
- HOA
- −$0
- Vacancy / Maint / Mgmt
- −$552
- Net cashflow
- $1,115
Break-even live
Sensitivity live
| Price | -10% $1,211 | -5% $1,163 | +0% $1,115 | +5% $1,067 | +10% $1,019 |
|---|---|---|---|---|---|
| Rent | -10% $908 | -5% $1,011 | +0% $1,115 | +5% $1,219 | +10% $1,323 |
| Rate | -1.0pp $1,185 | -0.5pp $1,151 | base $1,115 | +0.5pp $1,079 | +1.0pp $1,043 |
UW: 25.0% down · 7.5% · 30yr · 1.5% tax · 5.0% vac · 8.0% maint · 8.0% mgmt
Financing live
Cash to close
- Down payment
- $34,750
- Closing costs
- $4,170
- Reserves months
- —
- Total cash needed
- —
Loan-product check · same deal, 3 products live
Conventional
25% down · 7.5% · 30yr
- Down + closing
- —
- Monthly P&I
- —
- Monthly cashflow
- —
- DSCR
- —
- Eligible?
- —
Personal DTI + credit; lowest rate.
DSCR
20% down · 8.5% · 30yr
- Down + closing
- —
- Monthly P&I
- —
- Monthly cashflow
- —
- DSCR
- —
- Eligible?
- —
No personal income docs; deal must DSCR.
Hard money
10% down · 12.0% · 12mo
- Down + closing
- —
- Monthly P&I
- —
- Monthly cashflow
- —
- DSCR
- —
- Eligible?
- —
Short-term bridge; refi at stabilization.
Rent comps 7 comps
| Address | Beds | Baths | Sqft | Rent | $/sqft | DOM | Units | Dist |
|---|---|---|---|---|---|---|---|---|
| 16686 Corner Cove Way Orlando, FL | 3.0 | 2.0 | 1632 | $2,400 | $1.47 | 6d | 1 | 0.86mi |
| 2230 Darlin Cir Orlando, FL | 4.0 | 2.0 | 2031 | $2,550 | $1.26 | 25d | 1 | 1.07mi |
| 16918 Corner Hill Ct Orlando, FL | 3.0 | 2.0 | 1617 | $2,399 | $1.48 | 12d | 1 | 1.16mi |
| 1845 Corner Meadow Cir Orlando, FL | 4.0 | 2.0 | 1874 | $2,245 | $1.20 | 6d | 1 | 1.16mi |
| 2351 Holly Pine Cir Orlando, FL | 4.0 | 2.0 | 1836 | $2,500 | $1.36 | 16d | 1 | 1.27mi |
| 18240 Lynbrook Rd Orlando, FL | 3.0 | 2.0 | 1296 | $1,800 | $1.39 | 25d | 1 | 1.39mi |
| 2111 Corner Point Ct Orlando, FL | 4.0 | 2.0 | 1878 | $2,245 | $1.20 | 6d | 1 | 1.43mi |
Listing history 19 events
-
2026-06-21days on market $139,000 Active 43 DOM
-
2026-06-18days on market $139,000 Active 40 DOM
-
2026-06-17days on market $139,000 Active 39 DOM
-
2026-06-16days on market $139,000 Active 38 DOM
-
2026-06-15days on market $139,000 Active 37 DOM
-
2026-06-13days on market $139,000 Active 35 DOM
-
2026-06-13pricedays on market $139,000 Active 34 DOM
-
2026-06-09days on market $165,000 Active 31 DOM
-
2026-06-08days on market $165,000 Active 30 DOM
-
2026-06-07days on market $165,000 Active 29 DOM
-
2026-06-04days on market $165,000 Active 26 DOM
-
2026-06-03days on market $165,000 Active 25 DOM
-
2026-06-02days on market $165,000 Active 24 DOM
-
2026-06-01days on market $165,000 Active 23 DOM
-
2026-05-31days on market $165,000 Active 22 DOM
-
2026-05-09$165,000 Active
-
1992-04-01soldstatus $50,400
-
1985-08-01soldstatus $8,000
-
1983-06-01soldstatus $294,500
ⓘ Source: listings_history table (triggers on properties + properties_extension) + one-shot
backfill from property_details.listing_events for pre-trigger history.
Climate risk First Street
- Flood 1/10 Low FEMA zone X (unshaded) · 0% chance over 30 yrs
- Wildfire 5/10 Major
- Heat 9/10 Extreme 7 d/yr ≥107°F today · 22 d/yr by 30 yrs out
- Wind 10/10 Extreme 99% chance of damaging wind over 30 yrs
- Air quality 2/10 Low 0 unhealthy d/yr today · 1 by 30 yrs out
Nearby sold comps map
Loading sold comps map…
Walkable amenities ~0.75 mi
Loading nearby amenities…
Taxation est. · year 1
- Rental income
- $31,532
- − Mortgage interest
- −$7,786
- − Property taxes
- −$2,085
- − Insurance
- −$695
- − Repairs & maintenance
- −$2,523
- − Management
- −$2,523
- − Depreciation
- −$4,044
- Taxable income
- $11,877
- Est. tax owed @ 24.0%
- −$2,850
- After-tax cash flow
- $10,532/yr
For passive investors: Depreciation is non-cash, so a rental often shows a tax loss while cash-flowing — sheltering income. Rental losses are passive: they offset passive income freely, and up to $25,000/yr can offset ordinary (W-2) income if you actively participate and your MAGI is under $100k (phasing out to $0 by $150k); unused losses carry forward. On sale, claimed depreciation is recaptured at up to 25%, and gains may owe capital-gains tax (a 1031 exchange can defer both). Figures are a year-1 estimate at your 24.0% rate — not tax advice; consult a CPA.
Schools (NCES district)
- District
- Orange
- NCES district ID
- 1201440
- Math proficiency
- 46% ▼ -9.00%
- Reading proficiency
- 51% ▼ -2.00%
- Median HH income
- $49,350
- Composite
- 41.47/100
- National rank
- #3461
- State rank
- #43 of 73 in FL
Livability — Bithlo
- Score
- 60/100
- State rank
- #808
- US rank
- #19212
Category grades
Schools grade is shown separately in the Schools card above.
Census & demographics
- Census place
- Bithlo, FL
- County
- Orange County · 1,471,359 people
- Metro
- Orlando-Kissimmee-Sanford, FL
- Population (ZIP)
- 11,389
- Household income
- $98,733
- Rent vs Own
- Severe rent burden
- 206.0
Population outlook (Orange County) Hauer SSP2
- Today (2025)
- 1,618,226 people
- By 2030
- 1,787,404 · +10.5%
- By 2040
- 2,125,621 · +31.4%
- By 2050
- 2,454,016 · +51.6%
- By 2075
- 3,173,711 · +96.1%
- By 2100
- 3,607,781 · +122.9%
Race, ethnicity, and origin ACS 2023
- Neighborhood character
- Diverse neighborhood (Simpson 0.65)
- Race & ethnicity
- White 51% Hispanic / Latino 26% Black 11% Two or more races 10% Asian 6%
- Hispanic origin (detail)
- Mexican 2% Puerto Rican 16% Cuban 4%
- Common ancestry
- Italian 2% Hispanic 2% Lithuanian 2%
- Foreign-born
- 15% · Canada, Vietnam, Jamaica
- Languages at home
- 75% English-only · Spanish 20% Vietnamese 2% Tagalog/Filipino 2%
Political lean MEDSL · Orange
- 2024 margin
- D (+13.6) · D 56.1% · R 42.5% · Other 1.3%
- 2008→2024 swing
- -5.0pp toward R · 2008: 18.6pp · 2024: 13.6pp
- All cycles
- 2024: D+13.6 2020: D+23.1 2016: D+24.6 2012: D+18.2 2008: D+18.6
Not yet ingested
- Civics
- —
Market trends
- HPI YoY
- ▼ -47.65%
- Current HPI
- 321.412
- Rent YoY
- —
- Metro
- Orlando-Kissimmee-Sanford, FL
- State GDP YoY
- ▲ 3.28%
- F500 in state
- 36
Industry mix (Fortune 500 HQ in FL)
| Industry | F500 HQs | Revenue |
|---|---|---|
| Industrial Technology | 2 | $29B |
|
||
| Insurance | 2 | $17B |
|
||
| Retail | 1 | $60B |
|
||
| Technology Distribution | 1 | $58B |
|
||
| Homebuilding | 1 | $35B |
|
||
| Technology Manufacturing | 1 | $35B |
|
||
Price history
-44.0% since first listed4 events — show timeline
- 2026-05-09 Listed $165,000 Stellar MLS as Distributed by MLS Grid
- 1992-04-01 Sold (Public Records) $50,400 Public Records
- 1985-08-01 Sold (Public Records) $8,000 Public Records
- 1983-06-01 Sold (Public Records) $294,500 Public Records
Property tax history
+27.3%/yrLatest (2025): $10,182 · +10.8% YoY. Source: county tax records.
Cash-flow waterfall
monthlySold comps — $/sqft
last 12 mo · ≤1 miLoading sold comps…