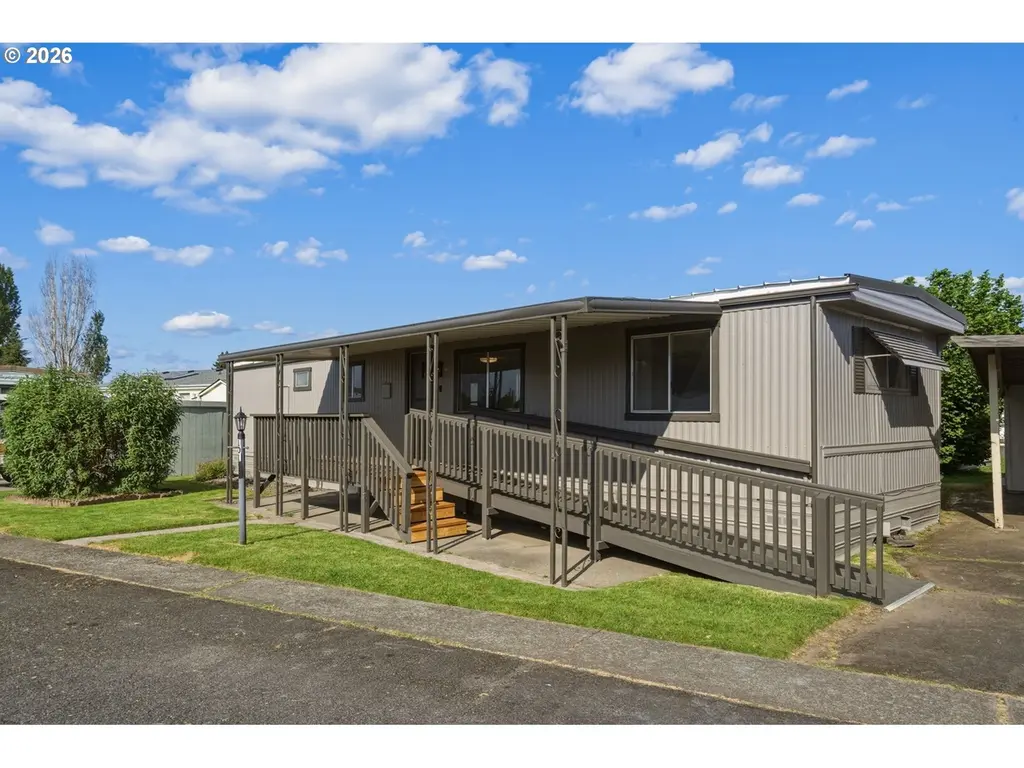
1709 NE 78th St #101 · Hazel Dell, WA
Flood risk No data
- FEMA flood zone
- —
- Chance of flooding over 30 yrs
- —
- Est. flood insurance / yr
- —
Fire risk No data
- Est. fire insurance / yr
- —
Heat risk No data
- Hot days now (above threshold)
- —
- Hot days in 30 yrs
- —
Wind risk No data
- Chance of severe wind over 30 yrs
- —
Air-quality risk No data
- Unhealthy air days now
- —
- Unhealthy air days in 30 yrs
- —
Risk factors via First Street. Map © Google.
Why this score? — see what drove the C+ grade
The composite is a weighted blend of 9 inputs, each scored 0–100. Each bar is that input's sub-score; the figure is the points it added to the 100-point composite (weight × sub-score).
- Cash flow +30.0/30.0
- 1% rule +10.0/10.0
- DSCR +10.0/10.0
- Schools +4.3/10.0
- Livability +4.1/5.0
- Rent growth +3.0/5.0
- Condition / age +2.5/5.0
- ARV discount +0.0/15.0
- Appreciation +0.0/10.0
$64,900
🖨 Deal sheet 📄 Offer letter ✓ Due diligence
Listing remarks
Beautifully updated and move-in ready, this ADA-accessible home blends modern comfort with the warmth of a true community. Fresh flooring and paint, updated fixtures, and a bright, open layout make everyday living easy. Two parking spaces (one covered) and a storage shed are included. Located just steps from the clubhouse, residents enjoy monthly potlucks, weekly coffee & donuts, fitness activities, billiards, a dog park, bocce, horseshoes, and seasonal community events. The clubhouse also features a commercial-style kitchen, coffee bar, ADA restrooms, and free private event reservations. A new fitness room is coming later this year, and the park is currently offering a $1,200 move-in
Key facts
- Dog park
- Clubhouse
- Storage shed
Tags
Property features AI
Finance
- Other: Unit dimensions approximately 51' x 14'
- Financial info: Monthly lot rent $1,200
- HOA & community: Part of CC Hazel Dell MHC; Community amenities include commons, laundry room, library, grounds maintenance, on-site management, meeting room, party room, and recreation facilities; Senior community; Pet restrictions: service/companion animals only
Exterior
- Parking: Carport; Driveway; One parking space (carport)
- Utilities: Electric hot water; Electric fuel; Public water; Public sewer; Cable internet available
- Home design: Manufactured home in park (not attached); One story; Model 56/14ST; Faces unspecified
- Construction: Built in 1974; Skirting foundation
- Exterior features: Covered deck; Tool shed; Yard; Aluminum exterior; Level lot; Paved road access
Interior
- Kitchen: Free-standing range; Free-standing refrigerator; Range hood; Solid surface countertops; Wood floors in kitchen
- Bedrooms: Primary bedroom on main with built-in features; Second bedroom on main
- Flooring: Luxury vinyl plank; Wall-to-wall carpet; Wood floors in living areas
- Bathrooms: One full bathroom on main; Walk-in shower
- Heating & cooling: Forced air heating; No central air
- Interior features: Accessible approach with ramp; Accessible entrance; Main floor bedroom with bath; One-level living; Utility room on main; Walk-in shower; Laundry area; Luxury vinyl plank flooring; Wall-to-wall carpet; Washer and dryer included; Electric fireplace; Vinyl window frames
- Laundry & utility: Washer and dryer in utility room (main level)
Neighborhood map
What this means for you Summary
Snapshot
- This is a 2-bed/2.0-bath manufactured listed at $65k.
Deal economics
- At list price, monthly cash flow is $825 ($10k/yr) — positive.
- The deal already cash-flows at list — no discount required.
- Meets the 1% rule at list price ($2k rent vs $65k).
- Recommended offer: $63k (3.0% below list) — sets the bar for market timing.
- Cap rate 21.6% vs local median 3.2% in Hazel Dell — top-decile yield for the area; either an underpriced asset or a hidden risk that comps aren't pricing in. Stress-test before assuming the spread holds.
Location & tenants
- Location reads 82/100 on livability (#67 in WA, #1,216 nationally) — a professional / high-income tenant draw. Strengths: amenities A+, commute A+, housing A+; Watch: crime D+, cost of living D.
- Vancouver School District (suburban): math 43% / reading 53% proficiency, ranked #156 of 291 in WA (top 54%) — families likely to look elsewhere, expect single-tenant / working-renter base with shorter leases.
- Zoned schools: Hazel Dell Elementary School (392 students, 67% FRL); Jason Lee Middle School (532 students, 59% FRL); Hudson'S Bay High School (1,143 students, 64% FRL) — zoned schools average 63% FRL vs 44% district-wide (19 pts higher); higher-poverty schools than district average — tighter screening recommended.
- Market conditions: Rents rising (+2.0%/yr); 187 active listings in the ZIP; 29 comparable units currently listed for rent nearby; rentals leasing fast (median 13d on market — plan ~1-2 weeks tenant-placement turnaround); solid renter incomes; 3,547 units permitted in Clark County in 2024 (1,361 in 5+ unit buildings).
Forward outlook
- Local home prices are declining (-3.0%/yr); year-one equity from $449 of loan paydown is wiped out by about $2k of value loss. Plan a longer hold.
- Clark County population projected at +29% by 2050 — long-run rental-demand tailwind backs the buy-and-hold thesis.
- At projected returns (-3.0% appreciation + 2.0% rent growth), your $18k cash investment doubles in ~3 years — after that, you're playing with house money.
Negotiation context
- It's been on market 35 days — a 3% lower offer ($63k) is reasonable based on typical stale-listing flexibility.
Questions for the listing agent
- It's been on market 35 days. Have you received any prior offers? Is the seller open to a 3% concession, seller financing, or rate buy-down credit?
- Built in 1974 — when were the roof, HVAC, electrical panel, plumbing, and water heater last replaced?
- Is there a deadline driving the sale (1031 exchange, divorce, estate, relocation)? That informs how much negotiation room exists.
- Schools are F-rated, which usually means shorter tenancies and higher turnover. Who's the typical renter profile here, and what's been the actual vacancy rate?
- Crime grade is D in this area — have there been break-ins, vandalism, or insurance claims at this property in the last 3 years? What carrier currently insures it and at what premium?
- What's the average days-on-market for RENTAL listings here right now (not sales)? A rising rental-DOM trend means longer vacancies and softer asking-rent achievability than the comps imply.
- What's the recent tenant-quality profile in this submarket — average credit score on applications, eviction rate, late-payment / NSF rate, and stable-employment percentage? A property-management company in the area should have these aggregated.
- How much new for-sale + rental construction is in the pipeline within 1–3 miles? Heavy new supply typically softens prices + rents 12–24 months out; constrained supply supports both.
Investment metrics
- 1% rule
- 2.48% ✓
- Cap rate
- 21.55%
- Cash-on-cash
- 54.49%
- DSCR
- 3.42
- GRM
- 3.4
CMA / ARV
- ARV (median comp)
- $49,141
- List price
- $64,900
- Delta
- 32.07%
- Verdict
- OVERPRICED
- Comps
- 4 within 1.0 mi
Show comp detail 7 sales within ~0.75 mi
| Address | Dist | Beds/Ba | Sqft | Sold | Price | $/sf | Match |
|---|---|---|---|---|---|---|---|
| 1709 NE 78th St #30 | 0.00mi | 2/1.0 | 773 (+8%) | 15mo | $49,000 | $63 | 71 |
| 1004 NE 72nd St | 0.36mi | 1/1.0 (-1) | 714 (-1%) | 4mo | $29,000 | $41 | 70 |
| 1004 NE 72nd St #56 | 0.36mi | 1/1.0 (-1) | 714 (-1%) | 4mo | $29,000 | $41 | 70 |
| 1004 NE 72nd St #31 | 0.36mi | 2/1.0 | 784 (+9%) | 9mo | $69,000 | $88 | 57 |
| 1004 NE 72nd St #51 | 0.36mi | 2/1.0 | 694 (-3%) | 24mo | $45,500 | $66 | 54 |
| 1004 NE 72nd St #22 | 0.36mi | 2/1.0 | 784 (+9%) | 17mo | $118,000 | $151 | 50 |
| 1004 NE 72nd St #55 | 0.36mi | 2/1.0 | 616 (-14%) | 22mo | $55,000 | $89 | 38 |
Match score weights: distance 35% · size 25% · config 20% · recency 20%. Top-matched comps best support the ARV.
Projected returns pro-forma
-3.0% appreciation · 2.0% rent growth · sell at horizon
- IRR
- 51.6%
- Equity multiple
- 3.23×
- Total profit
- $40,458
- Equity at exit
- $9,677
- IRR
- 56.5%
- Equity multiple
- 6.31×
- Total profit
- $96,544
- Equity at exit
- $5,611
Cash invested: $18,172 (down + closing). Projections, not guarantees.
Landlord ↔ Tenant lean methodology
- Overall (STATE)
- 28 Tenant-Leaning
- State Washington
- 28 Tenant-Leaning · D+8
- County
- — inherits STATE
- City
- — inherits STATE
ZIP-level market 98665
- Rents YoY
- 2.0%
- Active inventory
- 187
- Price-to-rent
- 3.4×
Monthly cashflow live
- Estimated rent
- $1,612 high interval (Pro) →
- Mortgage (P&I)
- −$340
- Tax est. 1.5%
- −$81 /mo · $974/yr
- Insurance
- −$27
- HOA
- −$0
- Vacancy / Maint / Mgmt
- −$339
- Net cashflow
- $825
Break-even live
UW: 25.0% down · 7.5% · 30yr · 1.5% tax · 5.0% vac · 8.0% maint · 8.0% mgmt
Financing live
Cash to close
- Down payment
- $16,225
- Closing costs
- $1,947
- Reserves months
- —
- Total cash needed
- —
Loan-product check · same deal, 3 products live
Conventional
25% down · 7.5% · 30yr
- Down + closing
- —
- Monthly P&I
- —
- Monthly cashflow
- —
- DSCR
- —
- Eligible?
- —
Personal DTI + credit; lowest rate.
DSCR
20% down · 8.5% · 30yr
- Down + closing
- —
- Monthly P&I
- —
- Monthly cashflow
- —
- DSCR
- —
- Eligible?
- —
No personal income docs; deal must DSCR.
Hard money
10% down · 12.0% · 12mo
- Down + closing
- —
- Monthly P&I
- —
- Monthly cashflow
- —
- DSCR
- —
- Eligible?
- —
Short-term bridge; refi at stabilization.
Rent comps 29 comps
| Address | Beds | Baths | Sqft | Rent | $/sqft | DOM | Units | Dist |
|---|---|---|---|---|---|---|---|---|
| 7900 NE 18th Ave Vancouver, WA | 1.0–3.0 | 1.0 | 755 | $1,408 | $1.86 | 2d | 4 | 0.20mi |
| 8005 NE 13th Ave Vancouver, WA | 1.0–2.0 | 1.0–2.0 | 849 | $2,045 | $2.41 | 8d | 14 | 0.24mi |
| 8003 NE 13th Ave Vancouver, WA | 1.0–2.0 | 1.0–2.0 | 845 | $2,045 | $2.42 | 8d | 16 | 0.32mi |
| 2301 NE 81st St Vancouver, WA | 1.0–3.0 | 1.0–2.0 | 1080 | $1,975 | $1.83 | 2d | 10 | 0.34mi |
| 8105 NE 13th Ave Vancouver, WA | 1.0 | 1.0 | 550 | $1,295 | $2.35 | 16d | 1 | 0.35mi |
| 8208 NE 13th Ave Vancouver, WA | 2.0 | 1.0 | 750 | $1,450 | $1.93 | 23d | 1 | 0.43mi |
| 1106 NE 83rd St Vancouver, WA | 1.0–3.0 | 1.0–2.5 | 1058 | $1,932 | $1.83 | 20d | 1 | 0.50mi |
| 1405 NE 88th St Vancouver, WA | 1.0 | 1.0 | 733 | $1,550 | $2.11 | 23d | 1 | 0.59mi |
| 1008 NE 86th St Vancouver, WA | 2.0 | 1.0 | 700 | $1,395 | $1.99 | 23d | 1 | 0.68mi |
| 928 NE 86th St Vancouver, WA | 2.0 | 1.0 | 700 | $1,250 | $1.79 | 10d | 1 | 0.69mi |
| 932 NE 86th St Vancouver, WA | 2.0 | 1.0 | 700 | $1,295 | $1.85 | 23d | 1 | 0.69mi |
| 900 NE Minnehaha St Vancouver, WA | 1.0 | 1.0 | 648 | $1,249 | $1.93 | 2d | 12 | 0.70mi |
| 9100 NE 15th Ave Apt 13 Vancouver, WA | 1.0 | 1.0 | 576 | $1,150 | $2.00 | 22d | 1 | 0.77mi |
| 9100 NE 15th Ave Apt 17 Vancouver, WA | 1.0 | 1.0 | 576 | $1,095 | $1.90 | 23d | 1 | 0.77mi |
| 9100 NE 15th Ave Unit 16 Vancouver, WA | 1.0 | 1.0 | 576 | $1,095 | $1.90 | 15d | 1 | 0.77mi |
| 9211 NE 15th Ave Vancouver, WA | 1.0–3.0 | 1.0–2.0 | 900 | $1,649 | $1.83 | 2d | 22 | 0.83mi |
| 8500 NE Hazel Dell Ave Vancouver, WA | 1.0–2.0 | 1.0–2.0 | 837 | $1,675 | $2.00 | 10d | 2 | 0.92mi |
| 9501 NE 19th Ave Vancouver, WA | 1.0–2.0 | 1.0–2.5 | 844 | $2,099 | $2.49 | 3d | 20 | 0.94mi |
| 7714 NE 39th Ct Vancouver, WA | 1.0–2.0 | 1.0–2.0 | 921 | $2,035 | $2.21 | 2d | 12 | 1.04mi |
| 9917 NE 13th Ave Vancouver, WA | 2.0 | 1.0 | 707 | $1,645 | $2.33 | 3d | 4 | 1.15mi |
| 10117 NE 9th Ave Vancouver, WA | 1.0–2.0 | 1.0–2.0 | 790 | $1,470 | $1.86 | 2d | 8 | 1.30mi |
| 10223 NE Notchlog Dr Vancouver, WA | 2.0 | 1.0 | 665 | $1,646 | $2.48 | 8d | 1 | 1.39mi |
| 3504 NE 54th St Vancouver, WA | 1.0 | 1.0 | 737 | $1,295 | $1.76 | 23d | 1 | 1.40mi |
| 5009 NE Hazel Dell Ave Vancouver, WA | 1.0 | 1.0 | 700 | $1,395 | $1.99 | 23d | 1 | 1.43mi |
| 5009 NE Hazel Dell Ave Vancouver, WA | 2.0 | 1.0 | 700 | $1,400 | $2.00 | 12d | 1 | 1.43mi |
| 5009 NE Hazel Dell Ave Unit 10 Vancouver, WA | 1.0 | 1.0 | 700 | $1,345 | $1.92 | 23d | 1 | 1.43mi |
| 1115 NE 105th St Vancouver, WA | 1.0–2.0 | 1.0–2.0 | 835 | $1,615 | $1.93 | 8d | 6 | 1.44mi |
| 5009 NE Hazel Dell Ave Unit 4 Vancouver, WA | 1.0 | 1.0 | 675 | $1,250 | $1.85 | 23d | 1 | 1.44mi |
| 5009 NE Hazel Dell Ave Unit 2 Vancouver, WA | 2.0 | 1.0 | 700 | $1,400 | $2.00 | 16d | 1 | 1.44mi |
Listing history 13 events
-
2026-06-18days on market $64,900 Active 35 DOM
-
2026-06-17days on market $64,900 Active 34 DOM
-
2026-06-16days on market $64,900 Active 33 DOM
-
2026-06-15days on market $64,900 Active 32 DOM
-
2026-06-13days on market $64,900 Active 30 DOM
-
2026-06-09days on market $64,900 Active 26 DOM
-
2026-06-08days on market $64,900 Active 25 DOM
-
2026-06-07days on market $64,900 Active 24 DOM
-
2026-06-03days on market $64,900 Active 20 DOM
-
2026-06-02days on market $64,900 Active 19 DOM
-
2026-06-01days on market $64,900 Active 18 DOM
-
2026-05-31days on market $64,900 Active 17 DOM
-
2026-05-14$64,900 Active 809-char remark
ⓘ Source: listings_history table (triggers on properties + properties_extension) + one-shot
backfill from property_details.listing_events for pre-trigger history.
Nearby sold comps map
Loading sold comps map…
Walkable amenities ~0.75 mi
Loading nearby amenities…
Taxation est. · year 1
- Rental income
- $19,347
- − Mortgage interest
- −$3,635
- − Property taxes
- −$974
- − Insurance
- −$324
- − Repairs & maintenance
- −$1,548
- − Management
- −$1,548
- − Depreciation
- −$1,888
- Taxable income
- $9,430
- Est. tax owed @ 24.0%
- −$2,263
- After-tax cash flow
- $7,639/yr
For passive investors: Depreciation is non-cash, so a rental often shows a tax loss while cash-flowing — sheltering income. Rental losses are passive: they offset passive income freely, and up to $25,000/yr can offset ordinary (W-2) income if you actively participate and your MAGI is under $100k (phasing out to $0 by $150k); unused losses carry forward. On sale, claimed depreciation is recaptured at up to 25%, and gains may owe capital-gains tax (a 1031 exchange can defer both). Figures are a year-1 estimate at your 24.0% rate — not tax advice; consult a CPA.
Schools (NCES district)
- District
- Vancouver School District
- NCES district ID
- 5309270
- Math proficiency
- 43% ▬ 0.00%
- Reading proficiency
- 53% ▬ 0.00%
- Median HH income
- $52,562
- Composite
- 43.45/100
- National rank
- #6479
- State rank
- #156 of 291 in WA
Livability — Hazel Dell
- Score
- 82/100
- State rank
- #67
- US rank
- #1216
Category grades
Schools grade is shown separately in the Schools card above.
Census & demographics
- Census place
- Hazel Dell, WA
- County
- Clark County · 513,189 people
- City population
- 28,243
- Metro
- Portland-Vancouver-Hillsboro, OR-WA
- Population (ZIP)
- 28,910
- Household income
- $88,559
- Rent vs Own
- Severe rent burden
- 1070.0
Population outlook (Clark County) Hauer SSP2
- Today (2025)
- 529,610 people
- By 2030
- 563,242 · +6.4%
- By 2040
- 625,905 · +18.2%
- By 2050
- 681,558 · +28.7%
- By 2075
- 805,967 · +52.2%
- By 2100
- 877,450 · +65.7%
Race, ethnicity, and origin ACS 2023
- Neighborhood character
- Predominantly White (70%)
- Race & ethnicity
- White 70% Hispanic / Latino 14% Two or more races 11% Asian 5% Black 3%
- Hispanic origin (detail)
- Mexican 12%
- Common ancestry
- Portuguese 5% Italian 4% Slovak 3%
- Foreign-born
- 12% · Canada, China
- Languages at home
- 80% English-only · Spanish 9% Russian/Polish/Slavic 3% Other Asian/Pacific 2%
Political lean MEDSL · Clark
- 2024 margin
- Lean D (+7.0) · D 52.1% · R 45.1% · Other 2.8%
- 2008→2024 swing
- +0.9pp no change · 2008: 6.1pp · 2024: 7.0pp
- All cycles
- 2024: D+7.0 2020: D+5.1 2016: D+0.1 2012: D+0.1 2008: D+6.1
Not yet ingested
- Civics
- —
Market trends
- HPI YoY
- ▼ -274.20%
- Current HPI
- 303.1342
- Rent YoY
- ▲ 2.00%
- Metro
- Portland-Vancouver-Hillsboro, OR-WA
- State GDP YoY
- ▲ 4.65%
- F500 in state
- 22
Industry mix (Fortune 500 HQ in WA)
| Industry | F500 HQs | Revenue |
|---|---|---|
| Retail | 2 | $269B |
|
||
| Technology / Retail | 1 | $638B |
|
||
| Technology | 1 | $245B |
|
||
| Telecommunications | 1 | $38B |
|
||
| Food / Beverage | 1 | $36B |
|
||
| Automotive / Trucks | 1 | $34B |
|
||
Price history
1 event — show timeline
- 2026-05-14 Listed $64,900 RMLS
Property tax history
+14.4%/yrLatest (2026): $104 · +51.5% YoY. Source: county tax records.
Cash-flow waterfall
monthlySold comps — $/sqft
last 12 mo · ≤1 miLoading sold comps…