321 Crawford Rd · Columbia, SC
Flood risk 1/10 · Minimal
- FEMA flood zone
- X (unshaded)
- Chance of flooding over 30 yrs
- 0.0%
- Est. flood insurance / yr
- $507 – $1,088
Fire risk 3/10 · Minor
- Est. fire insurance / yr
- $783 – $1,453
Heat risk 6/10 · Moderate
- Hot days now (above 108°F)
- 7 days/yr
- Hot days in 30 yrs
- 16 days/yr
Wind risk 6/10 · Moderate
- Chance of severe wind over 30 yrs
- 65.0%
Air-quality risk 3/10 · Minor
- Unhealthy air days now
- 2 days/yr
- Unhealthy air days in 30 yrs
- 2 days/yr
Risk factors via First Street. Map © Google.
Why this score? — see what drove the C grade
The composite is a weighted blend of 9 inputs, each scored 0–100. Each bar is that input's sub-score; the figure is the points it added to the 100-point composite (weight × sub-score).
- Cash flow +21.7/30.0
- ARV discount +7.5/15.0
- DSCR +6.9/10.0
- 1% rule +6.3/10.0
- Appreciation +5.0/10.0
- Livability +3.9/5.0
- Schools +2.6/10.0
- Rent growth +2.5/5.0
- Condition / age +2.5/5.0
$119,000
🖨 Deal sheet 📄 Offer letter ✓ Due diligence
Listing remarks
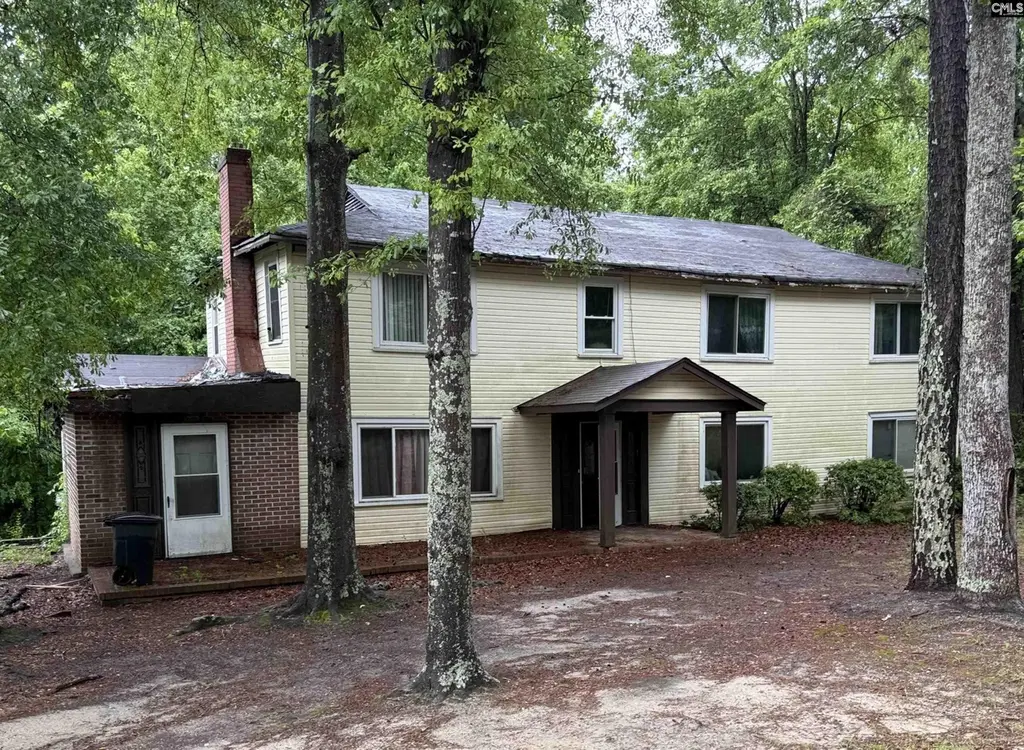
Attention investors and savvy buyers — don't miss this rare opportunity to own a high-bedroom-count property with incredible income potential! This 9-bedroom, 2-full-bathroom home at 321 Crawford Rd offers an exceptional canvas for the right buyer looking to maximize returns in the growing Columbia, SC market. With nine bedrooms, this is perfectly suited for a group home, transitional housing, student housing, or a large rental conversion. The expansive lot provides ample outdoor space and potential for future improvements, additions, or simply extra breathing room that's hard to find at this price point. Being sold as-is, this fixer-upper is priced to reflect its current condition &m
Key facts
- 0.84 acre lot
- Built 1949
- Listed 22 days
Property features AI
Exterior
- Utilities: Public water; Public sewer
- Home design: Two-story home
- Construction: Crawlspace foundation
- Exterior features: Vinyl exterior finish; Paved road access; 0.84-acre lot
Interior
- Bedrooms: Master bedroom on the second level
- Bathrooms: Two full bathrooms (one main full bath, one second full bath)
- Heating & cooling: Central heating; Central cooling
- Interior features: One fireplace; Total heated area 2,512
Neighborhood map
What this means for you Summary
Snapshot
- This is a 10-bed/2.0-bath single-family listed at $119k.
Deal economics
- At list price, monthly cash flow is $183 ($2k/yr) — positive.
- The deal already cash-flows at list — no discount required.
- Meets the 1% rule at list price ($1k rent vs $119k).
- Recommended offer: $117k (1.5% below list) — sets the bar for market timing.
Location & tenants
- Location reads 78/100 on livability (#18 in SC, #2,436 nationally) — a middle-class / working-renter tenant base. Strengths: amenities A+, commute A+, cost of living A+; Watch: employment D, crime F.
- Richland 01 (urban): math 26% / reading 36% proficiency, ranked #54 of 80 in SC (top 68%) — families likely to look elsewhere, expect single-tenant / working-renter base with shorter leases; 64% free/reduced lunch — lower-income household profile, screen leases tightly.
- Zoned schools: W.J. Keenan High (math 54% / reading 77%, grade B, #83 of 196 statewide, top 43%, 725 students, 100% FRL) — zoned schools average 100% FRL vs 64% district-wide (36 pts higher); higher-poverty schools than district average — tighter screening recommended.
- Zoned-school proficiency averages 66% at this address vs 31% district-wide (+35 pts) — the actual schools serving this property are materially stronger than the Richland 01 average implies; a family-tenant draw the district grade alone would hide.
- Market conditions: 1 active listings in the ZIP; 3,472 units permitted in Richland County in 2024 (1,096 in 5+ unit buildings).
Forward outlook
- In year one you build about $4k of equity ($823 loan paydown + $4k appreciation (3.0% local appreciation)).
- Richland County population projected at +30% by 2050 — long-run rental-demand tailwind backs the buy-and-hold thesis.
- At projected returns (3.0% appreciation + 3.0% rent growth), your $33k cash investment doubles in ~5 years — after that, you're playing with house money.
- By year 8, paydown + projected appreciation supports a ~$32k cash-out refi (75% LTV) — recoverable capital for the next deal without selling this one.
Negotiation context
- It's been on market 22 days — a 2% lower offer ($117k) is reasonable based on typical stale-listing flexibility.
- Current owner paid $36k; list at $119k implies a 231% gain — meaningful room to come down on a strong offer.
Risks & watch-outs
- Watch-outs: built in 1949 — expect roof / HVAC / electrical / plumbing capex.
- Climate carrying-cost: major wind risk, 65% chance of damaging wind over 30y; extreme-heat days projected 7→16/yr by 2055 (HVAC capex compounding) — expect insurance premiums to compound above CPI over the hold.
Questions for the listing agent
- Built in 1949 — when were the roof, HVAC, electrical panel, plumbing, and water heater last replaced?
- Is there a deadline driving the sale (1031 exchange, divorce, estate, relocation)? That informs how much negotiation room exists.
- Schools are D-rated, which usually means shorter tenancies and higher turnover. Who's the typical renter profile here, and what's been the actual vacancy rate?
- Crime grade is F in this area — have there been break-ins, vandalism, or insurance claims at this property in the last 3 years? What carrier currently insures it and at what premium?
- What's the average days-on-market for RENTAL listings here right now (not sales)? A rising rental-DOM trend means longer vacancies and softer asking-rent achievability than the comps imply.
- What's the recent tenant-quality profile in this submarket — average credit score on applications, eviction rate, late-payment / NSF rate, and stable-employment percentage? A property-management company in the area should have these aggregated.
- How much new for-sale + rental construction is in the pipeline within 1–3 miles? Heavy new supply typically softens prices + rents 12–24 months out; constrained supply supports both.
Investment metrics
- 1% rule
- 1.13% ✓
- Cap rate
- 8.14%
- Cash-on-cash
- 6.58%
- DSCR
- 1.29
- GRM
- 7.4
CMA / ARV
No comps found within radius.
Projected returns pro-forma
3.0% appreciation · 3.0% rent growth · sell at horizon
- IRR
- 13.7%
- Equity multiple
- 1.78×
- Total profit
- $26,032
- Equity at exit
- $53,508
- IRR
- 15.6%
- Equity multiple
- 3.29×
- Total profit
- $76,455
- Equity at exit
- $82,462
Cash invested: $33,320 (down + closing). Projections, not guarantees.
Landlord ↔ Tenant lean methodology
- Overall (STATE)
- 90 Strongly Landlord-Friendly
- State South Carolina
- 90 Strongly Landlord-Friendly · R+6
- County
- — inherits STATE
- City
- — inherits STATE
ZIP-level market 29203-2736
- Active inventory
- 1
- Price-to-rent
- 7.4×
Monthly cashflow live
- Estimated rent
- $1,347 medium interval (Pro) →
- Mortgage (P&I)
- −$624
- Tax from tax record
- −$208 /mo · $2,492/yr
- Insurance
- −$50
- HOA
- −$0
- Vacancy / Maint / Mgmt
- −$283
- Net cashflow
- $183
Break-even live
UW: 25.0% down · 7.5% · 30yr · 1.5% tax · 5.0% vac · 8.0% maint · 8.0% mgmt
Financing live
Cash to close
- Down payment
- $29,750
- Closing costs
- $3,570
- Reserves months
- —
- Total cash needed
- —
Loan-product check · same deal, 3 products live
Conventional
25% down · 7.5% · 30yr
- Down + closing
- —
- Monthly P&I
- —
- Monthly cashflow
- —
- DSCR
- —
- Eligible?
- —
Personal DTI + credit; lowest rate.
DSCR
20% down · 8.5% · 30yr
- Down + closing
- —
- Monthly P&I
- —
- Monthly cashflow
- —
- DSCR
- —
- Eligible?
- —
No personal income docs; deal must DSCR.
Hard money
10% down · 12.0% · 12mo
- Down + closing
- —
- Monthly P&I
- —
- Monthly cashflow
- —
- DSCR
- —
- Eligible?
- —
Short-term bridge; refi at stabilization.
Listing history 15 events
-
2026-06-18days on market $119,000 Active 22 DOM
-
2026-06-17days on market $119,000 Active 21 DOM
-
2026-06-16days on market $119,000 Active 20 DOM
-
2026-06-15days on market $119,000 Active 19 DOM
-
2026-06-14days on market $119,000 Active 17 DOM
-
2026-06-10days on market $119,000 Active 14 DOM
-
2026-06-09days on market $119,000 Active 13 DOM
-
2026-06-08days on market $119,000 Active 12 DOM
-
2026-06-07days on market $119,000 Active 11 DOM
-
2026-06-03days on market $119,000 Active 7 DOM
-
2026-06-03days on market $119,000 Active 6 DOM
-
2026-06-01days on market $119,000 Active 5 DOM
-
2026-05-31days on market $119,000 Active 4 DOM
-
2026-05-26$119,000 Active
-
2000-01-04soldstatus $36,000
ⓘ Source: listings_history table (triggers on properties + properties_extension) + one-shot
backfill from property_details.listing_events for pre-trigger history.
Tax reassessment forecast SC · Resets to sale price
- Current annual tax
- $2,492 · $208/mo
- Projected year-2 tax
- $2,492 · $208/mo
- Expected delta
- $0/yr ($0/mo · 0.0%)
ⓘ Screening estimate from a state-policy table — verify with the county assessor before closing.
Climate risk First Street
- Flood 1/10 Low FEMA zone X (unshaded) · 0% chance over 30 yrs
- Wildfire 3/10 Moderate
- Heat 6/10 Major 7 d/yr ≥108°F today · 16 d/yr by 30 yrs out
- Wind 6/10 Major 65% chance of damaging wind over 30 yrs
- Air quality 3/10 Moderate 2 unhealthy d/yr today · 2 by 30 yrs out
Nearby sold comps map
Loading sold comps map…
Walkable amenities ~0.75 mi
Loading nearby amenities…
Taxation est. · year 1
- Rental income
- $16,163
- − Mortgage interest
- −$6,666
- − Property taxes
- −$2,492
- − Insurance
- −$595
- − Repairs & maintenance
- −$1,293
- − Management
- −$1,293
- − Depreciation
- −$3,462
- Taxable income
- $362
- Est. tax owed @ 24.0%
- −$87
- After-tax cash flow
- $2,106/yr
For passive investors: Depreciation is non-cash, so a rental often shows a tax loss while cash-flowing — sheltering income. Rental losses are passive: they offset passive income freely, and up to $25,000/yr can offset ordinary (W-2) income if you actively participate and your MAGI is under $100k (phasing out to $0 by $150k); unused losses carry forward. On sale, claimed depreciation is recaptured at up to 25%, and gains may owe capital-gains tax (a 1031 exchange can defer both). Figures are a year-1 estimate at your 24.0% rate — not tax advice; consult a CPA.
Schools (NCES district)
- District
- Richland 01
- NCES district ID
- 4503360
- Math proficiency
- 26% ▼ -7.00%
- Reading proficiency
- 36% ▼ -5.00%
- Median HH income
- $38,931
- Composite
- 25.94/100
- National rank
- #7335
- State rank
- #54 of 80 in SC
Livability — Columbia
- Score
- 78/100
- State rank
- #18
- US rank
- #2436
Category grades
Schools grade is shown separately in the Schools card above.
Census & demographics
No demographic data for this ZIP.
Market trends
- HPI YoY
- —
- Current HPI
- —
- Rent YoY
- —
- Metro
- —
- State GDP YoY
- ▲ 4.51%
- F500 in state
- 2
Industry mix (Fortune 500 HQ in SC)
| Industry | F500 HQs | Revenue |
|---|---|---|
| Packaging | 1 | $7B |
|
||
Price history
+230.6% since first listed2 events — show timeline
- 2026-05-26 Listed $119,000 Consolidated MLS
- 2000-01-04 Sold (Public Records) $36,000 Public Records
Property tax history
+21.2%/yrLatest (2025): $2,492 · +2.6% YoY. Source: county tax records.
Cash-flow waterfall
monthlySold comps — $/sqft
last 12 mo · ≤1 miLoading sold comps…