2132 Pacific Dr · Clarksville, IN
Flood risk No data
- FEMA flood zone
- —
- Chance of flooding over 30 yrs
- —
- Est. flood insurance / yr
- —
Fire risk No data
- Est. fire insurance / yr
- —
Heat risk No data
- Hot days now (above threshold)
- —
- Hot days in 30 yrs
- —
Wind risk No data
- Chance of severe wind over 30 yrs
- —
Air-quality risk No data
- Unhealthy air days now
- —
- Unhealthy air days in 30 yrs
- —
Risk factors via First Street. Map © Google.
Why this score? — see what drove the B grade
The composite is a weighted blend of 9 inputs, each scored 0–100. Each bar is that input's sub-score; the figure is the points it added to the 100-point composite (weight × sub-score).
- Cash flow +30.0/30.0
- 1% rule +10.0/10.0
- DSCR +10.0/10.0
- ARV discount +7.5/15.0
- Condition / age +4.0/5.0
- Livability +3.8/5.0
- Schools +2.7/10.0
- Rent growth +2.5/5.0
- Appreciation +0.0/10.0
$47,900
🖨 Deal sheet (PDF) 📄 Offer letter ✓ Due diligence
Listing remarks MLS
Available now Move into your new home this spring This rare gem is a spacious 3 bedroom 2 bathroom home now available in the Wellington Green Manufactured Home Community. The home is move in ready and includes all kitchen and laundry appliances. It features a spacious galley kitchen with plenty of cabinet space and and in unit laundry area with washer and dryer included Wellington Green is a quiet well maintained community offering a swimming pool basketball court playground and a barbecue and picnic area. Conveniently located close to shopping dining and public transportation Message today to schedule a tour and secure your spring move in before it is gone
Key facts
- Built 2026
- Listed 80 days
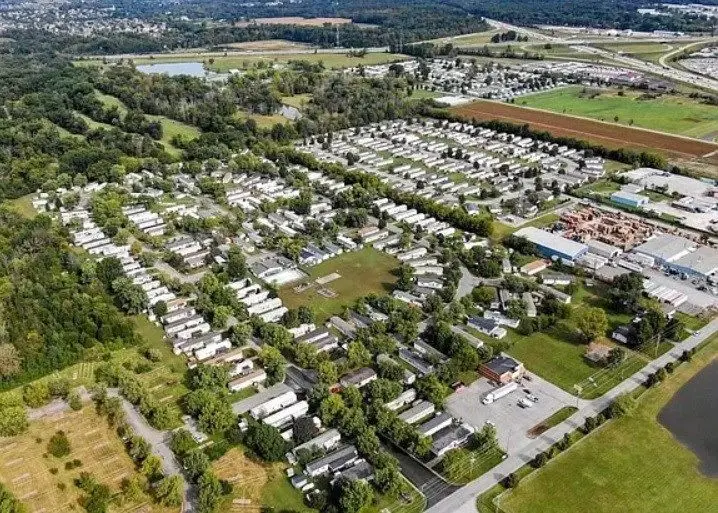
Neighborhood map
What this means for you Summary
Snapshot
- This is a 3-bed/2.0-bath manufactured listed at $48k. Condition is rated good.
Deal economics
- At list price, monthly cash flow is $693 ($8k/yr) — positive.
- The deal already cash-flows at list — no discount required.
- Meets the 1% rule at list price ($1k rent vs $48k).
- Recommended offer: $45k (6.0% below list) — sets the bar for market timing.
- Cap rate 23.7% vs local median 3.3% in Clarksville — top-decile yield for the area; either an underpriced asset or a hidden risk that comps aren't pricing in. Stress-test before assuming the spread holds.
Location & tenants
- Location reads 76/100 on livability (#46 in IN, #3,300 nationally) — a middle-class / working-renter tenant base. Strengths: cost of living A+, housing A+, commute A-; Watch: crime D+, employment D+, amenities D.
- Greater Clark County Schools (suburban): math 26% / reading 37% proficiency, ranked #224 of 301 in IN (top 74%) — families likely to look elsewhere, expect single-tenant / working-renter base with shorter leases.
- Zoned schools: W E Wilson Elementary (math 31% / reading 32%, grade F, #678 of 994 statewide, top 68%, 481 students, 70% FRL); River Valley Middle School (math 21% / reading 35%, grade F, #226 of 330 statewide, top 69%, 850 students, 67% FRL); Jeffersonville High School (math 17% / reading 52%, grade F, #270 of 369 statewide, top 77%, 2,130 students, 58% FRL) — zoned schools average 65% FRL vs 48% district-wide (17 pts higher); higher-poverty schools than district average — tighter screening recommended.
- Market conditions: 29 active listings in the ZIP; 17 comparable units currently listed for rent nearby; rentals lingering (median 46d on market — plan ~5-8 weeks vacancy on turnover, expect pricing pressure); 53% of comp listings sitting > 30 days — soft ceiling on asking rent; 911 units permitted in Clark County in 2024 (133 in 5+ unit buildings).
Forward outlook
- Local home prices are declining (-3.0%/yr); year-one equity from $331 of loan paydown is wiped out by about $1k of value loss. Plan a longer hold.
- Clark County population projected at +17% by 2050 — long-run rental-demand tailwind backs the buy-and-hold thesis.
- At projected returns (-3.0% appreciation + 3.0% rent growth), your $13k cash investment doubles in ~2 years — after that, you're playing with house money.
Negotiation context
- It's been on market 80 days — a 6% lower offer ($45k) is reasonable based on typical stale-listing flexibility.
Questions for the listing agent
- It's been on market 80 days. Have you received any prior offers? Is the seller open to a 6% concession, seller financing, or rate buy-down credit?
- Why hasn't it sold? Are there any deal-killer items the seller is aware of (foundation, flood, title, zoning, code violations)?
- Is there a deadline driving the sale (1031 exchange, divorce, estate, relocation)? That informs how much negotiation room exists.
- Schools are D-rated, which usually means shorter tenancies and higher turnover. Who's the typical renter profile here, and what's been the actual vacancy rate?
- Crime grade is D in this area — have there been break-ins, vandalism, or insurance claims at this property in the last 3 years? What carrier currently insures it and at what premium?
- What's the average days-on-market for RENTAL listings here right now (not sales)? A rising rental-DOM trend means longer vacancies and softer asking-rent achievability than the comps imply.
- What's the recent tenant-quality profile in this submarket — average credit score on applications, eviction rate, late-payment / NSF rate, and stable-employment percentage? A property-management company in the area should have these aggregated.
- How much new for-sale + rental construction is in the pipeline within 1–3 miles? Heavy new supply typically softens prices + rents 12–24 months out; constrained supply supports both.
Investment metrics
- 1% rule
- 2.71% ✓
- Cap rate
- 23.66%
- Cash-on-cash
- 62.03%
- DSCR
- 3.76
- GRM
- 3.1
CMA / ARV
No comps found within radius.
Projected returns pro-forma
-3.0% appreciation · 3.0% rent growth · sell at horizon
- IRR
- 61.0%
- Equity multiple
- 3.72×
- Total profit
- $36,416
- Equity at exit
- $7,142
- IRR
- 65.6%
- Equity multiple
- 7.61×
- Total profit
- $88,651
- Equity at exit
- $4,142
Cash invested: $13,412 (down + closing). Projections, not guarantees.
Landlord ↔ Tenant lean methodology
- Overall (STATE)
- 90 Strongly Landlord-Friendly
- State Indiana
- 90 Strongly Landlord-Friendly · R+11
- County
- — inherits STATE
- City
- — inherits STATE
ZIP-level market 47129
- Home prices YoY
- -30.9%
- Active inventory
- 29
- Price-to-rent
- 3.1×
Monthly cashflow live
- Estimated rent
- $1,297 high interval (Pro) →
- Mortgage (P&I)
- −$251
- Tax est. 1.5%
- −$60 /mo · $718/yr
- Insurance
- −$20
- HOA
- −$0
- Vacancy / Maint / Mgmt
- −$272
- Net cashflow
- $693
Break-even live
Sensitivity live
| Price | -10% $726 | -5% $710 | +0% $693 | +5% $677 | +10% $660 |
|---|---|---|---|---|---|
| Rent | -10% $591 | -5% $642 | +0% $693 | +5% $745 | +10% $796 |
| Rate | -1.0pp $717 | -0.5pp $706 | base $693 | +0.5pp $681 | +1.0pp $668 |
UW: 25.0% down · 7.5% · 30yr · 1.5% tax · 5.0% vac · 8.0% maint · 8.0% mgmt
Financing live
Cash to close
- Down payment
- $11,975
- Closing costs
- $1,437
- Reserves months
- —
- Total cash needed
- —
Loan-product check · same deal, 3 products live
Conventional
25% down · 7.5% · 30yr
- Down + closing
- —
- Monthly P&I
- —
- Monthly cashflow
- —
- DSCR
- —
- Eligible?
- —
Personal DTI + credit; lowest rate.
DSCR
20% down · 8.5% · 30yr
- Down + closing
- —
- Monthly P&I
- —
- Monthly cashflow
- —
- DSCR
- —
- Eligible?
- —
No personal income docs; deal must DSCR.
Hard money
10% down · 12.0% · 12mo
- Down + closing
- —
- Monthly P&I
- —
- Monthly cashflow
- —
- DSCR
- —
- Eligible?
- —
Short-term bridge; refi at stabilization.
Rent comps 17 comps
| Address | Beds | Baths | Sqft | Rent | $/sqft | DOM | Units | Dist |
|---|---|---|---|---|---|---|---|---|
| 2132 Pacific Dr Unit 16B Clarksville, IN | 3.0 | 2.0 | 1056 | $1,299 | $1.23 | 45d | 1 | 0.02mi |
| 2331 Wellington Green Dr Unit 66 Clarksville, IN | 3.0 | 2.0 | 1088 | $1,059 | $0.97 | 45d | 1 | 0.17mi |
| 2304 Wellington Green Dr Unit 170 Clarksville, IN | 3.0 | 2.0 | 1088 | $1,169 | $1.07 | 45d | 1 | 0.22mi |
| 2424 Addmore Ln Clarksville, IN | 3.0 | 2.0 | 1080 | $1,250 | $1.16 | 5d | 1 | 0.32mi |
| 4501 Town Center Blvd Jeffersonville, IN | 1.0–3.0 | 1.0–2.0 | 1172 | $1,930 | $1.65 | 3d | 62 | 0.70mi |
| 4903 Hamburg Pike Jeffersonville, IN | 1.0–3.0 | 1.0–2.0 | 1172 | $1,820 | $1.55 | 3d | 21 | 0.81mi |
| 1909 Greentree Blvd Clarksville, IN | 1.0–3.0 | 1.0–2.0 | 980 | $2,010 | $2.05 | 3d | 11 | 1.18mi |
| 1815 Greentree Blvd Unit 1721-088 Clarksville, IN | 2.0 | 1.0 | 805 | $845 | $1.05 | 45d | 1 | 1.26mi |
| 1815 Greentree Blvd Unit 1717-111 Clarksville, IN | 2.0 | 1.0 | 805 | $906 | $1.13 | 25d | 1 | 1.26mi |
| 1815 Greentree Blvd Unit 1813-170 Clarksville, IN | 3.0 | 2.0 | 1260 | $1,307 | $1.04 | 45d | 1 | 1.26mi |
| 1815 Greentree Blvd Unit 1731-073 Clarksville, IN | 2.0 | 1.0 | 860 | $979 | $1.14 | 45d | 1 | 1.26mi |
| 1815 Greentree Blvd Unit 1723-025 Clarksville, IN | 2.0 | 1.0 | 860 | $934 | $1.09 | 45d | 1 | 1.26mi |
| 1815 Greentree Blvd Unit 1721-084 Clarksville, IN | 2.0 | 1.0 | 805 | $908 | $1.13 | 23d | 1 | 1.26mi |
| 1815 Greentree Blvd Unit 1713-046 Clarksville, IN | 2.0 | 1.0 | 805 | $906 | $1.13 | 45d | 1 | 1.26mi |
| 1815 Greentree Blvd Unit 1719-093 Clarksville, IN | 2.0 | 1.0 | 805 | $863 | $1.07 | 45d | 1 | 1.26mi |
| 1815 Greentree Blvd Unit 1721-080 Clarksville, IN | 2.0 | 1.0 | 805 | $845 | $1.05 | 25d | 1 | 1.26mi |
| 1418 Marlowe Dr Clarksville, IN | 1.0–3.0 | 1.0–2.0 | 954 | $1,338 | $1.40 | 3d | 13 | 1.37mi |
Listing history 16 events
-
2026-06-21days on market $47,900 Active 80 DOM
-
2026-06-18days on market $47,900 Active 77 DOM
-
2026-06-17days on market $47,900 Active 76 DOM
-
2026-06-16days on market $47,900 Active 75 DOM
-
2026-06-15days on market $47,900 Active 74 DOM
-
2026-06-13days on market $47,900 Active 72 DOM
-
2026-06-13days on market $47,900 Active 71 DOM
-
2026-06-10days on market $47,900 Active 69 DOM
-
2026-06-09days on market $47,900 Active 68 DOM
-
2026-06-08days on market $47,900 Active 67 DOM
-
2026-06-07days on market $47,900 Active 66 DOM
-
2026-06-03days on market $47,900 Active 62 DOM
-
2026-06-02days on market $47,900 Active 61 DOM
-
2026-06-01days on market $47,900 Active 60 DOM
-
2026-05-31days on market $47,900 Active 59 DOM
-
2026-04-02$47,900 Active 668-char remark
Show marketing remark (668 chars)
Available now Move into your new home this spring This rare gem is a spacious 3 bedroom 2 bathroom home now available in the Wellington Green Manufactured Home Community. The home is move in ready and includes all kitchen and laundry appliances. It features a spacious galley kitchen with plenty of cabinet space and and in unit laundry area with washer and dryer included Wellington Green is a quiet well maintained community offering a swimming pool basketball court playground and a barbecue and picnic area. Conveniently located close to shopping dining and public transportation Message today to schedule a tour and secure your spring move in before it is gone
ⓘ Source: listings_history table (triggers on properties + properties_extension) + one-shot
backfill from property_details.listing_events for pre-trigger history.
Nearby sold comps map
Loading sold comps map…
Walkable amenities ~0.75 mi
Loading nearby amenities…
Taxation est. · year 1
- Rental income
- $15,560
- − Mortgage interest
- −$2,683
- − Property taxes
- −$718
- − Insurance
- −$240
- − Repairs & maintenance
- −$1,245
- − Management
- −$1,245
- − Depreciation
- −$1,393
- Taxable income
- $8,036
- Est. tax owed @ 24.0%
- −$1,929
- After-tax cash flow
- $6,391/yr
For passive investors: Depreciation is non-cash, so a rental often shows a tax loss while cash-flowing — sheltering income. Rental losses are passive: they offset passive income freely, and up to $25,000/yr can offset ordinary (W-2) income if you actively participate and your MAGI is under $100k (phasing out to $0 by $150k); unused losses carry forward. On sale, claimed depreciation is recaptured at up to 25%, and gains may owe capital-gains tax (a 1031 exchange can defer both). Figures are a year-1 estimate at your 24.0% rate — not tax advice; consult a CPA.
Condition & rehab AI · 12 photos
This move-in ready manufactured home in Wellington Green is in good condition with no major repairs needed. It offers a spacious layout, modern amenities, and a well-maintained exterior. Value-adding updates include painting, landscaping, new flooring, and kitchen appliances.
Value-add opportunities
- Both Painting exterior and interior walls — Enhances curb appeal and interior aesthetics
- Both Landscaping improvements — Enhances curb appeal and adds value
- Both New flooring in bathrooms — Improves functionality and aesthetics
- Both New kitchen appliances — Enhances functionality and aesthetics
Renovation cost estimate screening
Value-add ROI direction
- Both Painting exterior and interior walls — Enhances curb appeal and interior aesthetics ↑
- Both Landscaping improvements — Enhances curb appeal and adds value ↑
- Both New flooring in bathrooms — Improves functionality and aesthetics ↑
- Both New kitchen appliances — Enhances functionality and aesthetics ↑
ⓘ Cost ranges are severity-bucket heuristics (US national rule-of-thumb). Get contractor quotes + a written scope before underwriting a rehab budget.
Schools (NCES district)
- District
- Greater Clark County Schools
- NCES district ID
- 1803940
- Math proficiency
- 26% ▼ -15.00%
- Reading proficiency
- 37% ▼ -13.00%
- Median HH income
- $47,838
- Composite
- 27.2/100
- National rank
- #7020
- State rank
- #224 of 301 in IN
Livability — Clarksville
- Score
- 76/100
- State rank
- #46
- US rank
- #3300
Category grades
Schools grade is shown separately in the Schools card above.
Census & demographics
- Census place
- Clarksville, IN
- County
- Clark County · 108,879 people
- City population
- 19,582
- Metro
- Louisville/Jefferson County, KY-IN
- Population (ZIP)
- 19,582
- Household income
- $56,185
- Rent vs Own
- Severe rent burden
- 774.0
Population outlook (Clark County) Hauer SSP2
- Today (2025)
- 126,401 people
- By 2030
- 131,455 · +4.0%
- By 2040
- 140,471 · +11.1%
- By 2050
- 147,677 · +16.8%
- By 2075
- 161,702 · +27.9%
- By 2100
- 164,078 · +29.8%
Race, ethnicity, and origin ACS 2023
- Neighborhood character
- Predominantly White (70%)
- Race & ethnicity
- White 70% Hispanic / Latino 18% Black 8% Two or more races 7% Native American 2%
- Hispanic origin (detail)
- Mexican 15% Puerto Rican 2%
- Common ancestry
- Lithuanian 2% Slovak 2% Romanian 1%
- Foreign-born
- 10% · Canada
- Languages at home
- 84% English-only · Spanish 15%
Political lean MEDSL · Clark
- 2024 margin
- Strong R (+20.4) · D 38.9% · R 59.3% · Other 1.8%
- 2008→2024 swing
- -13.3pp toward R · 2008: -7.1pp · 2024: -20.4pp
- All cycles
- 2024: R+20.4 2020: R+18.3 2016: R+22.0 2012: R+9.9 2008: R+7.1
Not yet ingested
- Civics
- —
Market trends
- HPI YoY
- ▼ -104.33%
- Current HPI
- 233.0094
- Rent YoY
- —
- Metro
- Louisville/Jefferson County, KY-IN
- State GDP YoY
- ▲ 2.90%
- F500 in state
- 18
Industry mix (Fortune 500 HQ in IN)
| Industry | F500 HQs | Revenue |
|---|---|---|
| Industrial Machinery | 2 | $37B |
|
||
| Healthcare | 1 | $177B |
|
||
| Pharmaceuticals | 1 | $45B |
|
||
| Metals / Steel | 1 | $18B |
|
||
| Agriculture | 1 | $17B |
|
||
| Packaging | 1 | $12B |
|
||
Price history
1 event — show timeline
- 2026-04-02 Listed $47,900 Zillow
Cash-flow waterfall
monthlySold comps — $/sqft
last 12 mo · ≤1 miLoading sold comps…