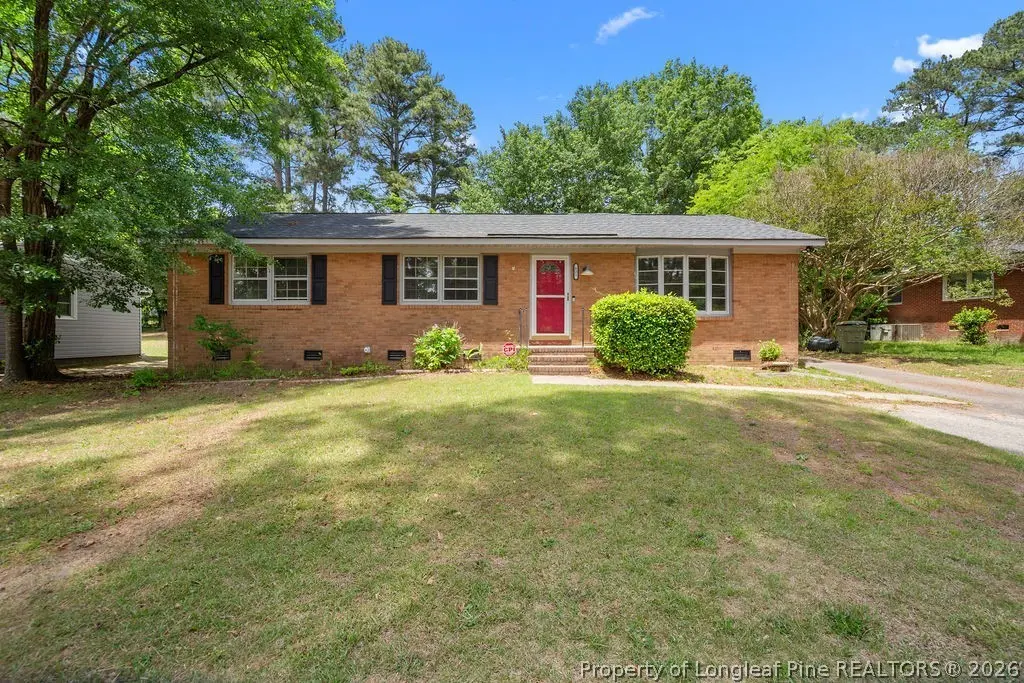
621 Ashboro St · Fayetteville, NC
Flood risk 1/10 · Minimal
- FEMA flood zone
- X (unshaded)
- Chance of flooding over 30 yrs
- 0.0%
- Est. flood insurance / yr
- $507 – $1,088
Fire risk 3/10 · Minor
- Est. fire insurance / yr
- $906 – $1,684
Heat risk 7/10 · Major
- Hot days now (above 106°F)
- 7 days/yr
- Hot days in 30 yrs
- 16 days/yr
Wind risk 6/10 · Moderate
- Chance of severe wind over 30 yrs
- 76.0%
Air-quality risk 2/10 · Minimal
- Unhealthy air days now
- 0 days/yr
- Unhealthy air days in 30 yrs
- 1 days/yr
Risk factors via First Street. Map © Google.
Why this score? — see what drove the D+ grade
The composite is a weighted blend of 9 inputs, each scored 0–100. Each bar is that input's sub-score; the figure is the points it added to the 100-point composite (weight × sub-score).
- Cash flow +14.2/30.0
- ARV discount +11.2/15.0
- DSCR +4.3/10.0
- 1% rule +3.8/10.0
- Livability +3.8/5.0
- Rent growth +3.2/5.0
- Schools +3.1/10.0
- Condition / age +2.5/5.0
- Appreciation +0.0/10.0
$180,000
🖨 Deal sheet (PDF) 📄 Offer letter ✓ Due diligence
Listing remarks
This move-in ready gem is packed with updates and priced to sell. Featuring 3 bedrooms, 2 full bathrooms, plus a versatile bonus room that can easily function as a home office, guest room, playroom, or formal dining space depending on your needs. Major updates have already been handled for you, including a brand new roof, HVAC system, plumbing, fresh interior paint, and newly stained floors, giving peace of mind on the big-ticket items from day one. The layout offers a spacious separate laundry room that also serves as a generous entry/drop zone area, adding both function and flexibility to everyday living. Step outside to an enormous fully fenced backyard situated on a lot larger than a qu
Key facts
- Plumbing
- Newly stained floors
- Fresh interior paint
Tags
Property features AI
Finance
- Other: Zoning: SF10 - Single Family Res 10; Subdivision: WOODCLIFT; GPS-friendly directions
Exterior
- Utilities: Public water; Public sewer
- Home design: Single family residence; One story
- Construction: Brick construction
- Exterior features: Level lot; Shed(s); Workshop
Interior
- Kitchen: Refrigerator; Dishwasher; Ice maker
- Bedrooms: Total of 6 rooms (includes bedrooms and living spaces)
- Flooring: Hardwood; Vinyl
- Bathrooms: 2 full bathrooms
- Heating & cooling: Central air conditioning
- Interior features: Eat-in kitchen; Storage; Porch (screened); Storm door(s); Back yard fencing
- Laundry & utility: Washer hookup; Crawl space basement
Neighborhood map
What this means for you Summary
Snapshot
- This is a 3-bed/2.0-bath single-family listed at $180k.
Deal economics
- At list price, monthly cash flow is $31 ($375/yr) — positive.
- The deal already cash-flows at list — no discount required.
- To meet the 1% rule (rent ≥ 1% of price), the offer needs to be $158k (12.4% below list).
- Recommended offer: $158k (12.4% below list) — sets the bar for 1% rule.
- Cap rate 6.5% vs local median 4.8% in Fayetteville — top-decile yield for the area; either an underpriced asset or a hidden risk that comps aren't pricing in. Stress-test before assuming the spread holds.
Location & tenants
- Location reads 75/100 on livability (#45 in NC, #4,031 nationally) — a middle-class / working-renter tenant base. Strengths: commute A+, cost of living A+, housing A+; Watch: crime F, employment D-.
- Cumberland County Schools (urban): math 32% / reading 41% proficiency, ranked #126 of 178 in NC (top 71%) — families likely to look elsewhere, expect single-tenant / working-renter base with shorter leases.
- Zoned schools: Lucile Souders Elementary (math 22% / reading 27%, grade F, #1,112 of 1,410 statewide, top 82%, 418 students, 99% FRL); Luther Nick Jeralds Middle (math 13% / reading 24%, grade F, #436 of 475 statewide, top 93%, 616 students, 100% FRL); E E Smith High (math 42% / reading 41%, grade F, #381 of 535 statewide, top 72%, 1,004 students, 99% FRL) — zoned schools average 99% FRL vs 55% district-wide (45 pts higher); higher-poverty schools than district average — tighter screening recommended.
- Market conditions: Rents rising (+2.8%/yr); 364 active listings in the ZIP; 16 comparable units currently listed for rent nearby; rentals at typical pace (median 26d on market — plan ~3-4 weeks tenant-placement turnaround); 1,125 units permitted in Cumberland County in 2024 (104 in 5+ unit buildings).
- This rent runs 30% of the median local income ($62k/yr) — at the standard rent-burdened threshold; future hikes will face affordability resistance.
Forward outlook
- Local home prices are declining (-3.0%/yr); year-one equity from $1k of loan paydown is wiped out by about $5k of value loss. Plan a longer hold.
Negotiation context
- It's been on market 39 days — a 3% lower offer ($175k) is reasonable based on typical stale-listing flexibility.
Risks & watch-outs
- Climate carrying-cost: major wind risk, 76% chance of damaging wind over 30y; extreme-heat days projected 7→16/yr by 2055 (HVAC capex compounding) — expect insurance premiums to compound above CPI over the hold.
Questions for the listing agent
- It's been on market 39 days. Have you received any prior offers? Is the seller open to a 12% concession, seller financing, or rate buy-down credit?
- Built in 1965 — when were the roof, HVAC, electrical panel, plumbing, and water heater last replaced?
- Is there a deadline driving the sale (1031 exchange, divorce, estate, relocation)? That informs how much negotiation room exists.
- Crime grade is F in this area — have there been break-ins, vandalism, or insurance claims at this property in the last 3 years? What carrier currently insures it and at what premium?
- The area grade is low — what's the realistic commute time and amenity access for the typical tenant pool here? Any planned neighborhood developments (good or bad) we should know about?
- What's the average days-on-market for RENTAL listings here right now (not sales)? A rising rental-DOM trend means longer vacancies and softer asking-rent achievability than the comps imply.
- What's the recent tenant-quality profile in this submarket — average credit score on applications, eviction rate, late-payment / NSF rate, and stable-employment percentage? A property-management company in the area should have these aggregated.
- How much new for-sale + rental construction is in the pipeline within 1–3 miles? Heavy new supply typically softens prices + rents 12–24 months out; constrained supply supports both.
Investment metrics
- 1% rule
- 0.88% ✗
- Cap rate
- 6.50%
- Cash-on-cash
- 0.74%
- DSCR
- 1.03
- GRM
- 9.5
CMA / ARV
- ARV (on-the-fly)
- $196,250
- Comps found
- 12
Show comp detail 12 sales within ~0.75 mi
| Address | Dist | Beds/Ba | Sqft | Sold | Price | $/sf | Match |
|---|---|---|---|---|---|---|---|
| 436 Randolph Ave | 0.09mi | 3/2.0 | 1,266 (+1%) | 10mo | $226,000 | $179 | 85 |
| 633 Law Rd | 0.14mi | 3/2.0 | 1,275 (+2%) | 7mo | $195,000 | $153 | 84 |
| 3513 Greenwood Dr | 0.34mi | 3/1.5 | 1,204 (-4%) | 10mo | $185,000 | $154 | 67 |
| 219 Randolph Ave | 0.22mi | 3/1.5 | 1,134 (-9%) | 16mo | $125,000 | $110 | 59 |
| 3646 Florida Dr | 0.38mi | 3/2.0 | 1,404 (+12%) | 10mo | $220,200 | $157 | 54 |
| 3308 Melba Dr | 0.66mi | 3/2.0 | 1,127 (-10%) | 2mo | $191,000 | $169 | 51 |
| 324 Bartow Dr | 0.56mi | 3/2.0 | 1,435 (+15%) | 1mo | $213,000 | $148 | 48 |
| 3513 Edna St | 0.46mi | 3/2.0 | 1,428 (+14%) | 8mo | $185,000 | $130 | 48 |
| 3521 Patricia Dr | 0.37mi | 3/1.5 | 1,095 (-12%) | 15mo | $180,000 | $164 | 48 |
| 323 Tokay Dr | 0.46mi | 3/2.0 | 1,405 (+12%) | 15mo | $230,500 | $164 | 46 |
| 610 Biscayne Dr | 0.53mi | 3/2.0 | 1,403 (+12%) | 14mo | $175,000 | $125 | 43 |
| 509 Andover Rd | 0.74mi | 3/2.0 | 1,332 (+7%) | 14mo | $218,000 | $164 | 43 |
Match score weights: distance 35% · size 25% · config 20% · recency 20%. Top-matched comps best support the ARV.
Projected returns pro-forma
-3.0% appreciation · 2.82% rent growth · sell at horizon
- IRR
- -15.3%
- Equity multiple
- 0.46×
- Total profit
- $-27,458
- Equity at exit
- $26,839
- IRR
- -7.1%
- Equity multiple
- 0.55×
- Total profit
- $-22,491
- Equity at exit
- $15,563
Cash invested: $50,400 (down + closing). Projections, not guarantees.
Landlord ↔ Tenant lean methodology
- Overall (STATE)
- 85 Strongly Landlord-Friendly
- State North Carolina
- 85 Strongly Landlord-Friendly · R+3
- County
- — inherits STATE
- City
- — inherits STATE
ZIP-level market 28311
- Home prices YoY
- -18.4%
- Rents YoY
- 2.8%
- Active inventory
- 364
- Price-to-rent
- 9.5×
Monthly cashflow live
- Estimated rent
- $1,576 high interval (Pro) →
- Mortgage (P&I)
- −$944
- Tax from tax record
- −$195 /mo · $2,341/yr
- Insurance
- −$75
- HOA
- −$0
- Lot rent
- −$0
- Vacancy / Maint / Mgmt
- −$331
- Net cashflow
- $31
Break-even live
Sensitivity live
| Price | -10% $133 | -5% $82 | +0% $31 | +5% $-20 | +10% $-71 |
|---|---|---|---|---|---|
| Rent | -10% $-93 | -5% $-31 | +0% $31 | +5% $93 | +10% $156 |
| Rate | -1.0pp $122 | -0.5pp $77 | base $31 | +0.5pp $-15 | +1.0pp $-63 |
UW: 25.0% down · 7.5% · 30yr · 1.5% tax · 5.0% vac · 8.0% maint · 8.0% mgmt
Financing live
Cash to close
- Down payment
- $45,000
- Closing costs
- $5,400
- Reserves months
- —
- Total cash needed
- —
Loan-product check · same deal, 3 products live
Conventional
25% down · 7.5% · 30yr
- Down + closing
- —
- Monthly P&I
- —
- Monthly cashflow
- —
- DSCR
- —
- Eligible?
- —
Personal DTI + credit; lowest rate.
DSCR
20% down · 8.5% · 30yr
- Down + closing
- —
- Monthly P&I
- —
- Monthly cashflow
- —
- DSCR
- —
- Eligible?
- —
No personal income docs; deal must DSCR.
Hard money
10% down · 12.0% · 12mo
- Down + closing
- —
- Monthly P&I
- —
- Monthly cashflow
- —
- DSCR
- —
- Eligible?
- —
Short-term bridge; refi at stabilization.
Rent comps 16 comps
| Address | Beds | Baths | Sqft | Rent | $/sqft | DOM | Units | Dist |
|---|---|---|---|---|---|---|---|---|
| 302 Law Rd Fayetteville, NC | 2.0 | 1.5 | 940 | $999 | $1.06 | 16d | 1 | 0.45mi |
| 505 Ashdown Pl Fayetteville, NC | 4.0 | 2.0 | 1410 | $1,750 | $1.24 | 16d | 1 | 0.46mi |
| 4549 Rustic Haven Dr Fayetteville, NC | 3.0 | 2.0 | 1682 | $1,825 | $1.09 | 16d | 1 | 0.83mi |
| 3557 Hastings Dr Fayetteville, NC | 4.0 | 2.5 | 1652 | $1,795 | $1.09 | 26d | 1 | 0.88mi |
| 2846 Copenhagen Dr Fayetteville, NC | 3.0 | 2.0 | 1100 | $1,600 | $1.45 | 26d | 1 | 1.03mi |
| 228 Eastwood Ave Fayetteville, NC | 3.0 | 2.0 | 1820 | $1,755 | $0.96 | 26d | 1 | 1.07mi |
| 2737 Kentberry Ave Fayetteville, NC | 2.0–3.0 | 2.0 | 1209 | $1,400 | $1.16 | 16d | 5 | 1.07mi |
| 4453 Oakmont Cir Fayetteville, NC | 3.0 | 1.0 | 1101 | $1,300 | $1.18 | 16d | 1 | 1.15mi |
| 118 Circle Ct Fayetteville, NC | 3.0 | 2.0 | 1496 | $1,550 | $1.04 | 16d | 1 | 1.20mi |
| 539 Crooked Creek Ct Fayetteville, NC | 3.0 | 2.0 | 1258 | $1,395 | $1.11 | 26d | 1 | 1.23mi |
| 2678 Rivercliff Rd Fayetteville, NC | 3.0 | 2.0 | 1260 | $1,500 | $1.19 | 26d | 1 | 1.30mi |
| 508 Stone Way Ct Fayetteville, NC | 3.0 | 2.0 | 1261 | $1,900 | $1.51 | 26d | 1 | 1.34mi |
| 1659 Rock Creek Ln Fayetteville, NC | 4.0 | 2.5 | 1777 | $2,100 | $1.18 | 16d | 1 | 1.39mi |
| 633 Elk Ct Fayetteville, NC | 2.0 | 1.5 | 1000 | $1,000 | $1.00 | 26d | 1 | 1.41mi |
| 319 Idlewild Dr Fayetteville, NC | 2.0 | 2.0–2.5 | 1080 | $1,340 | $1.24 | 16d | 9 | 1.42mi |
| 319 Idlewild Dr Fayetteville, NC | 2.0 | 2.0–2.5 | 1080 | $1,350 | $1.25 | 26d | 3 | 1.42mi |
Listing history 18 events
-
2026-06-23days on market $180,000 Active 39 DOM
-
2026-06-21pricedays on market $180,000 Active 38 DOM
-
2026-06-18days on market $190,000 Active 35 DOM
-
2026-06-17days on market $190,000 Active 34 DOM
-
2026-06-16days on market $190,000 Active 33 DOM
-
2026-06-15days on market $190,000 Active 32 DOM
-
2026-06-14days on market $190,000 Active 30 DOM
-
2026-06-13days on market $190,000 Active 29 DOM
-
2026-06-10days on market $190,000 Active 27 DOM
-
2026-06-09days on market $190,000 Active 26 DOM
-
2026-06-08days on market $190,000 Active 25 DOM
-
2026-06-07days on market $190,000 Active 24 DOM
-
2026-06-03days on market $190,000 Active 20 DOM
-
2026-06-02days on market $190,000 Active 19 DOM
-
2026-06-01days on market $190,000 Active 18 DOM
-
2026-05-31days on market $190,000 Active 17 DOM
-
2026-05-30days on market $190,000 Active 16 DOM
-
2026-05-14$190,000 Active
ⓘ Source: listings_history table (triggers on properties + properties_extension) + one-shot
backfill from property_details.listing_events for pre-trigger history.
Tax reassessment forecast NC · Resets to sale price
- Current annual tax
- $2,341 · $195/mo
- Projected year-2 tax
- $2,341 · $195/mo
- Expected delta
- $0/yr ($0/mo · 0.0%)
ⓘ Screening estimate from a state-policy table — verify with the county assessor before closing.
Climate risk First Street
- Flood 1/10 Low FEMA zone X (unshaded) · 0% chance over 30 yrs
- Wildfire 3/10 Moderate
- Heat 7/10 Severe 7 d/yr ≥106°F today · 16 d/yr by 30 yrs out
- Wind 6/10 Major 76% chance of damaging wind over 30 yrs
- Air quality 2/10 Low 0 unhealthy d/yr today · 1 by 30 yrs out
Nearby sold comps map
Loading sold comps map…
Walkable amenities ~0.75 mi
Loading nearby amenities…
Taxation est. · year 1
- Rental income
- $18,916
- − Mortgage interest
- −$10,083
- − Property taxes
- −$2,341
- − Insurance
- −$900
- − Repairs & maintenance
- −$1,513
- − Management
- −$1,513
- − Depreciation
- −$5,236
- Taxable loss
- −$2,671
- Est. tax savings @ 24.0%
- +$641
- After-tax cash flow
- $1,016/yr
For passive investors: Depreciation is non-cash, so a rental often shows a tax loss while cash-flowing — sheltering income. Rental losses are passive: they offset passive income freely, and up to $25,000/yr can offset ordinary (W-2) income if you actively participate and your MAGI is under $100k (phasing out to $0 by $150k); unused losses carry forward. On sale, claimed depreciation is recaptured at up to 25%, and gains may owe capital-gains tax (a 1031 exchange can defer both). Figures are a year-1 estimate at your 24.0% rate — not tax advice; consult a CPA.
Schools (NCES district)
- District
- Cumberland County Schools
- NCES district ID
- 3700011
- Math proficiency
- 32% ▼ -2.00%
- Reading proficiency
- 41% ▼ -1.00%
- Median HH income
- $44,168
- Composite
- 31.0/100
- National rank
- #6096
- State rank
- #126 of 178 in NC
Livability — Fayetteville
- Score
- 75/100
- State rank
- #45
- US rank
- #4031
Category grades
Schools grade is shown separately in the Schools card above.
Census & demographics
- Census place
- Fayetteville, NC
- County
- Cumberland County · 265,314 people
- City population
- 226,118
- Metro
- Fayetteville, NC
- Population (ZIP)
- 36,629
- Household income
- $62,170
- Rent vs Own
- Severe rent burden
- 1645.0
Population outlook (Cumberland County) Hauer SSP2
- Today (2025)
- 330,855 people
- By 2030
- 333,523 · +0.8%
- By 2040
- 335,583 · +1.4%
- By 2050
- 335,325 · +1.4%
- By 2075
- 342,853 · +3.6%
- By 2100
- 340,698 · +3.0%
Race, ethnicity, and origin ACS 2023
- Neighborhood character
- Diverse neighborhood (Simpson 0.67)
- Race & ethnicity
- Black 42% White 38% Hispanic / Latino 9% Two or more races 8% Asian 3% Native American 1%
- Hispanic origin (detail)
- Mexican 3% Puerto Rican 4%
- Common ancestry
- Slovak 1% Lithuanian 1% Italian 1%
- Foreign-born
- 7% · Canada, South Korea, Jamaica
- Languages at home
- 89% English-only · Spanish 6% German/W. Germanic 1% Other Indo-European 1%
Political lean MEDSL · Cumberland
- 2024 margin
- D (+13.4) · D 56.1% · R 42.7% · Other 1.2%
- 2008→2024 swing
- -4.3pp toward R · 2008: 17.7pp · 2024: 13.4pp
- All cycles
- 2024: D+13.4 2020: D+16.6 2016: D+16.0 2012: D+19.7 2008: D+17.7
Not yet ingested
- Civics
- —
Market trends
- HPI YoY
- ▼ -45.88%
- Current HPI
- 203.0731
- Rent YoY
- ▲ 2.82%
- Metro
- Fayetteville, NC
- State GDP YoY
- ▲ 3.28%
- F500 in state
- 26
Industry mix (Fortune 500 HQ in NC)
| Industry | F500 HQs | Revenue |
|---|---|---|
| Financial Services | 2 | $213B |
|
||
| Retail | 2 | $95B |
|
||
| Industrial Conglomerate | 1 | $38B |
|
||
| Metals / Steel | 1 | $35B |
|
||
| Utilities | 1 | $30B |
|
||
| Industrial Machinery | 1 | $19B |
|
||
Price history
1 event — show timeline
- 2026-05-14 Listed $190,000 LPRMLS
Property tax history
+5.9%/yrLatest (2025): $2,341 · +50.3% YoY. Source: county tax records.
Cash-flow waterfall
monthlySold comps — $/sqft
last 12 mo · ≤1 miLoading sold comps…