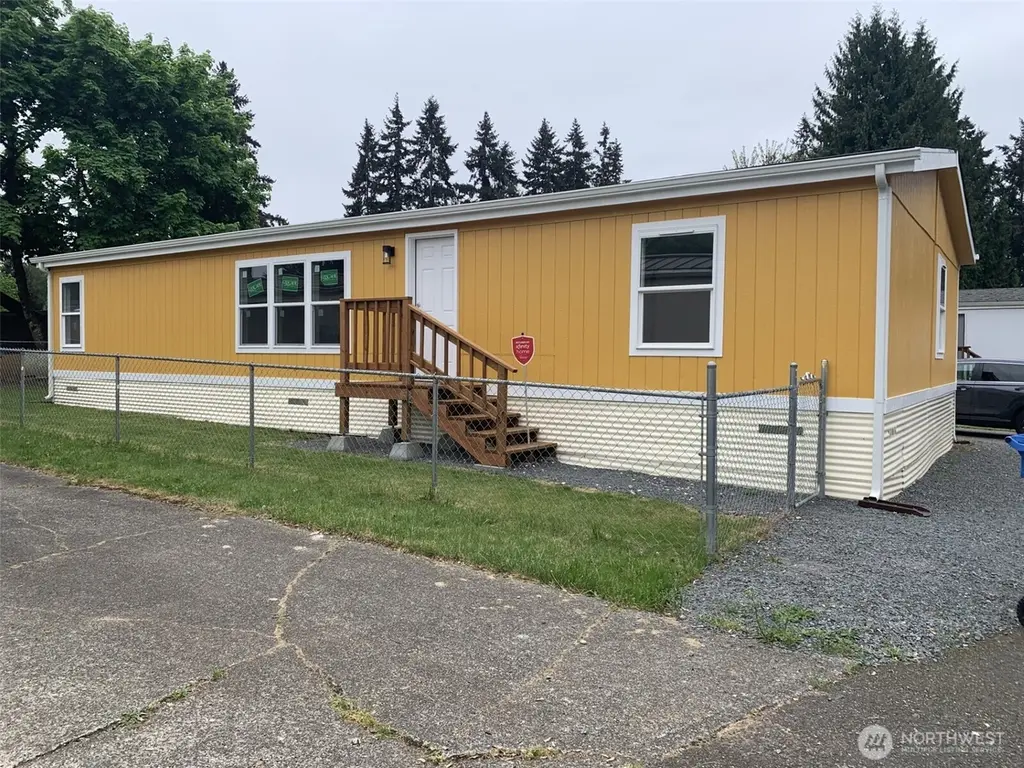
6618 236th Street Ct E #14 · Elk Plain, WA
Flood risk 1/10 · Minimal
- FEMA flood zone
- X (unshaded)
- Chance of flooding over 30 yrs
- 0.0%
- Est. flood insurance / yr
- $507 – $1,088
Fire risk 3/10 · Minor
- Est. fire insurance / yr
- $604 – $1,122
Heat risk 3/10 · Minor
- Hot days now (above 87°F)
- 7 days/yr
- Hot days in 30 yrs
- 15 days/yr
Wind risk 1/10 · Minimal
- Chance of severe wind over 30 yrs
- —
Air-quality risk 7/10 · Major
- Unhealthy air days now
- 9 days/yr
- Unhealthy air days in 30 yrs
- 11 days/yr
Risk factors via First Street. Map © Google.
Why this score? — see what drove the B- grade
The composite is a weighted blend of 9 inputs, each scored 0–100. Each bar is that input's sub-score; the figure is the points it added to the 100-point composite (weight × sub-score).
- Cash flow +30.0/30.0
- DSCR +10.0/10.0
- 1% rule +8.6/10.0
- ARV discount +7.5/15.0
- Schools +4.9/10.0
- Rent growth +3.3/5.0
- Livability +3.2/5.0
- Condition / age +2.5/5.0
- Appreciation +0.0/10.0
$199,995
🖨 Deal sheet 📄 Offer letter ✓ Due diligence
Listing remarks
Completely remodeled and move-in ready, this beautiful 3-bedroom, 2-bath home in an all-ages park offers the perfect blend of style, comfort, and convenience! Step inside to find a bright, open floor plan where the kitchen, dining, and great room flow seamlessly together—enhanced by vaulted ceilings and an abundance of natural light. Laminate wood flooring runs throughout the main living areas, with fresh paint and modern finishes creating a clean, updated feel. The dream kitchen is truly the heart of the home, featuring brand-new appliances, two breakfast bars, eye-catching tile work, display cabinets, and generous storage space. The spacious primary suite offers an oversized closet
Key facts
- Move-in ready
- Remodeled
- Open floor plan
Tags
Property features AI
Finance
- Other: Buyer to verify schools; GPS friendly directions
- Financial info: Listing terms: Cash, Conventional
- HOA & community: Located in Golden Horseshoe park; Park approved for sale; Approximately 80 homes in the park; Land lease: $850
Exterior
- Parking: Uncovered open parking; 2 open parking spaces; RV parking available in park
- Utilities: Electric energy source; Public water; Septic sewer; Electric water heater (located in closet off kitchen); Xfinity internet; Power provided by Tacoma Public Utilities
- Home design: Manufactured double-wide home; One level; Updated/remodeled; Has a view; Liberty Ridgewood model; Mobile home remains; Aluminum skirt
- Construction: Metal/vinyl and wood exterior; Composition roof; Tie down foundation; Manufactured house structure
- Exterior features: Paved lot; Patio/porch/deck; Landscaped; End-of-driveway storage
Interior
- Kitchen: Dishwasher; Refrigerator; Stove/Range; Kitchen with eating space; Dining room
- Bedrooms: 3 bedrooms
- Flooring: Laminate; Carpet
- Bathrooms: 1 full bath; 1 three-quarter bath; 1 bathtub; 2 showers; Bath off primary
- Heating & cooling: Forced air heating; No central cooling
- Interior features: Water heater; Skylights; Vaulted ceilings; Ceiling fan(s); Walk-in closet; Updated/remodeled condition
- Laundry & utility: Utility room; Washer/dryer connections (implied by utility room)
Neighborhood map
What this means for you Summary
Snapshot
- This is a 3-bed/2.0-bath manufactured listed at $200k.
Deal economics
- At list price, monthly cash flow is $940 ($11k/yr) — positive.
- The deal already cash-flows at list — no discount required.
- Meets the 1% rule at list price ($3k rent vs $200k).
- Recommended offer: $194k (3.0% below list) — sets the bar for market timing.
- Cap rate 11.9% vs local median 4.0% in Elk Plain — top-decile yield for the area; either an underpriced asset or a hidden risk that comps aren't pricing in. Stress-test before assuming the spread holds.
Location & tenants
- Location reads 63/100 on livability (#379 in WA) — a middle-class / working-renter tenant base. Strengths: housing A+, employment A-; Watch: crime C-, health & safety C-, cost of living D+.
- Bethel School District (suburban): math 47% / reading 59% proficiency, ranked #103 of 291 in WA (top 35%) — acceptable for families but not a draw, mixed tenant base, ~2y average lease.
- Market conditions: Rents rising (+3.3%/yr); 232 active listings in the ZIP; 1 comparable units currently listed for rent nearby; high-income renter base; 3,209 units permitted in Pierce County in 2024 (1,269 in 5+ unit buildings).
Forward outlook
- Local home prices are declining (-3.0%/yr); year-one equity from $1k of loan paydown is wiped out by about $6k of value loss. Plan a longer hold.
- Pierce County population projected at +26% by 2050 — long-run rental-demand tailwind backs the buy-and-hold thesis.
- At projected returns (-3.0% appreciation + 3.3% rent growth), your $56k cash investment doubles in ~6 years — after that, you're playing with house money.
Negotiation context
- It's been on market 38 days — a 3% lower offer ($194k) is reasonable based on typical stale-listing flexibility.
Questions for the listing agent
- It's been on market 38 days. Have you received any prior offers? Is the seller open to a 3% concession, seller financing, or rate buy-down credit?
- Is there a deadline driving the sale (1031 exchange, divorce, estate, relocation)? That informs how much negotiation room exists.
- Schools are F-rated, which usually means shorter tenancies and higher turnover. Who's the typical renter profile here, and what's been the actual vacancy rate?
- What's the average days-on-market for RENTAL listings here right now (not sales)? A rising rental-DOM trend means longer vacancies and softer asking-rent achievability than the comps imply.
- What's the recent tenant-quality profile in this submarket — average credit score on applications, eviction rate, late-payment / NSF rate, and stable-employment percentage? A property-management company in the area should have these aggregated.
- How much new for-sale + rental construction is in the pipeline within 1–3 miles? Heavy new supply typically softens prices + rents 12–24 months out; constrained supply supports both.
Investment metrics
- 1% rule
- 1.36% ✓
- Cap rate
- 11.93%
- Cash-on-cash
- 20.14%
- DSCR
- 1.90
- GRM
- 6.1
CMA / ARV
- ARV (on-the-fly)
- $480,168
- Comps found
- 4
Show comp detail 4 sales within ~0.75 mi
| Address | Dist | Beds/Ba | Sqft | Sold | Price | $/sf | Match |
|---|---|---|---|---|---|---|---|
| 23115 65th Ave E | 0.32mi | 4/2.0 (+1) | 1,440 (+3%) | 12mo | $492,500 | $342 | 66 |
| 23310 62nd Ave E | 0.34mi | 2/2.0 (-1) | 1,296 (-8%) | 2mo | $560,000 | $432 | 65 |
| 23702 70th Ave E | 0.19mi | 3/2.0 | 1,512 (+8%) | 23mo | $489,950 | $324 | 59 |
| 5817 241st Street Ct E | 0.57mi | 3/2.0 | 1,512 (+8%) | 22mo | $339,000 | $224 | 43 |
Match score weights: distance 35% · size 25% · config 20% · recency 20%. Top-matched comps best support the ARV.
Projected returns pro-forma
-3.0% appreciation · 3.32% rent growth · sell at horizon
- IRR
- 12.6%
- Equity multiple
- 1.50×
- Total profit
- $28,269
- Equity at exit
- $29,820
- IRR
- 21.8%
- Equity multiple
- 2.88×
- Total profit
- $105,068
- Equity at exit
- $17,292
Cash invested: $55,999 (down + closing). Projections, not guarantees.
Landlord ↔ Tenant lean methodology
- Overall (STATE)
- 28 Tenant-Leaning
- State Washington
- 28 Tenant-Leaning · D+8
- County
- — inherits STATE
- City
- — inherits STATE
ZIP-level market 98338
- Rents YoY
- 3.3%
- Active inventory
- 232
- Price-to-rent
- 6.1×
Monthly cashflow live
- Estimated rent
- $2,722 medium interval (Pro) →
- Mortgage (P&I)
- −$1,049
- Tax from tax record
- −$78 /mo · $938/yr
- Insurance
- −$83
- HOA
- −$0
- Vacancy / Maint / Mgmt
- −$572
- Net cashflow
- $940
Break-even live
UW: 25.0% down · 7.5% · 30yr · 1.5% tax · 5.0% vac · 8.0% maint · 8.0% mgmt
Financing live
Cash to close
- Down payment
- $49,999
- Closing costs
- $6,000
- Reserves months
- —
- Total cash needed
- —
Loan-product check · same deal, 3 products live
Conventional
25% down · 7.5% · 30yr
- Down + closing
- —
- Monthly P&I
- —
- Monthly cashflow
- —
- DSCR
- —
- Eligible?
- —
Personal DTI + credit; lowest rate.
DSCR
20% down · 8.5% · 30yr
- Down + closing
- —
- Monthly P&I
- —
- Monthly cashflow
- —
- DSCR
- —
- Eligible?
- —
No personal income docs; deal must DSCR.
Hard money
10% down · 12.0% · 12mo
- Down + closing
- —
- Monthly P&I
- —
- Monthly cashflow
- —
- DSCR
- —
- Eligible?
- —
Short-term bridge; refi at stabilization.
Rent comps 1 comps
| Address | Beds | Baths | Sqft | Rent | $/sqft | DOM | Units | Dist |
|---|---|---|---|---|---|---|---|---|
| 22307 58th Ave E Spanaway, WA | 3.0 | 2.0 | 1300 | $2,200 | $1.69 | 24d | 1 | 0.87mi |
Listing history 15 events
-
2026-06-18days on market $199,995 Active 38 DOM
-
2026-06-17days on market $199,995 Active 37 DOM
-
2026-06-16days on market $199,995 Active 36 DOM
-
2026-06-15days on market $199,995 Active 35 DOM
-
2026-06-13days on market $199,995 Active 33 DOM
-
2026-06-13days on market $199,995 Active 32 DOM
-
2026-06-09days on market $199,995 Active 29 DOM
-
2026-06-08days on market $199,995 Active 28 DOM
-
2026-06-07days on market $199,995 Active 27 DOM
-
2026-06-04days on market $199,995 Active 24 DOM
-
2026-06-03days on market $199,995 Active 23 DOM
-
2026-06-02days on market $199,995 Active 22 DOM
-
2026-06-01days on market $199,995 Active 21 DOM
-
2026-05-31days on market $199,995 Active 20 DOM
-
2026-05-11$209,995 Active
ⓘ Source: listings_history table (triggers on properties + properties_extension) + one-shot
backfill from property_details.listing_events for pre-trigger history.
Tax reassessment forecast WA · Resets to sale price
- Current annual tax
- $938 · $78/mo
- Projected year-2 tax
- $1,960 · $163/mo
- Expected delta
- +$1,022/yr (+$85/mo · 108.9%)
ⓘ Screening estimate from a state-policy table — verify with the county assessor before closing.
Climate risk First Street
- Flood 1/10 Low FEMA zone X (unshaded) · 0% chance over 30 yrs
- Wildfire 3/10 Moderate
- Heat 3/10 Moderate 7 d/yr ≥87°F today · 15 d/yr by 30 yrs out
- Wind 1/10 Low
- Air quality 7/10 Severe 9 unhealthy d/yr today · 11 by 30 yrs out
Nearby sold comps map
Loading sold comps map…
Walkable amenities ~0.75 mi
Loading nearby amenities…
Taxation est. · year 1
- Rental income
- $32,661
- − Mortgage interest
- −$11,203
- − Property taxes
- −$938
- − Insurance
- −$1,000
- − Repairs & maintenance
- −$2,613
- − Management
- −$2,613
- − Depreciation
- −$5,818
- Taxable income
- $8,477
- Est. tax owed @ 24.0%
- −$2,034
- After-tax cash flow
- $9,244/yr
For passive investors: Depreciation is non-cash, so a rental often shows a tax loss while cash-flowing — sheltering income. Rental losses are passive: they offset passive income freely, and up to $25,000/yr can offset ordinary (W-2) income if you actively participate and your MAGI is under $100k (phasing out to $0 by $150k); unused losses carry forward. On sale, claimed depreciation is recaptured at up to 25%, and gains may owe capital-gains tax (a 1031 exchange can defer both). Figures are a year-1 estimate at your 24.0% rate — not tax advice; consult a CPA.
Schools (NCES district)
- District
- Bethel School District
- NCES district ID
- 5300480
- Math proficiency
- 47% ▬ 0.00%
- Reading proficiency
- 59% ▲ 2.00%
- Median HH income
- $65,872
- Composite
- 48.66/100
- National rank
- #4568
- State rank
- #103 of 291 in WA
Livability — Elk Plain
- Score
- 63/100
- State rank
- #379
- US rank
- #14927
Category grades
Schools grade is shown separately in the Schools card above.
Census & demographics
- Census place
- Elk Plain, WA
- County
- Pierce County · 788,257 people
- City population
- 49,940
- Metro
- Seattle-Tacoma-Bellevue, WA
- Population (ZIP)
- 32,687
- Household income
- $114,819
- Rent vs Own
- Severe rent burden
- 236.0
Population outlook (Pierce County) Hauer SSP2
- Today (2025)
- 956,648 people
- By 2030
- 1,010,862 · +5.7%
- By 2040
- 1,113,170 · +16.4%
- By 2050
- 1,206,524 · +26.1%
- By 2075
- 1,436,425 · +50.2%
- By 2100
- 1,563,654 · +63.5%
Race, ethnicity, and origin ACS 2023
- Neighborhood character
- Predominantly White (71%)
- Race & ethnicity
- White 71% Two or more races 15% Hispanic / Latino 12% Asian 3% Black 3% Pacific Islander 2% Native American 1%
- Hispanic origin (detail)
- Mexican 7%
- Common ancestry
- Italian 4% Portuguese 4% Iranian 3%
- Foreign-born
- 7% · Canada, South Korea, China
- Languages at home
- 88% English-only · Spanish 5% Russian/Polish/Slavic 2% Other Asian/Pacific 1%
Political lean MEDSL · Pierce
- 2024 margin
- D (+10.8) · D 53.9% · R 43.1% · Other 3.0%
- 2008→2024 swing
- -1.4pp toward R · 2008: 12.2pp · 2024: 10.8pp
- All cycles
- 2024: D+10.8 2020: D+11.2 2016: D+7.5 2012: D+11.0 2008: D+12.2
Not yet ingested
- Civics
- —
Market trends
- HPI YoY
- ▼ -501.28%
- Current HPI
- 304.4241
- Rent YoY
- ▲ 3.32%
- Metro
- Seattle-Tacoma-Bellevue, WA
- State GDP YoY
- ▲ 4.65%
- F500 in state
- 22
Industry mix (Fortune 500 HQ in WA)
| Industry | F500 HQs | Revenue |
|---|---|---|
| Retail | 2 | $269B |
|
||
| Technology / Retail | 1 | $638B |
|
||
| Technology | 1 | $245B |
|
||
| Telecommunications | 1 | $38B |
|
||
| Food / Beverage | 1 | $36B |
|
||
| Automotive / Trucks | 1 | $34B |
|
||
Price history
1 event — show timeline
- 2026-05-11 Listed $209,995 NWMLS as Distributed by MLS Grid
Property tax history
+6.7%/yrLatest (2026): $938 · +4.4% YoY. Source: county tax records.
Cash-flow waterfall
monthlySold comps — $/sqft
last 12 mo · ≤1 miLoading sold comps…