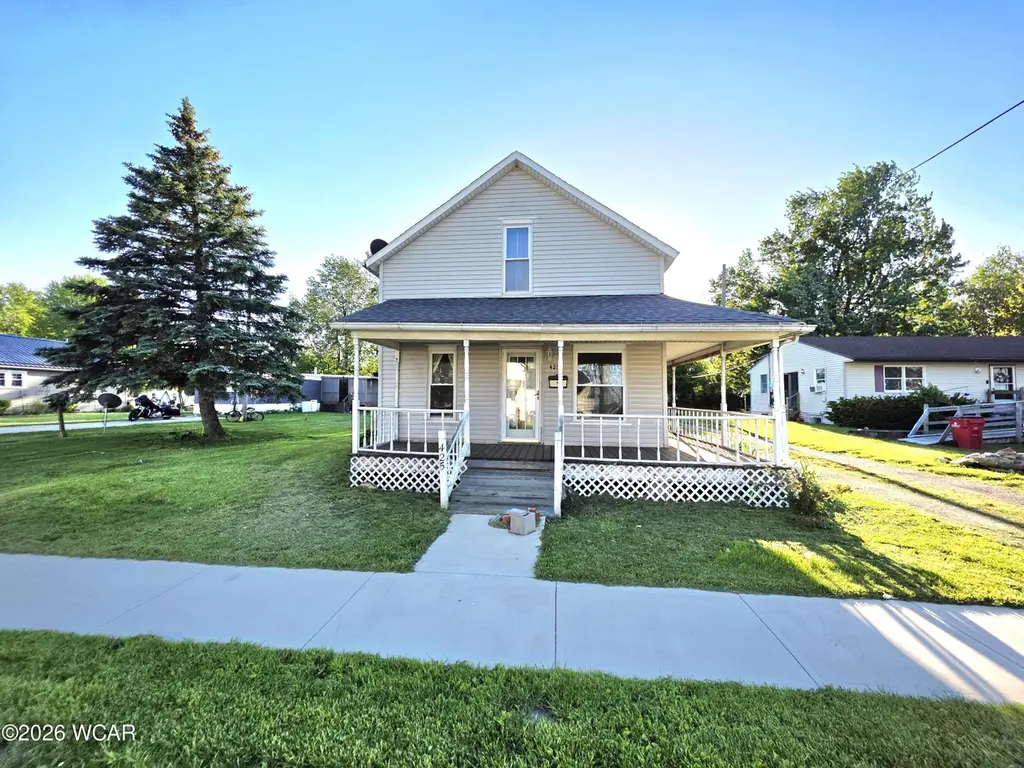
425 Liberty St · Ada, OH
Flood risk 1/10 · Minimal
- FEMA flood zone
- —
- Chance of flooding over 30 yrs
- 0.0%
- Est. flood insurance / yr
- —
Fire risk 1/10 · Minimal
- Est. fire insurance / yr
- $713 – $1,323
Heat risk 3/10 · Minor
- Hot days now (above 100°F)
- 7 days/yr
- Hot days in 30 yrs
- 17 days/yr
Wind risk 2/10 · Minimal
- Chance of severe wind over 30 yrs
- —
Air-quality risk 2/10 · Minimal
- Unhealthy air days now
- 1 days/yr
- Unhealthy air days in 30 yrs
- 2 days/yr
Risk factors via First Street. Map © Google.
Why this score? — see what drove the C grade
The composite is a weighted blend of 9 inputs, each scored 0–100. Each bar is that input's sub-score; the figure is the points it added to the 100-point composite (weight × sub-score).
- Cash flow +18.0/30.0
- ARV discount +15.0/15.0
- DSCR +5.7/10.0
- Schools +5.7/10.0
- 1% rule +4.3/10.0
- Livability +4.0/5.0
- Rent growth +2.5/5.0
- Condition / age +2.5/5.0
- Appreciation +0.0/10.0
$110,000
🖨 Deal sheet 📄 Offer letter ✓ Due diligence
Listing remarks
Looking for an affordable home in a charming college town? This 2-bedroom home in Ada offers plenty of potential and is the perfect opportunity for first-time buyers, investors, or anyone ready to make a house their own. Home to Ohio Northern University, Ada is known for its small-town charm, quiet atmosphere, and strong community feel. This property features a nice yard, a detached garage, and solid potential throughout. While it could use some improvements and personal touches, it offers a great foundation at an attractive price point. Whether you're looking for a starter home, rental investment, or project property, this home is full of possibilities
Key facts
- 7,500 sq ft lot
- Garage
- Listed 37 days
Property features AI
Finance
- Other: Residential property listed by Century 21 Sunway Realty-Kenton
- Financial info: Not specified
- HOA & community: Not specified
Exterior
- Parking: Detached garage with 1 garage space; Additional garage structure on property
- Security: Not specified
- Utilities: Public water; Public sewer
- Home design: Single-family residence; Two stories; Fixer condition
- Construction: Wood siding exterior; Block foundation; Built year not specified
- Exterior features: Front porch; Lot roughly 50 x 150; Residential zoning
Interior
- Kitchen: Includes oven and refrigerator
- Bedrooms: Not specified
- Flooring: Carpet; Laminate
- Bathrooms: 1 full bathroom
- Heating & cooling: Forced air heating (natural gas); Window air conditioning units
- Interior features: Dryer, Oven, Refrigerator, Washer; Carpet and laminate flooring; Nine total rooms
- Laundry & utility: Washer and dryer included
Neighborhood map
What this means for you Summary
Snapshot
- This is a 2-bed/1.0-bath single-family listed at $110k.
Deal economics
- At list price, monthly cash flow is $95 ($1k/yr) — positive.
- The deal already cash-flows at list — no discount required.
- To meet the 1% rule (rent ≥ 1% of price), the offer needs to be $103k (6.6% below list).
- Recommended offer: $103k (6.6% below list) — sets the bar for 1% rule.
- Cap rate 7.3% vs local median 3.4% in Ada — top-decile yield for the area; either an underpriced asset or a hidden risk that comps aren't pricing in. Stress-test before assuming the spread holds.
Location & tenants
- Location reads 80/100 on livability (#119 in OH, #1,750 nationally) — a professional / high-income tenant draw. Strengths: cost of living A+, housing A+, health & safety A+; Watch: amenities F, commute F, employment D-.
- Ada Exempted Village (rural): math 65% / reading 70% proficiency, ranked #190 of 656 in OH (top 29%) — acceptable for families but not a draw, mixed tenant base, ~2y average lease.
- Market conditions: 25 active listings in the ZIP; 18 units permitted in Hardin County in 2024 (0 in 5+ unit buildings).
Forward outlook
- Local home prices are declining (-3.0%/yr); year-one equity from $761 of loan paydown is wiped out by about $3k of value loss. Plan a longer hold.
- Hardin County population projected at -18% by 2050 — secular population decline; favor cash flow + early exit over multi-decade hold.
Negotiation context
- It's been on market 37 days — a 3% lower offer ($107k) is reasonable based on typical stale-listing flexibility.
- Current owner paid $67k; list at $110k implies a 64% gain — meaningful room to come down on a strong offer.
Questions for the listing agent
- It's been on market 37 days. Have you received any prior offers? Is the seller open to a 7% concession, seller financing, or rate buy-down credit?
- Is there a deadline driving the sale (1031 exchange, divorce, estate, relocation)? That informs how much negotiation room exists.
- Schools are A-rated — typically a magnet for longer-tenancy family renters. What's the average tenant stay here, and is there a school-zone premium baked into asking?
- What's the average days-on-market for RENTAL listings here right now (not sales)? A rising rental-DOM trend means longer vacancies and softer asking-rent achievability than the comps imply.
- What's the recent tenant-quality profile in this submarket — average credit score on applications, eviction rate, late-payment / NSF rate, and stable-employment percentage? A property-management company in the area should have these aggregated.
- How much new for-sale + rental construction is in the pipeline within 1–3 miles? Heavy new supply typically softens prices + rents 12–24 months out; constrained supply supports both.
Investment metrics
- 1% rule
- 0.93% ✗
- Cap rate
- 7.33%
- Cash-on-cash
- 3.71%
- DSCR
- 1.17
- GRM
- 8.9
CMA / ARV
- ARV (median comp)
- $166,172
- List price
- $110,000
- Delta
- -33.80%
- Verdict
- UNDERPRICED
- Comps
- 20 within 1.0 mi
Show comp detail 11 sales within ~0.75 mi
| Address | Dist | Beds/Ba | Sqft | Sold | Price | $/sf | Match |
|---|---|---|---|---|---|---|---|
| 207 E Montford Ave | 0.18mi | 2/1.0 | 1,392 (+1%) | 7mo | $80,000 | $57 | 83 |
| 508 N Johnson St | 0.18mi | 2/2.0 | 1,440 (+5%) | 9mo | $110,000 | $76 | 72 |
| 405 Heistand St | 0.43mi | 3/1.0 (+1) | 1,338 (-3%) | 7mo | $120,000 | $90 | 64 |
| 424 Liberty St | 0.02mi | 3/1.0 (+1) | 1,200 (-13%) | 12mo | $40,000 | $33 | 63 |
| 724 N Main St | 0.39mi | 3/2.0 (+1) | 1,500 (+9%) | 1mo | $170,000 | $113 | 56 |
| 420 Edwards St | 0.04mi | 3/1.5 (+1) | 1,524 (+11%) | 22mo | $103,000 | $68 | 55 |
| 212 N Simon St. St | 0.20mi | 3/2.0 (+1) | 1,196 (-13%) | 6mo | $178,100 | $149 | 55 |
| 523 S Simon St | 0.61mi | 3/1.5 (+1) | 1,304 (-5%) | 8mo | $153,000 | $117 | 49 |
| 350 W Montford Ave | 0.48mi | 3/2.0 (+1) | 1,387 (+1%) | 22mo | $210,000 | $151 | 49 |
| 402 N Grand Ave | 0.59mi | 3/2.0 (+1) | 1,442 (+5%) | 10mo | $220,000 | $153 | 47 |
| 543 N Gilbert St | 0.39mi | 3/1.0 (+1) | 1,488 (+8%) | 24mo | $97,000 | $65 | 44 |
Match score weights: distance 35% · size 25% · config 20% · recency 20%. Top-matched comps best support the ARV.
Projected returns pro-forma
-3.0% appreciation · 3.0% rent growth · sell at horizon
- IRR
- -10.5%
- Equity multiple
- 0.62×
- Total profit
- $-11,774
- Equity at exit
- $16,401
- IRR
- -1.2%
- Equity multiple
- 0.92×
- Total profit
- $-2,492
- Equity at exit
- $9,511
Cash invested: $30,800 (down + closing). Projections, not guarantees.
Landlord ↔ Tenant lean methodology
- Overall (STATE)
- 73 Landlord-Friendly
- State Ohio
- 73 Landlord-Friendly · R+6
- County
- — inherits STATE
- City
- — inherits STATE
ZIP-level market 45810
- Home prices YoY
- -31.1%
- Active inventory
- 25
- Price-to-rent
- 8.9×
Monthly cashflow live
- Estimated rent
- $1,027 medium interval (Pro) →
- Mortgage (P&I)
- −$577
- Tax from tax record
- −$94 /mo · $1,124/yr
- Insurance
- −$46
- HOA
- −$0
- Vacancy / Maint / Mgmt
- −$216
- Net cashflow
- $95
Break-even live
UW: 25.0% down · 7.5% · 30yr · 1.5% tax · 5.0% vac · 8.0% maint · 8.0% mgmt
Financing live
Cash to close
- Down payment
- $27,500
- Closing costs
- $3,300
- Reserves months
- —
- Total cash needed
- —
Loan-product check · same deal, 3 products live
Conventional
25% down · 7.5% · 30yr
- Down + closing
- —
- Monthly P&I
- —
- Monthly cashflow
- —
- DSCR
- —
- Eligible?
- —
Personal DTI + credit; lowest rate.
DSCR
20% down · 8.5% · 30yr
- Down + closing
- —
- Monthly P&I
- —
- Monthly cashflow
- —
- DSCR
- —
- Eligible?
- —
No personal income docs; deal must DSCR.
Hard money
10% down · 12.0% · 12mo
- Down + closing
- —
- Monthly P&I
- —
- Monthly cashflow
- —
- DSCR
- —
- Eligible?
- —
Short-term bridge; refi at stabilization.
Listing history 19 events
-
2026-06-18days on market $110,000 Active 37 DOM
-
2026-06-17days on market $110,000 Active 36 DOM
-
2026-06-16days on market $110,000 Active 35 DOM
-
2026-06-15days on market $110,000 Active 34 DOM
-
2026-06-13days on market $110,000 Active 32 DOM
-
2026-06-12days on market $110,000 Active 31 DOM
-
2026-06-09days on market $110,000 Active 28 DOM
-
2026-06-09price $110,000 Active 27 DOM
-
2026-06-08days on market $120,000 Active 27 DOM
-
2026-06-07days on market $120,000 Active 26 DOM
-
2026-06-07days on market $120,000 Active 25 DOM
-
2026-06-04days on market $120,000 Active 22 DOM
-
2026-06-02days on market $120,000 Active 21 DOM
-
2026-06-01days on market $120,000 Active 20 DOM
-
2026-05-31days on market $120,000 Active 19 DOM
-
2026-05-12$120,000 Active 661-char remark
-
2015-04-10soldstatus $67,000
-
2015-02-24soldstatus $67,000
-
1992-03-13soldstatus $36,000
ⓘ Source: listings_history table (triggers on properties + properties_extension) + one-shot
backfill from property_details.listing_events for pre-trigger history.
Tax reassessment forecast OH · Partial reset (capped growth)
- Current annual tax
- $1,124 · $94/mo
- Projected year-2 tax
- $1,420 · $118/mo
- Expected delta
- +$296/yr (+$25/mo · 26.4%)
ⓘ Screening estimate from a state-policy table — verify with the county assessor before closing.
Climate risk First Street
- Flood 1/10 Low 0% chance over 30 yrs
- Wildfire 1/10 Low
- Heat 3/10 Moderate 7 d/yr ≥100°F today · 17 d/yr by 30 yrs out
- Wind 2/10 Low
- Air quality 2/10 Low 1 unhealthy d/yr today · 2 by 30 yrs out
Nearby sold comps map
Loading sold comps map…
Walkable amenities ~0.75 mi
Loading nearby amenities…
Taxation est. · year 1
- Rental income
- $12,327
- − Mortgage interest
- −$6,162
- − Property taxes
- −$1,124
- − Insurance
- −$550
- − Repairs & maintenance
- −$986
- − Management
- −$986
- − Depreciation
- −$3,200
- Taxable loss
- −$681
- Est. tax savings @ 24.0%
- +$163
- After-tax cash flow
- $1,306/yr
For passive investors: Depreciation is non-cash, so a rental often shows a tax loss while cash-flowing — sheltering income. Rental losses are passive: they offset passive income freely, and up to $25,000/yr can offset ordinary (W-2) income if you actively participate and your MAGI is under $100k (phasing out to $0 by $150k); unused losses carry forward. On sale, claimed depreciation is recaptured at up to 25%, and gains may owe capital-gains tax (a 1031 exchange can defer both). Figures are a year-1 estimate at your 24.0% rate — not tax advice; consult a CPA.
Schools (NCES district)
- District
- Ada Exempted Village
- NCES district ID
- 3904518
- Math proficiency
- 65% ▼ -10.00%
- Reading proficiency
- 70% ▼ -5.00%
- Median HH income
- $42,321
- Composite
- 56.55/100
- National rank
- #1149
- State rank
- #190 of 656 in OH
Livability — Ada
- Score
- 80/100
- State rank
- #119
- US rank
- #1750
Category grades
Schools grade is shown separately in the Schools card above.
Census & demographics
- Census place
- Ada, OH
- County
- Hardin · 33,287 people
- Population (ZIP)
- 7,345
- Household income
- $59,065
- Rent vs Own
- Severe rent burden
- 13.9
Population outlook (Hardin County) Hauer SSP2
- Today (2025)
- 31,000 people
- By 2030
- 30,031 · -3.1%
- By 2040
- 27,500 · -11.3%
- By 2050
- 25,265 · -18.5%
- By 2075
- 20,485 · -33.9%
- By 2100
- 16,031 · -48.3%
Race, ethnicity, and origin ACS 2023
- Neighborhood character
- Predominantly White (86%)
- Race & ethnicity
- White 86% Two or more races 6% Hispanic / Latino 6% Black 3% Asian 2%
- Hispanic origin (detail)
- Mexican 4%
- Common ancestry
- Slovak 7% Iranian 3% Lithuanian 3%
- Foreign-born
- 3% · China, South Korea
- Languages at home
- 95% English-only · Spanish 2% Chinese 1% Arabic 1%
Political lean MEDSL · Hardin
- 2024 margin
- Solid R (+54.7) · D 22.2% · R 76.9%
- 2008→2024 swing
- -33.8pp toward R · 2008: -20.9pp · 2024: -54.7pp
- All cycles
- 2024: R+54.7 2020: R+52.0 2016: R+47.2 2012: R+23.5 2008: R+20.9
Not yet ingested
- Civics
- —
Market trends
- HPI YoY
- ▼ -107.51%
- Current HPI
- 237.9299
- Rent YoY
- —
- Metro
- —
- State GDP YoY
- ▲ 1.98%
- F500 in state
- 48
Industry mix (Fortune 500 HQ in OH)
| Industry | F500 HQs | Revenue |
|---|---|---|
| Insurance | 3 | $145B |
|
||
| Industrial Machinery | 3 | $49B |
|
||
| Financial Services | 3 | $24B |
|
||
| Consumer Goods | 2 | $93B |
|
||
| Aerospace / Defense | 2 | $47B |
|
||
| Utilities | 2 | $33B |
|
||
Price history
+205.6% since first listed5 events — show timeline
- 2026-06-08 Price Changed $110,000 WCARE
- 2026-05-12 Listed $120,000 WCARE
- 2015-04-10 Sold (Public Records) $67,000 Public Records
- 2015-02-24 Sold (Public Records) $67,000 Public Records
- 1992-03-13 Sold (Public Records) $36,000 Public Records
Property tax history
+2.2%/yrLatest (2025): $1,124 · +0.8% YoY. Source: county tax records.
Cash-flow waterfall
monthlySold comps — $/sqft
last 12 mo · ≤1 miLoading sold comps…