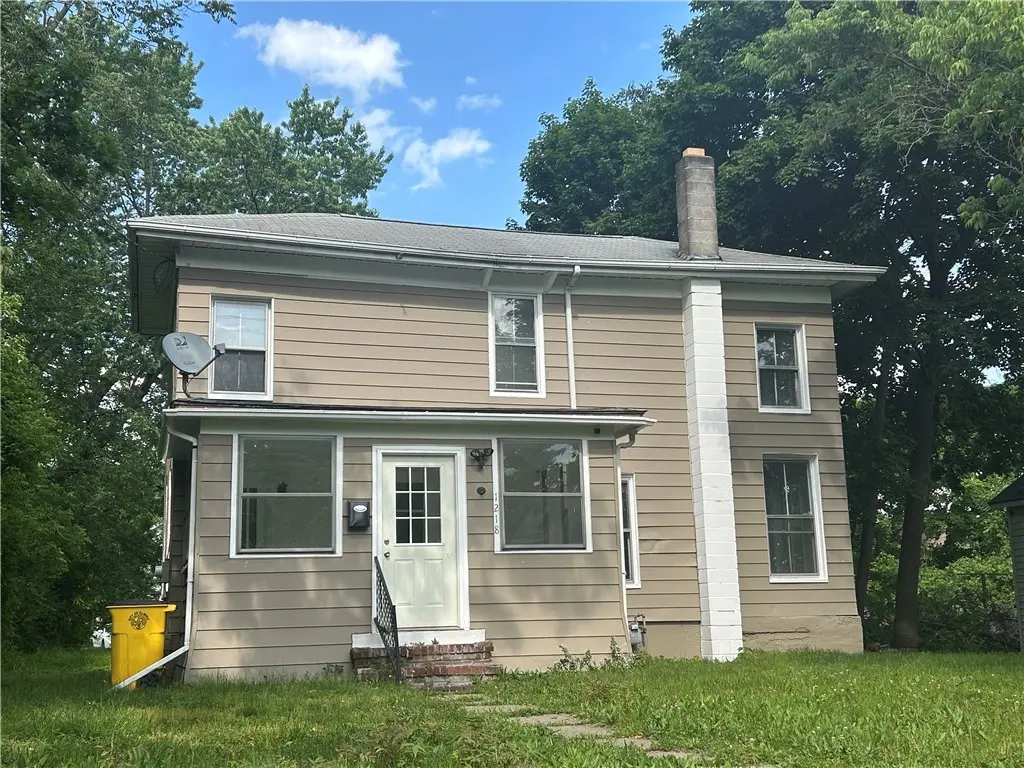
1218 Lackawanna Ave · Elmira, NY
Flood risk 1/10 · Minimal
- FEMA flood zone
- X (shaded)
- Chance of flooding over 30 yrs
- 0.0%
- Est. flood insurance / yr
- $473 – $860
Fire risk 3/10 · Minor
- Est. fire insurance / yr
- $691 – $1,283
Heat risk 3/10 · Minor
- Hot days now (above 97°F)
- 7 days/yr
- Hot days in 30 yrs
- 16 days/yr
Wind risk 1/10 · Minimal
- Chance of severe wind over 30 yrs
- 1.0%
Air-quality risk 1/10 · Minimal
- Unhealthy air days now
- 0 days/yr
- Unhealthy air days in 30 yrs
- 0 days/yr
Risk factors via First Street. Map © Google.
Why this score? — see what drove the C+ grade
The composite is a weighted blend of 9 inputs, each scored 0–100. Each bar is that input's sub-score; the figure is the points it added to the 100-point composite (weight × sub-score).
- Cash flow +25.0/30.0
- Appreciation +10.0/10.0
- DSCR +8.2/10.0
- 1% rule +6.6/10.0
- Livability +3.1/5.0
- Rent growth +2.5/5.0
- Condition / age +2.5/5.0
- Schools +2.4/10.0
- ARV discount +0.1/15.0
$115,000
🖨 Deal sheet 📄 Offer letter ✓ Due diligence
Listing remarks MLS
Welcome to this 3-bedroom, 1-bathroom home with updates and inviting spaces throughout! Featuring new flooring in the kitchen, laundry room, and bathroom, this home also offers the convenience of a first-floor laundry area. The bathroom has updated plumbing and a new vanity. Relax in the spacious, enclosed porch—a perfect spot to enjoy summer days, read a book, or sip your morning coffee. Close to grocery stores, schools, and highway access, with a sizable backyard ideal for outdoor activities.
Key facts
- Gutter on sun porch
- 1st floor laundry
- Mud room
Tags
Property features AI
Exterior
- Parking: No garage
- Utilities: Cable available; Public water (connected); Sewer connected
- Home design: Two-story existing residence; Stone foundation
- Construction: Aluminum siding; Stucco exterior
- Exterior features: Gravel driveway; Rectangular residential lot; City street frontage
Interior
- Kitchen: Free-standing range; Oven; Range hood; Exhaust fan; Refrigerator; Eat-in kitchen
- Bedrooms: Total rooms: 7 (includes living areas; bedroom count not specified)
- Flooring: Carpet; Vinyl; Varied flooring
- Bathrooms: 1 full bathroom
- Heating & cooling: Gas forced-air heating
- Interior features: Thermal windows; Separate/formal dining room; Eat-in kitchen; Enclosed porch; Porch; Sunroom / Florida room
- Laundry & utility: Main level laundry; Gas water heater
Neighborhood map
What this means for you Summary
Snapshot
- This is a 3-bed/1.0-bath single-family listed at $115k.
Deal economics
- At list price, monthly cash flow is $252 ($3k/yr) — positive.
- The deal already cash-flows at list — no discount required.
- Meets the 1% rule at list price ($1k rent vs $115k).
Location & tenants
- Location reads 62/100 on livability (#832 in NY) — a middle-class / working-renter tenant base. Strengths: cost of living A+, housing A+, health & safety A+; Watch: schools F, crime F, amenities F.
- Elmira City School District (urban): math 23% / reading 35% proficiency, ranked #580 of 590 in NY (top 98%) — low school quality limits family demand, transient renter base, plan for 1-2y turnover.
- Market conditions: 78 active listings in the ZIP; 5 comparable units currently listed for rent nearby; rentals lingering (median 44d on market — plan ~5-8 weeks vacancy on turnover, expect pricing pressure); 100% of comp listings sitting > 30 days — soft ceiling on asking rent; 91 units permitted in Chemung County in 2024 (63 in 5+ unit buildings).
Forward outlook
- In year one you build about $12k of equity ($795 loan paydown + $12k appreciation (10.0% local appreciation)).
- Chemung County population projected at -17% by 2050 — secular population decline; favor cash flow + early exit over multi-decade hold.
- At projected returns (10.0% appreciation + 3.0% rent growth), your $32k cash investment doubles in ~3 years — after that, you're playing with house money.
- By year 3, paydown + projected appreciation supports a ~$31k cash-out refi (75% LTV) — recoverable capital for the next deal without selling this one.
Negotiation context
- Only 8 days on market — expect competitive offers; lowballing is unlikely to land.
- 8 sale attempts since 22y ago with the ask held roughly flat each time — persistent listings suggest the price (not the market) is what's stuck; bring a comps-based counter.
- Current owner paid $57k; list at $115k implies a 102% gain — meaningful room to come down on a strong offer.
Risks & watch-outs
- Watch-outs: built in 1890 — expect roof / HVAC / electrical / plumbing capex.
Questions for the listing agent
- Built in 1890 — when were the roof, HVAC, electrical panel, plumbing, and water heater last replaced?
- Is there a deadline driving the sale (1031 exchange, divorce, estate, relocation)? That informs how much negotiation room exists.
- Schools are F-rated, which usually means shorter tenancies and higher turnover. Who's the typical renter profile here, and what's been the actual vacancy rate?
- Crime grade is F in this area — have there been break-ins, vandalism, or insurance claims at this property in the last 3 years? What carrier currently insures it and at what premium?
- What's the average days-on-market for RENTAL listings here right now (not sales)? A rising rental-DOM trend means longer vacancies and softer asking-rent achievability than the comps imply.
- What's the recent tenant-quality profile in this submarket — average credit score on applications, eviction rate, late-payment / NSF rate, and stable-employment percentage? A property-management company in the area should have these aggregated.
- How much new for-sale + rental construction is in the pipeline within 1–3 miles? Heavy new supply typically softens prices + rents 12–24 months out; constrained supply supports both.
Investment metrics
- 1% rule
- 1.16% ✓
- Cap rate
- 8.92%
- Cash-on-cash
- 9.39%
- DSCR
- 1.42
- GRM
- 7.2
CMA / ARV
- ARV (on-the-fly)
- $98,728
- Comps found
- 12
Show comp detail 12 sales within ~0.75 mi
| Address | Dist | Beds/Ba | Sqft | Sold | Price | $/sf | Match |
|---|---|---|---|---|---|---|---|
| 1230 Lake St | 0.23mi | 4/1.5 (+1) | 1,768 (+0%) | 13mo | $124,900 | $71 | 71 |
| 1227 Lake St | 0.20mi | 3/1.5 | 1,664 (-6%) | 11mo | $49,000 | $29 | 70 |
| 1201 Magee St | 0.35mi | 3/2.0 | 1,686 (-4%) | 8mo | $176,000 | $104 | 66 |
| 918 Magee St | 0.53mi | 4/1.0 (+1) | 1,812 (+3%) | 1mo | $112,000 | $62 | 65 |
| 1213 Magee St | 0.37mi | 3/2.0 | 1,908 (+8%) | 6mo | $189,361 | $99 | 60 |
| 1315 Grand Central Ave | 0.11mi | 4/1.5 (+1) | 1,560 (-12%) | 15mo | $54,000 | $35 | 56 |
| 319 Webber Pl | 0.69mi | 3/1.5 | 1,716 (-3%) | 8mo | $145,000 | $84 | 55 |
| 756 Carpenter St | 0.50mi | 4/2.0 (+1) | 1,896 (+8%) | 2mo | $105,000 | $55 | 54 |
| 218 Grant St | 0.43mi | 2/1.0 (-1) | 1,580 (-10%) | 5mo | $89,000 | $56 | 53 |
| 950 N Main St | 0.54mi | 4/1.5 (+1) | 1,644 (-7%) | 7mo | $37,000 | $23 | 50 |
| 957 Oak St | 0.44mi | 4/1.5 (+1) | 1,626 (-8%) | 13mo | $54,590 | $34 | 49 |
| 314 W Washington Ave | 0.72mi | 4/1.0 (+1) | 1,916 (+9%) | 12mo | $100,000 | $52 | 37 |
Match score weights: distance 35% · size 25% · config 20% · recency 20%. Top-matched comps best support the ARV.
Projected returns pro-forma
10.0% appreciation · 3.0% rent growth · sell at horizon
- IRR
- 31.1%
- Equity multiple
- 3.44×
- Total profit
- $78,711
- Equity at exit
- $103,601
- IRR
- 26.9%
- Equity multiple
- 7.81×
- Total profit
- $219,221
- Equity at exit
- $223,420
Cash invested: $32,200 (down + closing). Projections, not guarantees.
Landlord ↔ Tenant lean methodology
- Overall (STATE)
- 15 Strongly Tenant-Friendly
- State New York
- 15 Strongly Tenant-Friendly · D+10
- County
- — inherits STATE
- City
- — inherits STATE
ZIP-level market 14901
- Home prices YoY
- 15.9%
- Active inventory
- 78
- Price-to-rent
- 7.2×
Monthly cashflow live
- Estimated rent
- $1,338 high interval (Pro) →
- Mortgage (P&I)
- −$603
- Tax from tax record
- −$154 /mo · $1,850/yr
- Insurance
- −$48
- HOA
- −$0
- Vacancy / Maint / Mgmt
- −$281
- Net cashflow
- $252
Break-even live
UW: 25.0% down · 7.5% · 30yr · 1.5% tax · 5.0% vac · 8.0% maint · 8.0% mgmt
Financing live
Cash to close
- Down payment
- $28,750
- Closing costs
- $3,450
- Reserves months
- —
- Total cash needed
- —
Loan-product check · same deal, 3 products live
Conventional
25% down · 7.5% · 30yr
- Down + closing
- —
- Monthly P&I
- —
- Monthly cashflow
- —
- DSCR
- —
- Eligible?
- —
Personal DTI + credit; lowest rate.
DSCR
20% down · 8.5% · 30yr
- Down + closing
- —
- Monthly P&I
- —
- Monthly cashflow
- —
- DSCR
- —
- Eligible?
- —
No personal income docs; deal must DSCR.
Hard money
10% down · 12.0% · 12mo
- Down + closing
- —
- Monthly P&I
- —
- Monthly cashflow
- —
- DSCR
- —
- Eligible?
- —
Short-term bridge; refi at stabilization.
Rent comps 5 comps
| Address | Beds | Baths | Sqft | Rent | $/sqft | DOM | Units | Dist |
|---|---|---|---|---|---|---|---|---|
| 355 W Clinton St Unit 1 Elmira, NY | 3.0 | 1.5 | 1650 | $1,400 | $0.85 | 43d | 1 | 1.09mi |
| 357 W Clinton St Unit 1 Elmira, NY | 2.0 | 1.5 | 1650 | $1,500 | $0.91 | 43d | 1 | 1.10mi |
| 106 W 2nd St Unit A Elmira, NY | 3.0 | 1.0 | 1395 | $1,400 | $1.00 | 43d | 1 | 1.11mi |
| 454 W 2nd St Unit 1 Elmira, NY | 2.0 | 1.0 | 1400 | $1,000 | $0.71 | 43d | 1 | 1.34mi |
| 514 W 1st St Unit A Elmira, NY | 4.0 | 1.0 | 1416 | $1,275 | $0.90 | 43d | 1 | 1.47mi |
Listing history 8 events
-
2026-06-19days on market $115,000 Active 8 DOM
-
2026-06-18days on market $115,000 Active 7 DOM
-
2026-06-17days on market $115,000 Active 6 DOM
-
2026-06-16days on market $115,000 Active 5 DOM
-
2026-06-15days on market $115,000 Active 4 DOM
-
2026-06-14days on market $115,000 Active 2 DOM
-
2026-06-12remarks 699-char remark
-
2026-06-12$115,000 Active 1 DOM
ⓘ Source: listings_history table (triggers on properties + properties_extension) + one-shot
backfill from property_details.listing_events for pre-trigger history.
Tax reassessment forecast NY · Partial reset (capped growth)
- Current annual tax
- $1,850 · $154/mo
- Projected year-2 tax
- $1,896 · $158/mo
- Expected delta
- +$47/yr (+$4/mo · 2.5%)
ⓘ Screening estimate from a state-policy table — verify with the county assessor before closing.
Climate risk First Street
- Flood 1/10 Low FEMA zone X (shaded) · 0% chance over 30 yrs
- Wildfire 3/10 Moderate
- Heat 3/10 Moderate 7 d/yr ≥97°F today · 16 d/yr by 30 yrs out
- Wind 1/10 Low 100% chance of damaging wind over 30 yrs
- Air quality 1/10 Low 0 unhealthy d/yr today · 0 by 30 yrs out
Nearby sold comps map
Loading sold comps map…
Walkable amenities ~0.75 mi
Loading nearby amenities…
Taxation est. · year 1
- Rental income
- $16,058
- − Mortgage interest
- −$6,442
- − Property taxes
- −$1,850
- − Insurance
- −$575
- − Repairs & maintenance
- −$1,285
- − Management
- −$1,285
- − Depreciation
- −$3,345
- Taxable income
- $1,277
- Est. tax owed @ 24.0%
- −$306
- After-tax cash flow
- $2,718/yr
For passive investors: Depreciation is non-cash, so a rental often shows a tax loss while cash-flowing — sheltering income. Rental losses are passive: they offset passive income freely, and up to $25,000/yr can offset ordinary (W-2) income if you actively participate and your MAGI is under $100k (phasing out to $0 by $150k); unused losses carry forward. On sale, claimed depreciation is recaptured at up to 25%, and gains may owe capital-gains tax (a 1031 exchange can defer both). Figures are a year-1 estimate at your 24.0% rate — not tax advice; consult a CPA.
Schools (NCES district)
- District
- Elmira City School District
- NCES district ID
- 3610560
- Math proficiency
- 23% ▼ -7.00%
- Reading proficiency
- 35% ▲ 7.00%
- Median HH income
- $40,180
- Composite
- 24.39/100
- National rank
- #7688
- State rank
- #580 of 590 in NY
Livability — Elmira
- Score
- 62/100
- State rank
- #832
- US rank
- #16139
Category grades
Schools grade is shown separately in the Schools card above.
Census & demographics
- Census place
- Elmira, NY
- City population
- 14,276
- Population (ZIP)
- 14,430
Population outlook (Chemung County) Hauer SSP2
- Today (2025)
- 82,931 people
- By 2030
- 80,356 · -3.1%
- By 2040
- 74,745 · -9.9%
- By 2050
- 69,012 · -16.8%
- By 2075
- 55,689 · -32.8%
- By 2100
- 41,428 · -50.0%
Race, ethnicity, and origin ACS 2023
- Neighborhood character
- Predominantly White (70%)
- Race & ethnicity
- White 70% Black 15% Two or more races 7% Hispanic / Latino 7% Asian 1%
- Hispanic origin (detail)
- Mexican 1% Puerto Rican 3%
- Common ancestry
- Romanian 4% Slovak 3% Iranian 2%
- Foreign-born
- 4% · Canada, China
- Languages at home
- 93% English-only · Spanish 3% Russian/Polish/Slavic 1% Chinese 1%
Political lean MEDSL · Chemung
- 2024 margin
- R (+16.8) · D 41.6% · R 58.4%
- 2008→2024 swing
- -15.6pp toward R · 2008: -1.2pp · 2024: -16.8pp
- All cycles
- 2024: R+16.8 2020: R+13.4 2016: R+20.0 2012: R+2.9 2008: R+1.2
Not yet ingested
- Civics
- —
Market trends
- HPI YoY
- ▲ 32.34%
- Current HPI
- 236.2674
- Rent YoY
- —
- Metro
- —
- State GDP YoY
- ▲ 2.60%
- F500 in state
- 92
Industry mix (Fortune 500 HQ in NY)
| Industry | F500 HQs | Revenue |
|---|---|---|
| Financial Services | 10 | $950B |
|
||
| Consumer Goods | 9 | $162B |
|
||
| Insurance | 4 | $225B |
|
||
| Telecommunications | 2 | $144B |
|
||
| Pharmaceuticals | 2 | $112B |
|
||
| Media / Entertainment | 2 | $69B |
|
||
Price history
+411.1% since first listed17 events — show timeline
- 2026-06-11 Listed $115,000 UNYREIS
- 2025-03-31 Sold (Public Records) $57,000 Public Records
- 2025-03-18 Sold (MLS) $57,000 UNYREIS
- 2025-02-13 Listed — UNYREIS
- 2024-10-25 Listed $69,900 UNYREIS
- 2023-11-28 Sold (MLS) $30,000 UNYREIS
- 2023-03-03 Listed $39,900 UNYREIS
- 2022-08-16 Listing Removed — UNYREIS
- 2022-08-08 Listed $44,900 UNYREIS
- 2013-01-28 Listing Removed — UNYREIS
- 2012-07-27 Listing Removed — UNYREIS
- 2012-01-31 Listed $19,900 UNYREIS
- 2012-01-31 Listed $18,400 UNYREIS
- 2005-05-31 Sold (Public Records) $24,250 Public Records
- 2005-05-27 Sold (MLS) $24,250 UNYREIS
- 2004-10-29 Listed $31,000 UNYREIS
- 1991-04-10 Sold (Public Records) $22,500 Public Records
Property tax history
+7.1%/yrLatest (2025): $1,850 · -16.0% YoY. Source: county tax records.
Cash-flow waterfall
monthlySold comps — $/sqft
last 12 mo · ≤1 miLoading sold comps…