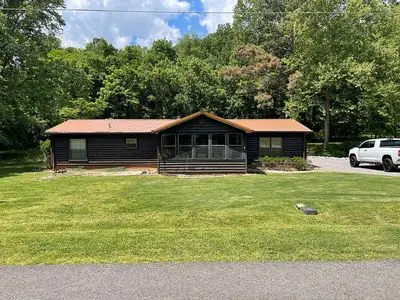
207 Oriole Dr · Eddyville, KY
Flood risk 9/10 · Severe
- FEMA flood zone
- X (unshaded)
- Chance of flooding over 30 yrs
- 0.99%
- Est. flood insurance / yr
- $507 – $1,088
Fire risk 4/10 · Minor
- Est. fire insurance / yr
- $839 – $1,559
Heat risk 5/10 · Moderate
- Hot days now (above 109°F)
- 7 days/yr
- Hot days in 30 yrs
- 19 days/yr
Wind risk 3/10 · Minor
- Chance of severe wind over 30 yrs
- 6.0%
Air-quality risk 1/10 · Minimal
- Unhealthy air days now
- 0 days/yr
- Unhealthy air days in 30 yrs
- 0 days/yr
Risk factors via First Street. Map © Google.
Why this score? — see what drove the B+ grade
The composite is a weighted blend of 9 inputs, each scored 0–100. Each bar is that input's sub-score; the figure is the points it added to the 100-point composite (weight × sub-score).
- Cash flow +30.0/30.0
- ARV discount +15.0/15.0
- 1% rule +10.0/10.0
- DSCR +10.0/10.0
- Schools +4.1/10.0
- Livability +3.5/5.0
- Rent growth +2.5/5.0
- Condition / age +2.5/5.0
- Appreciation +0.0/10.0
$145,000
🖨 Deal sheet 📄 Offer letter ✓ Due diligence
Listing remarks
3 Bedroom 2 bath close to Lake and Interstate this is great weekend or all year home. Included: All furniture & amp; amenities (excluding the master bedroom suite, washer, and dryer) - Comes with a riding mower stored in the storage building. Highlights: - Newer metal roof - Newer HVAC system Asking $145,000.
Key facts
- Storage building
- Newer metal roof
- Newer hvac system
Tags
Neighborhood map
What this means for you Summary
Snapshot
- This is a 3-bed/2.0-bath single-family listed at $145k.
Deal economics
- At list price, monthly cash flow is $1k ($15k/yr) — positive.
- The deal already cash-flows at list — no discount required.
- Meets the 1% rule at list price ($3k rent vs $145k).
- Recommended offer: $141k (3.0% below list) — sets the bar for market timing.
- Cap rate 17.3% vs local median 3.7% in Eddyville — top-decile yield for the area; either an underpriced asset or a hidden risk that comps aren't pricing in. Stress-test before assuming the spread holds.
Location & tenants
- Location reads 69/100 on livability (#174 in KY) — a middle-class / working-renter tenant base. Strengths: crime A+, cost of living A+, housing A; Watch: schools D+, amenities F, commute F.
- Lyon County (rural): math 45% / reading 52% proficiency, ranked #13 of 165 in KY (top 8%) — families likely to look elsewhere, expect single-tenant / working-renter base with shorter leases.
- Market conditions: 117 active listings in the ZIP; 3 units permitted in Lyon County in 2024 (0 in 5+ unit buildings).
Forward outlook
- Local home prices are declining (-3.0%/yr); year-one equity from $1k of loan paydown is wiped out by about $4k of value loss. Plan a longer hold.
- Lyon County population projected to shrink 3% by 2050 — rents likely to lag national; underwrite the cash flow, not the appreciation.
- At projected returns (-3.0% appreciation + 3.0% rent growth), your $41k cash investment doubles in ~4 years — after that, you're playing with house money.
Negotiation context
- It's been on market 37 days — a 3% lower offer ($141k) is reasonable based on typical stale-listing flexibility.
- Current owner paid $58k; list at $145k implies a 149% gain — meaningful room to come down on a strong offer.
Risks & watch-outs
- Watch-outs: flood insurance adds $66/mo.
- Climate carrying-cost: severe flood risk; extreme-heat days projected 7→19/yr by 2055 (HVAC capex compounding) — expect insurance premiums to compound above CPI over the hold.
Questions for the listing agent
- It's been on market 37 days. Have you received any prior offers? Is the seller open to a 3% concession, seller financing, or rate buy-down credit?
- What's the actual annual flood-insurance premium (NFIP or private), and is the property in a SFHA with mandatory coverage?
- Is there a deadline driving the sale (1031 exchange, divorce, estate, relocation)? That informs how much negotiation room exists.
- Schools are D-rated, which usually means shorter tenancies and higher turnover. Who's the typical renter profile here, and what's been the actual vacancy rate?
- What's the average days-on-market for RENTAL listings here right now (not sales)? A rising rental-DOM trend means longer vacancies and softer asking-rent achievability than the comps imply.
- What's the recent tenant-quality profile in this submarket — average credit score on applications, eviction rate, late-payment / NSF rate, and stable-employment percentage? A property-management company in the area should have these aggregated.
- How much new for-sale + rental construction is in the pipeline within 1–3 miles? Heavy new supply typically softens prices + rents 12–24 months out; constrained supply supports both.
Investment metrics
- 1% rule
- 1.91% ✓
- Cap rate
- 17.28%
- Cash-on-cash
- 39.24%
- DSCR
- 2.75
- GRM
- 4.4
CMA / ARV
- ARV (on-the-fly)
- $234,000
- Comps found
- 4
Show comp detail 4 sales within ~0.75 mi
| Address | Dist | Beds/Ba | Sqft | Sold | Price | $/sf | Match |
|---|---|---|---|---|---|---|---|
| 76 Oriole Dr | 0.13mi | 3/1.0 | 1,328 (-15%) | 8mo | $180,000 | $136 | 59 |
| 1537 Ky-1055 | 0.51mi | 2/2.0 (-1) | 1,516 (-3%) | 10mo | $385,000 | $254 | 58 |
| 44 Whipperwill Dr | 0.40mi | 3/2.0 | 1,792 (+15%) | 6mo | $215,000 | $120 | 51 |
| 1463 W State Rte 730 | 0.36mi | 3/1.0 | 1,332 (-15%) | 24mo | $200,000 | $150 | 35 |
Match score weights: distance 35% · size 25% · config 20% · recency 20%. Top-matched comps best support the ARV.
Projected returns pro-forma
-3.0% appreciation · 3.0% rent growth · sell at horizon
- IRR
- 33.2%
- Equity multiple
- 2.40×
- Total profit
- $56,814
- Equity at exit
- $21,620
- IRR
- 40.2%
- Equity multiple
- 4.77×
- Total profit
- $152,872
- Equity at exit
- $12,537
Cash invested: $40,600 (down + closing). Projections, not guarantees.
Landlord ↔ Tenant lean methodology
- Overall (STATE)
- 83 Strongly Landlord-Friendly
- State Kentucky
- 83 Strongly Landlord-Friendly · R+16
- County
- — inherits STATE
- City
- — inherits STATE
ZIP-level market 42038
- Home prices YoY
- -30.7%
- Active inventory
- 117
- Price-to-rent
- 4.4×
Monthly cashflow live
- Estimated rent
- $2,769 medium interval (Pro) →
- Mortgage (P&I)
- −$760
- Tax from tax record
- −$39 /mo · $467/yr
- Insurance
- −$60
- Flood insurance flood zone
- −$66 /mo · $798/yr
- HOA
- −$0
- Vacancy / Maint / Mgmt
- −$581
- Net cashflow
- $1,261
Break-even live
UW: 25.0% down · 7.5% · 30yr · 1.5% tax · 5.0% vac · 8.0% maint · 8.0% mgmt
Financing live
Cash to close
- Down payment
- $36,250
- Closing costs
- $4,350
- Reserves months
- —
- Total cash needed
- —
Loan-product check · same deal, 3 products live
Conventional
25% down · 7.5% · 30yr
- Down + closing
- —
- Monthly P&I
- —
- Monthly cashflow
- —
- DSCR
- —
- Eligible?
- —
Personal DTI + credit; lowest rate.
DSCR
20% down · 8.5% · 30yr
- Down + closing
- —
- Monthly P&I
- —
- Monthly cashflow
- —
- DSCR
- —
- Eligible?
- —
No personal income docs; deal must DSCR.
Hard money
10% down · 12.0% · 12mo
- Down + closing
- —
- Monthly P&I
- —
- Monthly cashflow
- —
- DSCR
- —
- Eligible?
- —
Short-term bridge; refi at stabilization.
Listing history 17 events
-
2026-06-18days on market $145,000 Active 37 DOM
-
2026-06-17days on market $145,000 Active 36 DOM
-
2026-06-16days on market $145,000 Active 35 DOM
-
2026-06-15days on market $145,000 Active 34 DOM
-
2026-06-13days on market $145,000 Active 32 DOM
-
2026-06-12days on market $145,000 Active 31 DOM
-
2026-06-09days on market $145,000 Active 28 DOM
-
2026-06-08days on market $145,000 Active 27 DOM
-
2026-06-07days on market $145,000 Active 26 DOM
-
2026-06-07days on market $145,000 Active 25 DOM
-
2026-06-04days on market $145,000 Active 22 DOM
-
2026-06-02days on market $145,000 Active 21 DOM
-
2026-06-01days on market $145,000 Active 20 DOM
-
2026-05-31days on market $145,000 Active 19 DOM
-
2026-05-31days on market $145,000 Active 18 DOM
-
2026-05-12$145,000 Active 320-char remark
-
2014-11-12soldstatus $58,300
ⓘ Source: listings_history table (triggers on properties + properties_extension) + one-shot
backfill from property_details.listing_events for pre-trigger history.
Tax reassessment forecast KY · Resets to sale price
- Current annual tax
- $467 · $39/mo
- Projected year-2 tax
- $1,247 · $104/mo
- Expected delta
- +$780/yr (+$65/mo · 167.0%)
ⓘ Screening estimate from a state-policy table — verify with the county assessor before closing.
Climate risk First Street
- Flood 9/10 Extreme FEMA zone X (unshaded) · 99% chance over 30 yrs
- Wildfire 4/10 Moderate
- Heat 5/10 Major 7 d/yr ≥109°F today · 19 d/yr by 30 yrs out
- Wind 3/10 Moderate 6% chance of damaging wind over 30 yrs
- Air quality 1/10 Low 0 unhealthy d/yr today · 0 by 30 yrs out
Nearby sold comps map
Loading sold comps map…
Walkable amenities ~0.75 mi
Loading nearby amenities…
Taxation est. · year 1
- Rental income
- $33,223
- − Mortgage interest
- −$8,122
- − Property taxes
- −$467
- − Insurance
- −$1,522
- − Repairs & maintenance
- −$2,658
- − Management
- −$2,658
- − Depreciation
- −$4,218
- Taxable income
- $13,578
- Est. tax owed @ 24.0%
- −$3,259
- After-tax cash flow
- $11,874/yr
For passive investors: Depreciation is non-cash, so a rental often shows a tax loss while cash-flowing — sheltering income. Rental losses are passive: they offset passive income freely, and up to $25,000/yr can offset ordinary (W-2) income if you actively participate and your MAGI is under $100k (phasing out to $0 by $150k); unused losses carry forward. On sale, claimed depreciation is recaptured at up to 25%, and gains may owe capital-gains tax (a 1031 exchange can defer both). Figures are a year-1 estimate at your 24.0% rate — not tax advice; consult a CPA.
Schools (NCES district)
- District
- Lyon County
- NCES district ID
- 2103690
- Math proficiency
- 45% ▼ -15.00%
- Reading proficiency
- 52% ▼ -13.00%
- Median HH income
- $43,899
- Composite
- 40.94/100
- National rank
- #3607
- State rank
- #13 of 165 in KY
Livability — Eddyville
- Score
- 69/100
- State rank
- #174
- US rank
- #8755
Category grades
Schools grade is shown separately in the Schools card above.
Census & demographics
- Population (ZIP)
- 6,045
Population outlook (Lyon County) Hauer SSP2
- Today (2025)
- 8,330 people
- By 2030
- 8,308 · -0.3%
- By 2040
- 8,196 · -1.6%
- By 2050
- 8,069 · -3.1%
- By 2075
- 8,131 · -2.4%
- By 2100
- 6,856 · -17.7%
Race, ethnicity, and origin ACS 2023
- Neighborhood character
- Predominantly White (87%)
- Race & ethnicity
- White 87% Black 8% Two or more races 3% Hispanic / Latino 1%
- Common ancestry
- Italian 3% Serbian 2% Slovak 1%
- Foreign-born
- 1%
Political lean MEDSL · Lyon
- 2024 margin
- Solid R (+53.4) · D 22.7% · R 76.1% · Other 1.2%
- 2008→2024 swing
- -36.8pp toward R · 2008: -16.7pp · 2024: -53.4pp
- All cycles
- 2024: R+53.4 2020: R+47.5 2016: R+44.0 2012: R+27.1 2008: R+16.7
Not yet ingested
- Civics
- —
Market trends
- HPI YoY
- ▼ -65.82%
- Current HPI
- 148.5677
- Rent YoY
- —
- Metro
- —
- State GDP YoY
- ▲ 1.81%
- F500 in state
- 4
Industry mix (Fortune 500 HQ in KY)
| Industry | F500 HQs | Revenue |
|---|---|---|
| Healthcare | 1 | $118B |
|
||
| Food / Beverage | 1 | $7B |
|
||
Price history
+148.7% since first listed2 events — show timeline
- 2026-05-12 Listed $145,000 FSBO.com
- 2014-11-12 Sold (Public Records) $58,300 Public Records
Property tax history
-1.8%/yrLatest (2025): $467 · -1.1% YoY. Source: county tax records.
Cash-flow waterfall
monthlySold comps — $/sqft
last 12 mo · ≤1 miLoading sold comps…