 Fourplex
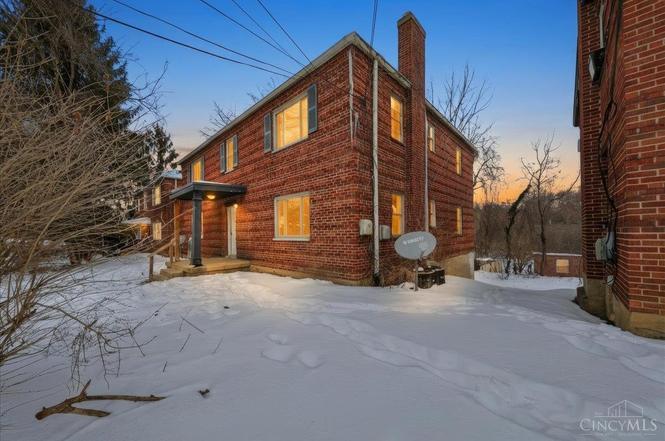
134 Glenridge Pl · Cincinnati, OH
Flood risk 1/10 · Minimal
- FEMA flood zone
- X (unshaded)
- Chance of flooding over 30 yrs
- 0.0%
- Est. flood insurance / yr
- $507 – $1,088
Fire risk 1/10 · Minimal
- Est. fire insurance / yr
- $713 – $1,323
Heat risk 4/10 · Minor
- Hot days now (above 103°F)
- 7 days/yr
- Hot days in 30 yrs
- 19 days/yr
Wind risk 2/10 · Minimal
- Chance of severe wind over 30 yrs
- 1.0%
Air-quality risk 3/10 · Minor
- Unhealthy air days now
- 2 days/yr
- Unhealthy air days in 30 yrs
- 3 days/yr
Risk factors via First Street. Map © Google.
Why this score? — see what drove the B- grade
The composite is a weighted blend of 9 inputs, each scored 0–100. Each bar is that input's sub-score; the figure is the points it added to the 100-point composite (weight × sub-score).
- Cash flow +30.0/30.0
- DSCR +10.0/10.0
- 1% rule +8.9/10.0
- ARV discount +7.5/15.0
- Livability +4.0/5.0
- Rent growth +2.5/5.0
- Schools +2.5/10.0
- Condition / age +2.5/5.0
- Appreciation +0.0/10.0
$280,000
🖨 Deal sheet 📄 Offer letter ✓ Due diligence
Multi-family units
County records classify this as Multi-Family (5+ Unit). Listing-text estimate: 4 units. estimate disagrees with records
5+ unit building — per-unit beds/baths from public records are typically unavailable; the breakdown below (if shown) is an estimate from the listing text.
Listing remarks MLS
ATTENTION INVESTORS: Cash flowing quad - 1 bedroom units leased at $885/mo, 2 units vacant. SELLING AS IS WHERE IS. All MLS information believed to be accurate but not guaranteed.
Key facts
- 4 garage spots
- Built 1941
- Listed 112 days
Property features AI
Finance
- Financial info: One building containing four units
Exterior
- Parking: Attached rear garage with 4 garage spaces; 4 open parking spaces
- Utilities: Public water; Public sewer; Natural gas
- Home design: Quad structure (multi-unit); Two levels; Rear-attached garage
- Construction: Brick construction; Poured foundation; Membrane roof
- Exterior features: Vinyl insulated windows; Off-street parking
Interior
- Bedrooms: Four 1-bedroom units (multi-unit property)
- Heating & cooling: Electric forced air heating; Wall unit cooling
- Interior features: Full basement
Neighborhood map
What this means for you Summary
Snapshot
- This is a 4 × 1-bed/1.0-bath units multifamily listed at $280k.
Deal economics
- At list price, monthly cash flow is $1k ($15k/yr) — positive. Per door: $314/mo.
- The deal already cash-flows at list — no discount required.
- Meets the 1% rule at list price ($4k rent vs $280k).
- Recommended offer: $255k (9.0% below list) — sets the bar for market timing.
- Cap rate 11.7% vs local median 3.9% in Cincinnati — top-decile yield for the area; either an underpriced asset or a hidden risk that comps aren't pricing in. Stress-test before assuming the spread holds.
Location & tenants
- Location reads 80/100 on livability (#130 in OH, #1,856 nationally) — a professional / high-income tenant draw. Strengths: amenities A+, commute A+, cost of living A+; Watch: employment D, crime F.
- Cincinnati Public Schools (urban): math 25% / reading 36% proficiency, ranked #581 of 656 in OH (top 89%) — families likely to look elsewhere, expect single-tenant / working-renter base with shorter leases; 70% free/reduced lunch — lower-income household profile, screen leases tightly.
- Market conditions: 29 active listings in the ZIP; 801 units permitted in Hamilton County in 2024 (190 in 5+ unit buildings).
- At $3,902/mo this rent would consume 75% of the median local household income ($62k/yr) (locally 388% of renters already pay >50% of income on rent) — very limited rent-growth headroom before tenants either downsize or default.
Forward outlook
- Local home prices are declining (-3.0%/yr); year-one equity from $2k of loan paydown is wiped out by about $8k of value loss. Plan a longer hold.
- At projected returns (-3.0% appreciation + 3.0% rent growth), your $78k cash investment doubles in ~7 years — after that, you're playing with house money.
Negotiation context
- It's been on market 112 days — a 9% lower offer ($255k) is reasonable based on typical stale-listing flexibility.
- 5 sale attempts since 14y ago; this cycle's ask has dropped $20k (7%) from the opening price — seller is motivated, your offer sets the floor, not the list.
- Current owner paid $25k; list at $280k implies a 1020% gain — meaningful room to come down on a strong offer.
Risks & watch-outs
- Watch-outs: built in 1941 — expect roof / HVAC / electrical / plumbing capex.
Questions for the listing agent
- It's been on market 112 days. Have you received any prior offers? Is the seller open to a 9% concession, seller financing, or rate buy-down credit?
- Can we see the unit-by-unit rent roll, current vacancy, and any below-market leases? What's the average tenancy length?
- What capital expenditures (roof, boiler, parking lot, exteriors) have been made in the last 5 years, and what's planned in the next 2?
- Built in 1941 — when were the roof, HVAC, electrical panel, plumbing, and water heater last replaced?
- Why hasn't it sold? Are there any deal-killer items the seller is aware of (foundation, flood, title, zoning, code violations)?
- Is there a deadline driving the sale (1031 exchange, divorce, estate, relocation)? That informs how much negotiation room exists.
- Schools are B-rated — typically a magnet for longer-tenancy family renters. What's the average tenant stay here, and is there a school-zone premium baked into asking?
- Crime grade is F in this area — have there been break-ins, vandalism, or insurance claims at this property in the last 3 years? What carrier currently insures it and at what premium?
- What's the average days-on-market for RENTAL listings here right now (not sales)? A rising rental-DOM trend means longer vacancies and softer asking-rent achievability than the comps imply.
- What's the recent tenant-quality profile in this submarket — average credit score on applications, eviction rate, late-payment / NSF rate, and stable-employment percentage? A property-management company in the area should have these aggregated.
- How much new apartment / multifamily construction is in the pipeline within 1–3 miles? Heavy new supply (>2% of stock underway) typically softens rents 12–24 months out; light construction supports rent growth.
Investment metrics
- 1% rule
- 1.39% ✓
- Cap rate
- 11.68%
- Cash-on-cash
- 19.23%
- DSCR
- 1.86
- GRM
- 6.0
CMA / ARV
No comps found within radius.
Projected returns pro-forma
-3.0% appreciation · 3.0% rent growth · sell at horizon
- IRR
- 11.2%
- Equity multiple
- 1.44×
- Total profit
- $34,619
- Equity at exit
- $41,749
- IRR
- 20.2%
- Equity multiple
- 2.70×
- Total profit
- $133,125
- Equity at exit
- $24,209
Cash invested: $78,400 (down + closing). Projections, not guarantees.
Landlord ↔ Tenant lean methodology
- Overall (STATE)
- 73 Landlord-Friendly
- State Ohio
- 73 Landlord-Friendly · R+6
- County
- — inherits STATE
- City
- — inherits STATE
ZIP-level market 45217
- Home prices YoY
- -31.9%
- Active inventory
- 29
- Price-to-rent
- 23.9×
Monthly cashflow live
- Estimated rent
- $3,902 high interval (Pro) →
- Mortgage (P&I)
- −$1,468
- Tax from tax record
- −$242 /mo · $2,898/yr
- Insurance
- −$117
- HOA
- −$0
- Vacancy / Maint / Mgmt
- −$819
- Net cashflow
- $1,256
Break-even live
4-unit breakdown (identical units grouped — click to expand)
| Units | Beds | Baths | Est. rent |
|---|---|---|---|
| 4× units | 1 | 1 | $3,900 |
| #1 | 1 | 1 | $975 |
| #2 | 1 | 1 | $975 |
| #3 | 1 | 1 | $975 |
| #4 | 1 | 1 | $975 |
| Total (4 units) | $3,902 | ||
UW: 25.0% down · 7.5% · 30yr · 1.5% tax · 5.0% vac · 8.0% maint · 8.0% mgmt
Financing live
Cash to close
- Down payment
- $70,000
- Closing costs
- $8,400
- Reserves months
- —
- Total cash needed
- —
Loan-product check · same deal, 3 products live
Conventional
25% down · 7.5% · 30yr
- Down + closing
- —
- Monthly P&I
- —
- Monthly cashflow
- —
- DSCR
- —
- Eligible?
- —
Personal DTI + credit; lowest rate.
DSCR
20% down · 8.5% · 30yr
- Down + closing
- —
- Monthly P&I
- —
- Monthly cashflow
- —
- DSCR
- —
- Eligible?
- —
No personal income docs; deal must DSCR.
Hard money
10% down · 12.0% · 12mo
- Down + closing
- —
- Monthly P&I
- —
- Monthly cashflow
- —
- DSCR
- —
- Eligible?
- —
Short-term bridge; refi at stabilization.
Listing history 30 events
-
2026-06-18days on market $280,000 Active 112 DOM
-
2026-06-17days on market $280,000 Active 111 DOM
-
2026-06-16days on market $280,000 Active 110 DOM
-
2026-06-15days on market $280,000 Active 109 DOM
-
2026-06-13days on market $280,000 Active 107 DOM
-
2026-06-13days on market $280,000 Active 106 DOM
-
2026-06-09days on market $280,000 Active 103 DOM
-
2026-06-08days on market $280,000 Active 102 DOM
-
2026-06-07days on market $280,000 Active 101 DOM
-
2026-06-03days on market $280,000 Active 97 DOM
-
2026-06-02days on market $280,000 Active 96 DOM
-
2026-06-01days on market $280,000 Active 95 DOM
-
2026-05-31days on market $280,000 Active 94 DOM
-
2026-05-13price $280,000
-
2026-02-26$300,000 Active
-
2024-05-27historical 179-char remark
Show marketing remark (179 chars)
ATTENTION INVESTORS: Cash flowing quad - 1 bedroom units leased at $885/mo, 2 units vacant. SELLING AS IS WHERE IS. All MLS information believed to be accurate but not guaranteed.
-
2024-03-25price $299,000 179-char remark
Show marketing remark (179 chars)
ATTENTION INVESTORS: Cash flowing quad - 1 bedroom units leased at $885/mo, 2 units vacant. SELLING AS IS WHERE IS. All MLS information believed to be accurate but not guaranteed.
-
2024-02-27$315,000 Active 179-char remark
Show marketing remark (179 chars)
ATTENTION INVESTORS: Cash flowing quad - 1 bedroom units leased at $885/mo, 2 units vacant. SELLING AS IS WHERE IS. All MLS information believed to be accurate but not guaranteed.
-
2016-01-14historical
-
2015-09-14price $69,900
-
2015-09-01price $79,900
-
2015-08-06price $89,999
-
2015-07-20$99,900 Active
-
2015-01-06historical
-
2014-01-06$69,900
-
2012-09-28soldstatus $25,000
-
2012-08-14$20,000
-
2001-12-04soldstatus $129,900
-
2001-04-27soldstatus $56,000
-
2001-02-28soldstatus $46,600
ⓘ Source: listings_history table (triggers on properties + properties_extension) + one-shot
backfill from property_details.listing_events for pre-trigger history.
Tax reassessment forecast OH · Partial reset (capped growth)
- Current annual tax
- $2,898 · $242/mo
- Projected year-2 tax
- $3,633 · $303/mo
- Expected delta
- +$735/yr (+$61/mo · 25.4%)
ⓘ Screening estimate from a state-policy table — verify with the county assessor before closing.
Climate risk First Street
- Flood 1/10 Low FEMA zone X (unshaded) · 0% chance over 30 yrs
- Wildfire 1/10 Low
- Heat 4/10 Moderate 7 d/yr ≥103°F today · 19 d/yr by 30 yrs out
- Wind 2/10 Low 100% chance of damaging wind over 30 yrs
- Air quality 3/10 Moderate 2 unhealthy d/yr today · 3 by 30 yrs out
Nearby sold comps map
Loading sold comps map…
Walkable amenities ~0.75 mi
Loading nearby amenities…
Taxation est. · year 1
- Rental income
- $46,824
- − Mortgage interest
- −$15,684
- − Property taxes
- −$2,898
- − Insurance
- −$1,400
- − Repairs & maintenance
- −$3,746
- − Management
- −$3,746
- − Depreciation
- −$8,145
- Taxable income
- $11,204
- Est. tax owed @ 24.0%
- −$2,689
- After-tax cash flow
- $12,384/yr
For passive investors: Depreciation is non-cash, so a rental often shows a tax loss while cash-flowing — sheltering income. Rental losses are passive: they offset passive income freely, and up to $25,000/yr can offset ordinary (W-2) income if you actively participate and your MAGI is under $100k (phasing out to $0 by $150k); unused losses carry forward. On sale, claimed depreciation is recaptured at up to 25%, and gains may owe capital-gains tax (a 1031 exchange can defer both). Figures are a year-1 estimate at your 24.0% rate — not tax advice; consult a CPA.
Schools (NCES district)
- District
- Cincinnati Public Schools
- NCES district ID
- 3904375
- Math proficiency
- 25% ▼ -19.00%
- Reading proficiency
- 36% ▼ -14.00%
- Median HH income
- $35,743
- Composite
- 25.21/100
- National rank
- #7508
- State rank
- #581 of 656 in OH
Livability — Cincinnati
- Score
- 80/100
- State rank
- #130
- US rank
- #1856
Category grades
Schools grade is shown separately in the Schools card above.
Census & demographics
- Census place
- Cincinnati, OH
- County
- Hamilton County · 701,295 people
- City population
- 505,555
- Metro
- Cincinnati, OH-KY-IN
- Population (ZIP)
- 6,454
- Household income
- $62,200
- Rent vs Own
- Severe rent burden
- 388.0
Population outlook (Hamilton County) Hauer SSP2
- Today (2025)
- 826,054 people
- By 2030
- 830,947 · +0.6%
- By 2040
- 832,319 · +0.8%
- By 2050
- 822,428 · -0.4%
- By 2075
- 788,688 · -4.5%
- By 2100
- 710,674 · -14.0%
Race, ethnicity, and origin ACS 2023
- Neighborhood character
- Majority White (64%)
- Race & ethnicity
- White 64% Black 28% Hispanic / Latino 4% Two or more races 3% Asian 1%
- Common ancestry
- Iranian 2% Italian 1% Lithuanian 1%
- Foreign-born
- 3%
- Languages at home
- 96% English-only · Russian/Polish/Slavic 1% Spanish 1% Other Indo-European 1%
Political lean MEDSL · Hamilton
- 2024 margin
- D (+14.9) · D 57.0% · R 42.1%
- 2008→2024 swing
- +7.9pp toward D · 2008: 7.0pp · 2024: 14.9pp
- All cycles
- 2024: D+14.9 2020: D+15.9 2016: D+9.5 2012: D+4.9 2008: D+7.0
Not yet ingested
- Civics
- —
Market trends
- HPI YoY
- ▼ -100.98%
- Current HPI
- 215.4479
- Rent YoY
- —
- Metro
- Cincinnati, OH-KY-IN
- State GDP YoY
- ▲ 1.98%
- F500 in state
- 48
Industry mix (Fortune 500 HQ in OH)
| Industry | F500 HQs | Revenue |
|---|---|---|
| Insurance | 3 | $145B |
|
||
| Industrial Machinery | 3 | $49B |
|
||
| Financial Services | 3 | $24B |
|
||
| Consumer Goods | 2 | $93B |
|
||
| Aerospace / Defense | 2 | $47B |
|
||
| Utilities | 2 | $33B |
|
||
Price history
+500.9% since first listed17 events — show timeline
- 2026-05-13 Price Changed $280,000 Cincy MLS
- 2026-02-26 Listed $300,000 Cincy MLS
- 2024-05-27 Listing Removed — Cincy MLS
- 2024-03-25 Price Changed $299,000 Cincy MLS
- 2024-02-27 Listed $315,000 Cincy MLS
- 2016-01-14 Listing Removed — Cincy MLS
- 2015-09-14 Price Changed $69,900 Cincy MLS
- 2015-09-01 Price Changed $79,900 Cincy MLS
- 2015-08-06 Price Changed $89,999 Cincy MLS
- 2015-07-20 Listed $99,900 Cincy MLS
- 2015-01-06 Listing Removed — Cincy MLS
- 2014-01-06 Listed $69,900 Cincy MLS
- 2012-09-28 Sold (MLS) $25,000 Cincy MLS
- 2012-08-14 Listed $20,000 Cincy MLS
- 2001-12-04 Sold (Public Records) $129,900 Public Records
- 2001-04-27 Sold (Public Records) $56,000 Public Records
- 2001-02-28 Sold (Public Records) $46,600 Public Records
Property tax history
+12.7%/yrLatest (2025): $2,898 · +0.7% YoY. Source: county tax records.
Cash-flow waterfall
monthlySold comps — $/sqft
last 12 mo · ≤1 miLoading sold comps…