 Duplex
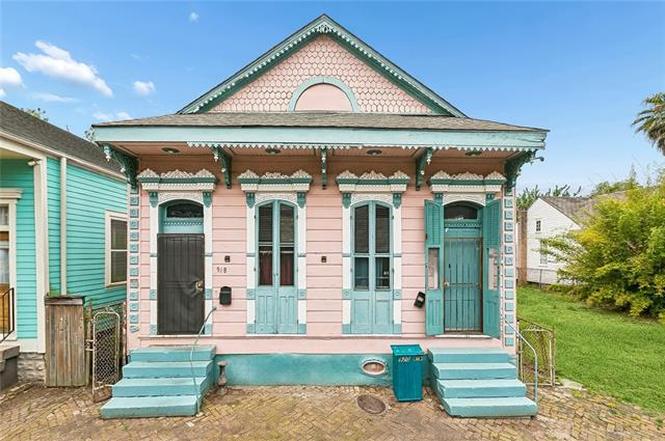
918-20 Montegut St · New Orleans, LA
Flood risk No data
- FEMA flood zone
- —
- Chance of flooding over 30 yrs
- %
- Est. flood insurance / yr
- —
Fire risk No data
- Est. fire insurance / yr
- —
Heat risk No data
- Hot days now (above °F)
- days/yr
- Hot days in 30 yrs
- days/yr
Wind risk No data
- Chance of severe wind over 30 yrs
- %
Air-quality risk No data
- Unhealthy air days now
- days/yr
- Unhealthy air days in 30 yrs
- days/yr
Risk factors via First Street. Map © Google.
Why this score? — see what drove the B+ grade
The composite is a weighted blend of 9 inputs, each scored 0–100. Each bar is that input's sub-score; the figure is the points it added to the 100-point composite (weight × sub-score).
- Cash flow +30.0/30.0
- ARV discount +15.0/15.0
- DSCR +10.0/10.0
- 1% rule +9.5/10.0
- Livability +4.0/5.0
- Rent growth +3.1/5.0
- Condition / age +2.5/5.0
- Schools +1.6/10.0
- Appreciation +0.0/10.0
$239,900
🖨 Deal sheet (PDF) 📄 Offer letter ✓ Due diligence
Listing remarks
Historic 1850's shotgun double, priced for restoration and full of New Orleans charm. This 2-unit property offers 2 bedrooms and 1 bath per side with tall ceilings, decorative mantels, transoms, and the classic shotgun layout that allows for flexible living and dining spaces. Each unit includes an eat-in style kitchen with cabinet storage and gas range, plus an interior laundry area with washer/dryer hookups for added convenience. The home does have some deferred maintenance and needs updating, presenting an excellent opportunity for investors or owner-occupants to bring a historic facade and interiors back to life. A fenced rear yard provides green space for gardening, outdoor entertaining
Key facts
- 3,200 sq ft lot
- Listed 65 days
Neighborhood map
What this means for you Summary
Snapshot
- This is a 2 × 2-bed/?-bath units multifamily listed at $240k.
Deal economics
- At list price, monthly cash flow is $1k ($13k/yr) — positive. Per door: $546/mo.
- The deal already cash-flows at list — no discount required.
- Meets the 1% rule at list price ($3k rent vs $240k).
- Recommended offer: $226k (6.0% below list) — sets the bar for market timing.
- Cap rate 11.8% vs local median 4.4% in New Orleans — top-decile yield for the area; either an underpriced asset or a hidden risk that comps aren't pricing in. Stress-test before assuming the spread holds.
Location & tenants
- Location reads 81/100 on livability (#3 in LA, #1,383 nationally) — a professional / high-income tenant draw. Strengths: amenities A+, commute A+, health & safety A+; Watch: crime C-, employment D.
- Orleans Parish (urban): math 11% / reading 27% proficiency, ranked #69 of 98 in LA (top 70%) — low school quality limits family demand, transient renter base, plan for 1-2y turnover; 68% free/reduced lunch — lower-income household profile, screen leases tightly.
- Market conditions: Rents rising (+2.5%/yr); 587 active listings in the ZIP; 40 comparable units currently listed for rent nearby; rentals at typical pace (median 26d on market — plan ~3-4 weeks tenant-placement turnaround); 710 units permitted in Orleans Parish in 2024 (244 in 5+ unit buildings).
- At $3,480/mo this rent would consume 91% of the median local household income ($46k/yr) (locally 1988% of renters already pay >50% of income on rent) — very limited rent-growth headroom before tenants either downsize or default.
Forward outlook
- Local home prices are declining (-3.0%/yr); year-one equity from $2k of loan paydown is wiped out by about $7k of value loss. Plan a longer hold.
- Orleans County population projected at +61% by 2050 — long-run rental-demand tailwind backs the buy-and-hold thesis.
- At projected returns (-3.0% appreciation + 2.5% rent growth), your $67k cash investment doubles in ~7 years — after that, you're playing with house money.
Negotiation context
- It's been on market 65 days — a 6% lower offer ($226k) is reasonable based on typical stale-listing flexibility.
Questions for the listing agent
- It's been on market 65 days. Have you received any prior offers? Is the seller open to a 6% concession, seller financing, or rate buy-down credit?
- Can we see the unit-by-unit rent roll, current vacancy, and any below-market leases? What's the average tenancy length?
- What capital expenditures (roof, boiler, parking lot, exteriors) have been made in the last 5 years, and what's planned in the next 2?
- Why hasn't it sold? Are there any deal-killer items the seller is aware of (foundation, flood, title, zoning, code violations)?
- Is there a deadline driving the sale (1031 exchange, divorce, estate, relocation)? That informs how much negotiation room exists.
- What's the average days-on-market for RENTAL listings here right now (not sales)? A rising rental-DOM trend means longer vacancies and softer asking-rent achievability than the comps imply.
- What's the recent tenant-quality profile in this submarket — average credit score on applications, eviction rate, late-payment / NSF rate, and stable-employment percentage? A property-management company in the area should have these aggregated.
- How much new apartment / multifamily construction is in the pipeline within 1–3 miles? Heavy new supply (>2% of stock underway) typically softens rents 12–24 months out; light construction supports rent growth.
Investment metrics
- 1% rule
- 1.45% ✓
- Cap rate
- 11.75%
- Cash-on-cash
- 19.50%
- DSCR
- 1.87
- GRM
- 5.7
CMA / ARV
- ARV (on-the-fly)
- $326,970
- Comps found
- 12
Show comp detail 12 sales within ~0.75 mi
| Address | Dist | Beds/Ba | Sqft | Sold | Price | $/sf | Match |
|---|---|---|---|---|---|---|---|
| 827-829 St Ferdinand St | 0.14mi | 4/2.0 | 2,019 (+7%) | 2mo | $450,000 | $223 | 80 |
| 3313-15 St Claude Ave | 0.34mi | —/— | 1,850 (-2%) | 1mo | $320,000 | $173 | 80 |
| 3313 15 St Claude Ave | 0.34mi | 4/3.0 | 1,850 (-2%) | 1mo | $320,000 | $173 | 80 |
| 523-25 Spain St | 0.41mi | 3/3.5 | 1,891 (+0%) | 2mo | $280,000 | $148 | 79 |
| 3119 Royal St | 0.22mi | 7/3.0 | 1,770 (-6%) | 0mo | $500,000 | $282 | 79 |
| 939 Piety St | 0.28mi | 4/2.5 | 2,022 (+7%) | 1mo | $409,000 | $202 | 74 |
| 832 36 Mandeville St | 0.47mi | 3/3.0 | 1,851 (-2%) | 4mo | $294,000 | $159 | 72 |
| 3129 31 N Claiborne Ave | 0.53mi | 4/2.0 | 1,806 (-4%) | 3mo | $267,150 | $148 | 66 |
| 1914-1916 Feliciana St | 0.74mi | 6/2.0 | 1,896 (+0%) | 3mo | $245,000 | $129 | 62 |
| 3135-3137 N Prieur St | 0.75mi | 6/2.0 | 1,800 (-5%) | 2mo | $319,000 | $177 | 56 |
| 1428-1430 Chartres St | 0.74mi | 4/3.0 | 2,011 (+6%) | 2mo | $556,000 | $276 | 54 |
| 1713-15 Desire St | 0.69mi | —/— | 1,654 (-12%) | 2mo | $235,000 | $142 | 46 |
Match score weights: distance 35% · size 25% · config 20% · recency 20%. Top-matched comps best support the ARV.
Projected returns pro-forma
-3.0% appreciation · 2.49% rent growth · sell at horizon
- IRR
- 10.9%
- Equity multiple
- 1.43×
- Total profit
- $28,907
- Equity at exit
- $35,770
- IRR
- 19.6%
- Equity multiple
- 2.60×
- Total profit
- $107,669
- Equity at exit
- $20,742
Cash invested: $67,172 (down + closing). Projections, not guarantees.
Landlord ↔ Tenant lean methodology
- Overall (STATE)
- 90 Strongly Landlord-Friendly
- State Louisiana
- 90 Strongly Landlord-Friendly · R+12
- County
- — inherits STATE
- City
- — inherits STATE
ZIP-level market 70117
- Rents YoY
- 2.5%
- Active inventory
- 587
- Price-to-rent
- 11.5×
Monthly cashflow live
- Estimated rent
- $3,480 high interval (Pro) →
- Mortgage (P&I)
- −$1,258
- Tax est. 1.5%
- −$300 /mo · $3,598/yr
- Insurance
- −$100
- HOA
- −$0
- Vacancy / Maint / Mgmt
- −$731
- Net cashflow
- $1,091
Break-even live
Sensitivity live
| Price | -10% $1,257 | -5% $1,174 | +0% $1,091 | +5% $1,008 | +10% $926 |
|---|---|---|---|---|---|
| Rent | -10% $816 | -5% $954 | +0% $1,091 | +5% $1,229 | +10% $1,366 |
| Rate | -1.0pp $1,212 | -0.5pp $1,152 | base $1,091 | +0.5pp $1,029 | +1.0pp $966 |
2-unit breakdown (identical units grouped — click to expand)
| Units | Beds | Baths | Est. rent |
|---|---|---|---|
| 2× units | 2 | — | $3,480 |
| #1 | 2 | — | $1,740 |
| #2 | 2 | — | $1,740 |
| Total (2 units) | $3,480 | ||
UW: 25.0% down · 7.5% · 30yr · 1.5% tax · 5.0% vac · 8.0% maint · 8.0% mgmt
Financing live
Cash to close
- Down payment
- $59,975
- Closing costs
- $7,197
- Reserves months
- —
- Total cash needed
- —
Loan-product check · same deal, 3 products live
Conventional
25% down · 7.5% · 30yr
- Down + closing
- —
- Monthly P&I
- —
- Monthly cashflow
- —
- DSCR
- —
- Eligible?
- —
Personal DTI + credit; lowest rate.
DSCR
20% down · 8.5% · 30yr
- Down + closing
- —
- Monthly P&I
- —
- Monthly cashflow
- —
- DSCR
- —
- Eligible?
- —
No personal income docs; deal must DSCR.
Hard money
10% down · 12.0% · 12mo
- Down + closing
- —
- Monthly P&I
- —
- Monthly cashflow
- —
- DSCR
- —
- Eligible?
- —
Short-term bridge; refi at stabilization.
Rent comps 40 comps
| Address | Beds | Baths | Sqft | Rent | $/sqft | DOM | Units | Dist |
|---|---|---|---|---|---|---|---|---|
| 1034 Montegut St Unit 1034 New Orleans, LA | 2.0 | 2.0 | 1415 | $3,400 | $2.40 | 45d | 1 | 0.12mi |
| 1038 Montegut St New Orleans, LA | 3.0 | 2.5 | 2250 | $4,200 | $1.87 | 25d | 1 | 0.12mi |
| 1038 Montegut St New Orleans, LA | 3.0 | 2.5 | 2250 | $4,200 | $1.87 | 45d | 1 | 0.12mi |
| 3134 Burgundy St New Orleans, LA | 3.0 | 2.0 | 1887 | $2,900 | $1.54 | 25d | 1 | 0.19mi |
| 522 Montegut St New Orleans, LA | 1.0–2.0 | 1.0–2.0 | 1256 | $3,500 | $2.79 | 4d | 12 | 0.24mi |
| 1231 Feliciana St New Orleans, LA | 3.0 | 2.5 | 1869 | $2,750 | $1.47 | 45d | 1 | 0.28mi |
| 3221 Saint Claude Ave New Orleans, LA | 3.0 | 1.0 | 1900 | $1,650 | $0.87 | 25d | 1 | 0.33mi |
| 1239 Saint Roch Ave New Orleans, LA | 2.0 | 2.0 | 1500 | $2,150 | $1.43 | 5d | 1 | 0.44mi |
| 3431 Chartres St #6 New Orleans, LA | 2.0 | 2.5 | 1262 | $2,750 | $2.18 | 16d | 1 | 0.45mi |
| 2322 Burgundy St Unit C New Orleans, LA | 3.0 | 2.0 | 1250 | $2,200 | $1.76 | 25d | 1 | 0.47mi |
| 2320 N Rampart St New Orleans, LA | 3.0 | 3.0 | 2317 | $3,700 | $1.60 | 45d | 1 | 0.48mi |
| 2317 N Rampart St Unit 1272378P New Orleans, LA | 3.0–6.0 | 2.0–4.0 | 1581 | $2,165 | $1.37 | 5d | 2 | 0.49mi |
| 600 Marigny St New Orleans, LA | 1.0 | 1.0 | 1440 | $2,000 | $1.39 | 13d | 1 | 0.52mi |
| 1437 Gallier St New Orleans, LA | 3.0 | 2.0 | 1451 | $1,875 | $1.29 | 23d | 1 | 0.61mi |
| 3900 Royal St Unit 2A New Orleans, LA | 2.0 | 2.0 | 1300 | $3,000 | $2.31 | 5d | 1 | 0.65mi |
| 1325 Pauline St New Orleans, LA | 3.0 | 2.0 | 1792 | $2,250 | $1.26 | 5d | 1 | 0.66mi |
| 1325 Pauline St New Orleans, LA | 3.0 | 2.0 | 1792 | $2,250 | $1.26 | 5d | 1 | 0.66mi |
| 1323 Pauline St New Orleans, LA | 3.0 | 2.0 | 1792 | $2,250 | $1.26 | 5d | 1 | 0.67mi |
| 1119 Bartholomew St Unit 1119 New Orleans, LA | 2.0 | 2.0 | 1410 | $2,500 | $1.77 | 45d | 1 | 0.71mi |
| 1136 Frenchmen St New Orleans, LA | 2.0 | 1.0 | 1800 | $1,650 | $0.92 | 25d | 1 | 0.72mi |
| 740 Mazant St New Orleans, LA | 2.0 | 2.0 | 1750 | $2,200 | $1.26 | 25d | 1 | 0.74mi |
| 1835 Louisa St New Orleans, LA | 3.0 | 2.5 | 1800 | $2,350 | $1.31 | 5d | 1 | 0.76mi |
| 1839 Louisa St New Orleans, LA | 3.0 | 2.0 | 1500 | $2,095 | $1.40 | 18d | 1 | 0.77mi |
| 1910 N Rampart St New Orleans, LA | 2.0 | 1.0 | 1450 | $1,995 | $1.38 | 5d | 1 | 0.78mi |
| 1521 Pauger St New Orleans, LA | 2.0 | 2.0 | 1288 | $2,500 | $1.94 | 25d | 1 | 0.79mi |
| 119 Vallette St New Orleans, LA | 3.0 | 2.5 | 1500 | $2,100 | $1.40 | 25d | 1 | 0.79mi |
| 817 Esplanade Ave Unit 1A New Orleans, LA | 2.0 | 2.5 | 1586 | $4,000 | $2.52 | 5d | 1 | 0.84mi |
| 323 Morgan St Unit G New Orleans, LA | 2.0 | 2.5 | 1700 | $2,500 | $1.47 | 45d | 1 | 0.88mi |
| 323 Morgan St New Orleans, LA | 2.0 | 2.5 | 2000 | $3,600 | $1.80 | 19d | 1 | 0.88mi |
| 323 Morgan St Unit C New Orleans, LA | 2.0 | 2.0 | 2000 | $3,200 | $1.60 | 45d | 1 | 0.88mi |
| 323 Morgan St Apt E New Orleans, LA | 2.0 | 2.5 | 2000 | $3,600 | $1.80 | 45d | 1 | 0.88mi |
| 928 Kerlerec St New Orleans, LA | 3.0 | 3.5 | 1684 | $2,750 | $1.63 | 5d | 1 | 0.88mi |
| 928 Kerlerec St New Orleans, LA | 3.0 | 3.5 | 1684 | $2,750 | $1.63 | 5d | 1 | 0.88mi |
| 1411 France St New Orleans, LA | 3.0 | 2.0 | 1525 | $2,000 | $1.31 | 25d | 1 | 0.90mi |
| 2028 Desire St New Orleans, LA | 3.0 | 1.0 | 1300 | $1,300 | $1.00 | 25d | 1 | 0.92mi |
| 2220 N Prieur St New Orleans, LA | 3.0 | 2.0 | 1334 | $2,000 | $1.50 | 25d | 1 | 0.93mi |
| 4317 Urquhart St New Orleans, LA | 3.0 | 2.0 | 1300 | $1,650 | $1.27 | 25d | 1 | 0.94mi |
| 336 Elmira Ave New Orleans, LA | 3.0 | 1.0 | 1250 | $1,825 | $1.46 | 25d | 1 | 0.94mi |
| 1403 Lesseps St New Orleans, LA | 3.0 | 3.0 | 1700 | $1,800 | $1.06 | 13d | 1 | 0.95mi |
| 4318 1/2 N Robertson St New Orleans, LA | 3.0 | 1.0 | 1250 | $1,150 | $0.92 | 5d | 1 | 0.98mi |
Listing history 4 events
-
2026-06-21days on market $239,900 Active 65 DOM
-
2026-06-18days on market $239,900 Active 62 DOM
-
2026-06-17remarks 699-char remark
-
2026-06-17$239,900 Active 61 DOM
ⓘ Source: listings_history table (triggers on properties + properties_extension) + one-shot
backfill from property_details.listing_events for pre-trigger history.
Nearby sold comps map
Loading sold comps map…
Walkable amenities ~0.75 mi
Loading nearby amenities…
Taxation est. · year 1
- Rental income
- $41,760
- − Mortgage interest
- −$13,438
- − Property taxes
- −$3,598
- − Insurance
- −$1,200
- − Repairs & maintenance
- −$3,341
- − Management
- −$3,341
- − Depreciation
- −$6,979
- Taxable income
- $9,863
- Est. tax owed @ 24.0%
- −$2,367
- After-tax cash flow
- $10,728/yr
For passive investors: Depreciation is non-cash, so a rental often shows a tax loss while cash-flowing — sheltering income. Rental losses are passive: they offset passive income freely, and up to $25,000/yr can offset ordinary (W-2) income if you actively participate and your MAGI is under $100k (phasing out to $0 by $150k); unused losses carry forward. On sale, claimed depreciation is recaptured at up to 25%, and gains may owe capital-gains tax (a 1031 exchange can defer both). Figures are a year-1 estimate at your 24.0% rate — not tax advice; consult a CPA.
Schools (NCES district)
- District
- Orleans Parish
- NCES district ID
- 2201170
- Math proficiency
- 11% ▼ -52.00%
- Reading proficiency
- 27% ▼ -46.00%
- Median HH income
- $37,011
- Composite
- 15.78/100
- National rank
- #9271
- State rank
- #69 of 98 in LA
Livability — New Orleans
- Score
- 81/100
- State rank
- #3
- US rank
- #1383
Category grades
Schools grade is shown separately in the Schools card above.
Census & demographics
- Census place
- New Orleans, LA
- County
- Orleans Parish · 338,817 people
- City population
- 338,817
- Metro
- New Orleans-Metairie, LA
- Population (ZIP)
- 25,652
- Household income
- $45,764
- Rent vs Own
- Severe rent burden
- 1988.0
Population outlook (Orleans County) Hauer SSP2
- Today (2025)
- 513,025 people
- By 2030
- 575,781 · +12.2%
- By 2040
- 700,174 · +36.5%
- By 2050
- 826,541 · +61.1%
- By 2075
- 1,123,374 · +119.0%
- By 2100
- 1,355,609 · +164.2%
Race, ethnicity, and origin ACS 2023
- Neighborhood character
- Majority Black (60%)
- Race & ethnicity
- Black 60% White 30% Two or more races 6% Hispanic / Latino 5%
- Common ancestry
- Lithuanian 5% Italian 1% Romanian 1%
- Foreign-born
- 5% · Canada, South Korea
- Languages at home
- 93% English-only · Spanish 3% Other Indo-European 1% French/Haitian/Cajun 1%
Political lean MEDSL · Orleans
- 2024 margin
- Solid D (+67.0) · D 82.2% · R 15.2% · Other 2.7%
- 2008→2024 swing
- +6.7pp toward D · 2008: 60.3pp · 2024: 67.0pp
- All cycles
- 2024: D+67.0 2020: D+68.2 2016: D+66.2 2012: D+62.5 2008: D+60.3
Not yet ingested
- Civics
- —
Market trends
- HPI YoY
- ▼ -177.22%
- Current HPI
- 184.6061
- Rent YoY
- ▲ 2.49%
- Metro
- New Orleans-Metairie, LA
- State GDP YoY
- ▲ 3.29%
- F500 in state
- 10
Industry mix (Fortune 500 HQ in LA)
| Industry | F500 HQs | Revenue |
|---|---|---|
| Telecommunications | 2 | $23B |
|
||
| Utilities | 1 | $12B |
|
||
| Wholesale / Distribution | 1 | $5B |
|
||
| Advertising | 1 | $2B |
|
||
Cash-flow waterfall
monthlySold comps — $/sqft
last 12 mo · ≤1 miLoading sold comps…