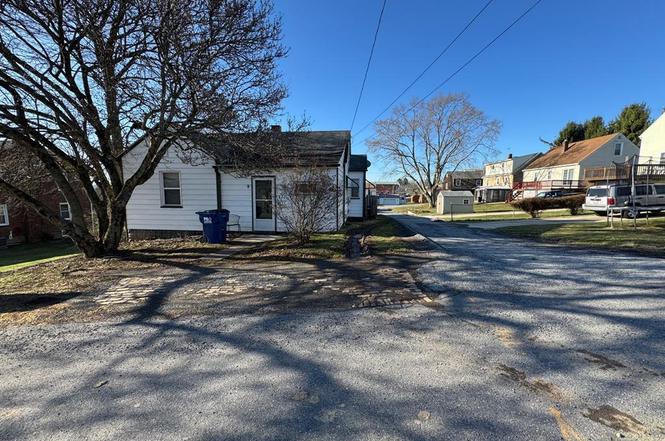
225 Columbia St · Elim, PA
Flood risk 1/10 · Minimal
- FEMA flood zone
- X (unshaded)
- Chance of flooding over 30 yrs
- 0.0%
- Est. flood insurance / yr
- $473 – $860
Fire risk 1/10 · Minimal
- Est. fire insurance / yr
- $511 – $949
Heat risk 3/10 · Minor
- Hot days now (above 93°F)
- 7 days/yr
- Hot days in 30 yrs
- 17 days/yr
Wind risk 2/10 · Minimal
- Chance of severe wind over 30 yrs
- —
Air-quality risk 2/10 · Minimal
- Unhealthy air days now
- 1 days/yr
- Unhealthy air days in 30 yrs
- 2 days/yr
Risk factors via First Street. Map © Google.
Why this score? — see what drove the C+ grade
The composite is a weighted blend of 9 inputs, each scored 0–100. Each bar is that input's sub-score; the figure is the points it added to the 100-point composite (weight × sub-score).
- Cash flow +25.2/30.0
- DSCR +8.3/10.0
- ARV discount +8.2/15.0
- 1% rule +6.6/10.0
- Schools +3.9/10.0
- Livability +3.4/5.0
- Rent growth +2.5/5.0
- Condition / age +2.5/5.0
- Appreciation +0.0/10.0
$67,500
🖨 Deal sheet (PDF) 📄 Offer letter ✓ Due diligence
Listing remarks MLS
Don't Rent-Buy! Take a look at this well maintained 2 bedroom 1 bath ranch style home located in Westmont Hilltop School District. Easy one floor living featuring an updated kitchen. Large backyard gives you the space to plant a garden or build a garage. Call today to schedule a tour.
Key facts
- Gas hot water heat
- Fenced yard
- Vinyl siding
Tags
Neighborhood map
What this means for you Summary
Snapshot
- This is a 2-bed/1.0-bath single-family listed at $68k.
Deal economics
- At list price, monthly cash flow is $151 ($2k/yr) — positive.
- The deal already cash-flows at list — no discount required.
- Meets the 1% rule at list price ($784 rent vs $68k).
- Recommended offer: $63k (6.0% below list) — sets the bar for market timing.
Location & tenants
- Location reads 67/100 on livability (#992 in PA) — a middle-class / working-renter tenant base. Strengths: cost of living A+, housing A+, crime A; Watch: amenities F, commute F, health & safety F.
- Westmont Hilltop SD (suburban): math 39% / reading 51% proficiency, ranked #252 of 539 in PA (top 47%) — families likely to look elsewhere, expect single-tenant / working-renter base with shorter leases.
- Zoned schools: Westmont Hilltop El Sch (math 37% / reading 49%, grade F, #873 of 1,518 statewide, top 58%, 739 students, 47% FRL); Westmont Hilltop Jshs (math 42% / reading 57%, grade D, #138 of 437 statewide, top 34%, 725 students, 38% FRL) — zoned schools average 43% FRL vs 24% district-wide (19 pts higher); higher-poverty schools than district average — tighter screening recommended.
- Market conditions: 93 active listings in the ZIP; 4 comparable units currently listed for rent nearby; rentals lingering (median 46d on market — plan ~5-8 weeks vacancy on turnover, expect pricing pressure); 100% of comp listings sitting > 30 days — soft ceiling on asking rent; 64 units permitted in Cambria County in 2024 (0 in 5+ unit buildings).
- This rent is only 14% of the median local income ($69k/yr) — well below the 30% rent-burden line; pricing power to push rent on renewal without tenant pushback.
Forward outlook
- Local home prices are declining (-3.0%/yr); year-one equity from $467 of loan paydown is wiped out by about $2k of value loss. Plan a longer hold.
- Cambria County population projected at -28% by 2050 — secular population decline; favor cash flow + early exit over multi-decade hold.
Negotiation context
- It's been on market 76 days — a 6% lower offer ($63k) is reasonable based on typical stale-listing flexibility.
- 4 sale attempts since 26y ago with the ask held roughly flat each time — persistent listings suggest the price (not the market) is what's stuck; bring a comps-based counter.
- Current owner paid $40k; list at $68k implies a 69% gain — meaningful room to come down on a strong offer.
Risks & watch-outs
- Watch-outs: built in 1938 — expect roof / HVAC / electrical / plumbing capex.
Questions for the listing agent
- It's been on market 76 days. Have you received any prior offers? Is the seller open to a 6% concession, seller financing, or rate buy-down credit?
- Built in 1938 — when were the roof, HVAC, electrical panel, plumbing, and water heater last replaced?
- Why hasn't it sold? Are there any deal-killer items the seller is aware of (foundation, flood, title, zoning, code violations)?
- Is there a deadline driving the sale (1031 exchange, divorce, estate, relocation)? That informs how much negotiation room exists.
- Schools are D-rated, which usually means shorter tenancies and higher turnover. Who's the typical renter profile here, and what's been the actual vacancy rate?
- What's the average days-on-market for RENTAL listings here right now (not sales)? A rising rental-DOM trend means longer vacancies and softer asking-rent achievability than the comps imply.
- What's the recent tenant-quality profile in this submarket — average credit score on applications, eviction rate, late-payment / NSF rate, and stable-employment percentage? A property-management company in the area should have these aggregated.
- How much new for-sale + rental construction is in the pipeline within 1–3 miles? Heavy new supply typically softens prices + rents 12–24 months out; constrained supply supports both.
Investment metrics
- 1% rule
- 1.16% ✓
- Cap rate
- 8.98%
- Cash-on-cash
- 9.60%
- DSCR
- 1.43
- GRM
- 7.2
CMA / ARV
- ARV (on-the-fly)
- $68,558
- Comps found
- 9
Show comp detail 9 sales within ~0.75 mi
| Address | Dist | Beds/Ba | Sqft | Sold | Price | $/sf | Match |
|---|---|---|---|---|---|---|---|
| 225 Columbia St | 0.00mi | 2/1.0 | 826 (0%) | 1mo | $67,500 | $82 | 100 |
| 1355 Franklin St | 0.41mi | 2/1.0 | 868 (+5%) | 4mo | $68,000 | $78 | 69 |
| 225 Swank St | 0.28mi | 2/1.0 | 882 (+7%) | 21mo | $61,900 | $70 | 58 |
| 121 Royal Ave | 0.32mi | 2/1.0 | 940 (+14%) | 10mo | $90,000 | $96 | 54 |
| 180 Hammer Ave | 0.56mi | 2/1.0 | 864 (+5%) | 16mo | $58,500 | $68 | 53 |
| 1136 Shaffer St | 0.66mi | 2/1.0 | 768 (-7%) | 13mo | $76,100 | $99 | 47 |
| 413 Sell St | 0.59mi | 2/1.0 | 864 (+5%) | 22mo | $72,000 | $83 | 47 |
| 433 Tiffany St | 0.68mi | 2/2.0 | 732 (-11%) | 1mo | $80,000 | $109 | 44 |
| 464 Harshberger | 0.60mi | 2/1.0 | 898 (+9%) | 20mo | $114,900 | $128 | 41 |
Match score weights: distance 35% · size 25% · config 20% · recency 20%. Top-matched comps best support the ARV.
Projected returns pro-forma
-3.0% appreciation · 3.0% rent growth · sell at horizon
- IRR
- -1.8%
- Equity multiple
- 0.93×
- Total profit
- $-1,290
- Equity at exit
- $10,064
- IRR
- 7.9%
- Equity multiple
- 1.60×
- Total profit
- $11,335
- Equity at exit
- $5,836
Cash invested: $18,900 (down + closing). Projections, not guarantees.
Landlord ↔ Tenant lean methodology
- Overall (STATE)
- 62 Landlord-Friendly
- State Pennsylvania
- 62 Landlord-Friendly · EVEN
- County
- — inherits STATE
- City
- — inherits STATE
ZIP-level market 15905
- Home prices YoY
- -31.1%
- Active inventory
- 93
- Price-to-rent
- 7.2×
Monthly cashflow live
- Estimated rent
- $784 medium interval (Pro) →
- Mortgage (P&I)
- −$354
- Tax from tax record
- −$86 /mo · $1,032/yr
- Insurance
- −$28
- HOA
- −$0
- Vacancy / Maint / Mgmt
- −$165
- Net cashflow
- $151
Break-even live
Sensitivity live
| Price | -10% $189 | -5% $170 | +0% $151 | +5% $132 | +10% $113 |
|---|---|---|---|---|---|
| Rent | -10% $89 | -5% $120 | +0% $151 | +5% $182 | +10% $213 |
| Rate | -1.0pp $185 | -0.5pp $168 | base $151 | +0.5pp $134 | +1.0pp $116 |
UW: 25.0% down · 7.5% · 30yr · 1.5% tax · 5.0% vac · 8.0% maint · 8.0% mgmt
Financing live
Cash to close
- Down payment
- $16,875
- Closing costs
- $2,025
- Reserves months
- —
- Total cash needed
- —
Loan-product check · same deal, 3 products live
Conventional
25% down · 7.5% · 30yr
- Down + closing
- —
- Monthly P&I
- —
- Monthly cashflow
- —
- DSCR
- —
- Eligible?
- —
Personal DTI + credit; lowest rate.
DSCR
20% down · 8.5% · 30yr
- Down + closing
- —
- Monthly P&I
- —
- Monthly cashflow
- —
- DSCR
- —
- Eligible?
- —
No personal income docs; deal must DSCR.
Hard money
10% down · 12.0% · 12mo
- Down + closing
- —
- Monthly P&I
- —
- Monthly cashflow
- —
- DSCR
- —
- Eligible?
- —
Short-term bridge; refi at stabilization.
Rent comps 4 comps
| Address | Beds | Baths | Sqft | Rent | $/sqft | DOM | Units | Dist |
|---|---|---|---|---|---|---|---|---|
| 520 Vickroy Ave Johnstown, PA | 1.0 | 1.0 | 1125 | $500 | $0.44 | 45d | 1 | 0.89mi |
| 522 Vickroy Ave Johnstown, PA | 3.0 | 1.0 | 1125 | $850 | $0.76 | 45d | 1 | 0.89mi |
| 619 Grove Ave Johnstown, PA | 2.0 | 2.0 | 1100 | $1,050 | $0.95 | 45d | 1 | 1.14mi |
| 343 Linden Ave Unit 2 Johnstown, PA | 1.0 | 1.0 | 850 | $675 | $0.79 | 45d | 1 | 1.45mi |
Listing history 11 events
-
2026-04-26status Pending
-
2026-03-25price $67,500
-
2026-02-09$69,500 Active
-
2024-04-27historical $950
-
2024-04-16$950
-
2017-10-27soldstatus $40,000 288-char remark
Show marketing remark (288 chars)
Don't Rent-Buy! Take a look at this well maintained 2 bedroom 1 bath ranch style home located in Westmont Hilltop School District. Easy one floor living featuring an updated kitchen. Large backyard gives you the space to plant a garden or build a garage. Call today to schedule a tour.
-
2017-10-05soldstatus $40,000
-
2017-06-28$39,900 288-char remark
Show marketing remark (288 chars)
Don't Rent-Buy! Take a look at this well maintained 2 bedroom 1 bath ranch style home located in Westmont Hilltop School District. Easy one floor living featuring an updated kitchen. Large backyard gives you the space to plant a garden or build a garage. Call today to schedule a tour.
-
2000-12-18soldstatus $19,500 102-char remark
Show marketing remark (102 chars)
FROM FERNDALE FOLLOW GOUCHER ST. TURN RIGHT ONTO WARREN, GO STRAIGHT AT STOP SIGN, LEFT ONTO COLUMBIA.
-
2000-08-22$30,000 102-char remark
Show marketing remark (102 chars)
FROM FERNDALE FOLLOW GOUCHER ST. TURN RIGHT ONTO WARREN, GO STRAIGHT AT STOP SIGN, LEFT ONTO COLUMBIA.
-
1978-08-01soldstatus $26,000
ⓘ Source: listings_history table (triggers on properties + properties_extension) + one-shot
backfill from property_details.listing_events for pre-trigger history.
Tax reassessment forecast PA · Partial reset (capped growth)
- Current annual tax
- $1,032 · $86/mo
- Projected year-2 tax
- $1,049 · $87/mo
- Expected delta
- +$17/yr (+$1/mo · 1.7%)
ⓘ Screening estimate from a state-policy table — verify with the county assessor before closing.
Climate risk First Street
- Flood 1/10 Low FEMA zone X (unshaded) · 0% chance over 30 yrs
- Wildfire 1/10 Low
- Heat 3/10 Moderate 7 d/yr ≥93°F today · 17 d/yr by 30 yrs out
- Wind 2/10 Low
- Air quality 2/10 Low 1 unhealthy d/yr today · 2 by 30 yrs out
Nearby sold comps map
Loading sold comps map…
Walkable amenities ~0.75 mi
Loading nearby amenities…
Taxation est. · year 1
- Rental income
- $9,408
- − Mortgage interest
- −$3,781
- − Property taxes
- −$1,032
- − Insurance
- −$338
- − Repairs & maintenance
- −$753
- − Management
- −$753
- − Depreciation
- −$1,964
- Taxable income
- $789
- Est. tax owed @ 24.0%
- −$189
- After-tax cash flow
- $1,626/yr
For passive investors: Depreciation is non-cash, so a rental often shows a tax loss while cash-flowing — sheltering income. Rental losses are passive: they offset passive income freely, and up to $25,000/yr can offset ordinary (W-2) income if you actively participate and your MAGI is under $100k (phasing out to $0 by $150k); unused losses carry forward. On sale, claimed depreciation is recaptured at up to 25%, and gains may owe capital-gains tax (a 1031 exchange can defer both). Figures are a year-1 estimate at your 24.0% rate — not tax advice; consult a CPA.
Schools (NCES district)
- District
- Westmont Hilltop SD
- NCES district ID
- 4226130
- Math proficiency
- 39% ▼ -10.00%
- Reading proficiency
- 51% ▼ -15.00%
- Median HH income
- $59,325
- Composite
- 39.49/100
- National rank
- #3955
- State rank
- #252 of 539 in PA
Livability — Elim
- Score
- 67/100
- State rank
- #992
- US rank
- #10931
Category grades
Schools grade is shown separately in the Schools card above.
Census & demographics
- Census place
- Elim, PA
- County
- Cambria County · 30,791 people
- Metro
- Johnstown, PA
- Population (ZIP)
- 19,329
- Household income
- $69,212
- Rent vs Own
- Severe rent burden
- 359.0
Population outlook (Cambria County) Hauer SSP2
- Today (2025)
- 122,754 people
- By 2030
- 115,827 · -5.6%
- By 2040
- 101,309 · -17.5%
- By 2050
- 88,379 · -28.0%
- By 2075
- 65,237 · -46.9%
- By 2100
- 46,909 · -61.8%
Race, ethnicity, and origin ACS 2023
- Neighborhood character
- Predominantly White (92%)
- Race & ethnicity
- White 92% Two or more races 3% Hispanic / Latino 2% Black 2%
- Common ancestry
- Romanian 7% Scotch-Irish 1% Italian 1%
- Foreign-born
- 2% · Canada
- Languages at home
- 96% English-only · Spanish 1%
Political lean MEDSL · Cambria
- 2024 margin
- Solid R (+39.7) · D 29.8% · R 69.5%
- 2008→2024 swing
- -40.4pp toward R · 2008: 0.7pp · 2024: -39.7pp
- All cycles
- 2024: R+39.7 2020: R+37.3 2016: R+37.8 2012: R+17.8 2008: D+0.7
Not yet ingested
- Civics
- —
Market trends
- HPI YoY
- ▼ -64.18%
- Current HPI
- 142.5218
- Rent YoY
- —
- Metro
- Johnstown, PA
- State GDP YoY
- ▲ 1.68%
- F500 in state
- 34
Industry mix (Fortune 500 HQ in PA)
| Industry | F500 HQs | Revenue |
|---|---|---|
| Healthcare | 2 | $309B |
|
||
| Insurance | 2 | $27B |
|
||
| Telecommunications / Media | 1 | $124B |
|
||
| Industrial Distribution | 1 | $22B |
|
||
| Financial Services | 1 | $20B |
|
||
| Chemicals / Materials | 1 | $18B |
|
||
Price history
+159.6% since first listed11 events — show timeline
- 2026-04-26 Pending — CSMLS
- 2026-03-25 Price Changed $67,500 CSMLS
- 2026-02-09 Listed $69,500 CSMLS
- 2024-04-27 Rental Removed $950 Avail
- 2024-04-16 Listed for Rent $950 Avail
- 2017-10-27 Sold (MLS) $40,000 CSMLS
- 2017-10-05 Sold (Public Records) $40,000 Public Records
- 2017-06-28 Listed $39,900 CSMLS
- 2000-12-18 Sold (MLS) $19,500 CSMLS
- 2000-08-22 Listed $30,000 CSMLS
- 1978-08-01 Sold (Public Records) $26,000 Public Records
Property tax history
+0.3%/yrLatest (2026): $1,032 · +0.0% YoY. Source: county tax records.
Cash-flow waterfall
monthlySold comps — $/sqft
last 12 mo · ≤1 miLoading sold comps…