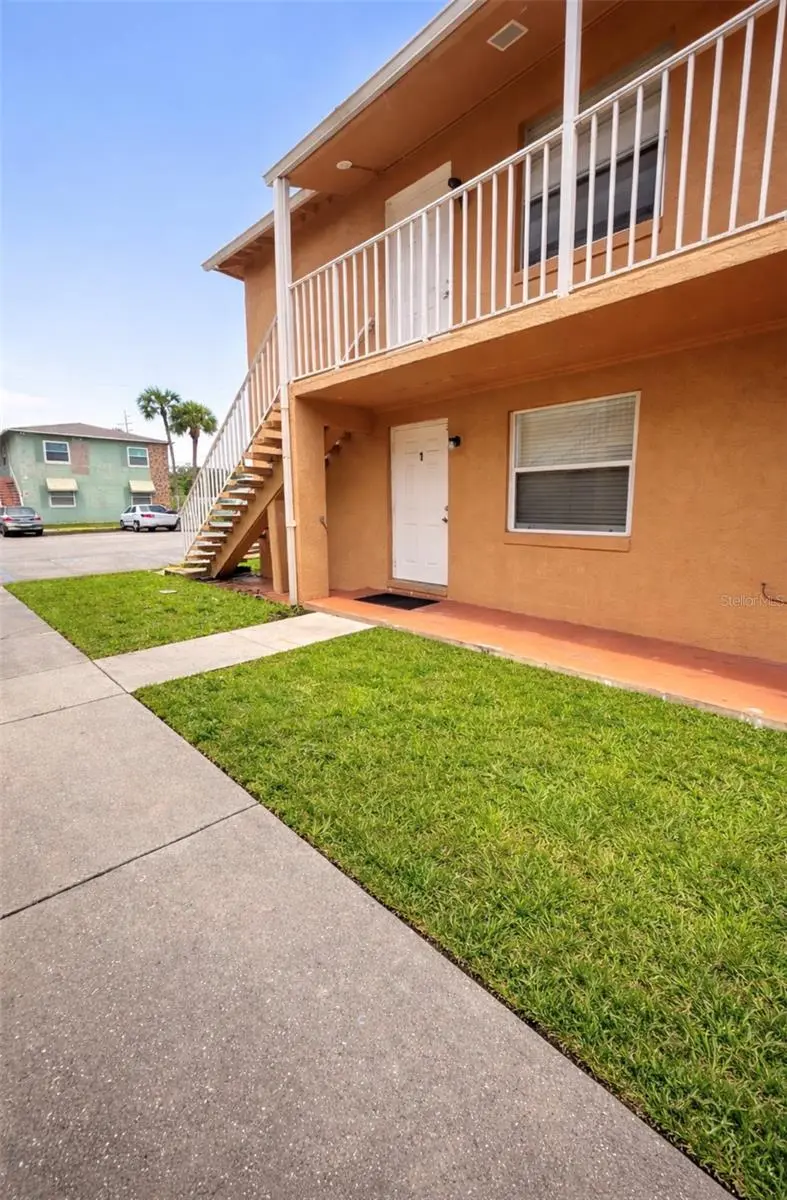
746 NE Michigan Ct #1 · St. Cloud, FL
Flood risk 1/10 · Minimal
- FEMA flood zone
- X (unshaded)
- Chance of flooding over 30 yrs
- 0.0%
- Est. flood insurance / yr
- $507 – $1,088
Fire risk 5/10 · Moderate
- Est. fire insurance / yr
- $947 – $1,759
Heat risk 9/10 · Severe
- Hot days now (above 108°F)
- 7 days/yr
- Hot days in 30 yrs
- 23 days/yr
Wind risk 9/10 · Severe
- Chance of severe wind over 30 yrs
- 99.0%
Air-quality risk 1/10 · Minimal
- Unhealthy air days now
- 0 days/yr
- Unhealthy air days in 30 yrs
- 0 days/yr
Risk factors via First Street. Map © Google.
Why this score? — see what drove the C- grade
The composite is a weighted blend of 9 inputs, each scored 0–100. Each bar is that input's sub-score; the figure is the points it added to the 100-point composite (weight × sub-score).
- Cash flow +19.4/30.0
- 1% rule +8.5/10.0
- ARV discount +7.5/15.0
- DSCR +6.1/10.0
- Schools +3.6/10.0
- Rent growth +2.8/5.0
- Livability +2.5/5.0
- Condition / age +2.5/5.0
- Appreciation +0.0/10.0
$110,000
🖨 Deal sheet 📄 Offer letter ✓ Due diligence
Listing remarks
Under contract-accepting backup offers. New Listing Price $110,000 – Motivated Seller! Move-in ready 2-bedroom, 1-bath condo offering 784 sq ft of comfortable living space at 746 Michigan Ct, Apt 1 in Saint Cloud. This updated unit features ceramic tile flooring throughout, a modern kitchen with stylish finishes, and a fully renovated bathroom. New windows recently installed, providing excellent natural light and improved energy efficiency. Located in a quiet, well-maintained community close to schools, shopping, dining, and major roadways. Ideal as a primary residence or investment opportunity. Schedule your showing today!
Key facts
- Close to schools
- Modern kitchen
- New windows
Tags
Property features AI
Finance
- Financial info: Total monthly fees: $300; Total annual fees: $3,600; Lease restrictions apply
- HOA & community: Monthly condo/association fee: $300 (includes water and trash); Association name: Palm Gardens/ Wanda; Association approval required; Deed restrictions; Sidewalks in community; Cats and dogs allowed
Exterior
- Utilities: Public water; Public sewer; Electricity connected; Sewer connected; Water connected
- Home design: Condominium; Residential property; One story; Faces north; First floor unit
- Construction: Block and stucco construction; Shingle roof; Block foundation; Built as part of a building (building number 1)
- Exterior features: Exterior lighting; Sidewalk
Interior
- Kitchen: Range; Refrigerator
- Bedrooms: 2 bedrooms
- Flooring: Tile
- Bathrooms: 1 full bathroom
- Heating & cooling: Central heating; Central air conditioning
- Interior features: Ceiling fans
- Laundry & utility: Outdoor laundry area
Neighborhood map
What this means for you Summary
Snapshot
- This is a 2-bed/1.0-bath condo listed at $110k.
Deal economics
- At list price, monthly cash flow is $122 ($1k/yr) — positive.
- The deal already cash-flows at list — no discount required.
- Meets the 1% rule at list price ($1k rent vs $110k).
- Recommended offer: $103k (6.0% below list) — sets the bar for market timing.
- Cap rate 7.6% vs local median 4.0% in St. Cloud — top-decile yield for the area; either an underpriced asset or a hidden risk that comps aren't pricing in. Stress-test before assuming the spread holds.
Location & tenants
- Location reads: area grade C — affects rentability + tenant quality, not the cash-flow math above.
- Osceola (suburban): math 39% / reading 45% proficiency, ranked #60 of 73 in FL (top 82%) — families likely to look elsewhere, expect single-tenant / working-renter base with shorter leases; 60% free/reduced lunch — lower-income household profile, screen leases tightly.
- Zoned schools: Michigan Avenue Elementary School (math 51% / reading 49%, grade D+, #1,070 of 2,144 statewide, top 51%, 807 students, 43% FRL); St. Cloud High School (math 32% / reading 50%, grade F, #289 of 667 statewide, top 44%, 2,264 students, 51% FRL).
- Market conditions: Rents rising (+1.4%/yr); 258 active listings in the ZIP; 28 comparable units currently listed for rent nearby; rentals at typical pace (median 22d on market — plan ~3-4 weeks tenant-placement turnaround); 8,813 units permitted in Osceola County in 2024 (3,072 in 5+ unit buildings).
Forward outlook
- Local home prices are declining (-3.0%/yr); year-one equity from $761 of loan paydown is wiped out by about $3k of value loss. Plan a longer hold.
- Osceola County population projected at +73% by 2050 — long-run rental-demand tailwind backs the buy-and-hold thesis.
Negotiation context
- It's been on market 72 days — a 6% lower offer ($103k) is reasonable based on typical stale-listing flexibility.
- Current owner paid $40k; list at $110k implies a 175% gain — meaningful room to come down on a strong offer.
Risks & watch-outs
- Watch-outs: HOA is 20% of rent.
- Climate carrying-cost: severe wind risk, 99% chance of damaging wind over 30y; moderate wildfire risk; extreme-heat days projected 7→23/yr by 2055 (HVAC capex compounding) — expect insurance premiums to compound above CPI over the hold.
Questions for the listing agent
- It's been on market 72 days. Have you received any prior offers? Is the seller open to a 6% concession, seller financing, or rate buy-down credit?
- Built in 1972 — when were the roof, HVAC, electrical panel, plumbing, and water heater last replaced?
- What does the HOA fee cover, when was the last increase, and are there any pending special assessments or reserve-fund shortfalls?
- Any open or pending special assessments — roof, HVAC, plumbing, elevator, façade? What's the per-unit balance and payoff schedule, and is the seller paying it off at close or rolling it to the buyer?
- Why hasn't it sold? Are there any deal-killer items the seller is aware of (foundation, flood, title, zoning, code violations)?
- Is there a deadline driving the sale (1031 exchange, divorce, estate, relocation)? That informs how much negotiation room exists.
- What's the average days-on-market for RENTAL listings here right now (not sales)? A rising rental-DOM trend means longer vacancies and softer asking-rent achievability than the comps imply.
- What's the recent tenant-quality profile in this submarket — average credit score on applications, eviction rate, late-payment / NSF rate, and stable-employment percentage? A property-management company in the area should have these aggregated.
- How much new apartment / multifamily construction is in the pipeline within 1–3 miles? Heavy new supply (>2% of stock underway) typically softens rents 12–24 months out; light construction supports rent growth.
Investment metrics
- 1% rule
- 1.35% ✓
- Cap rate
- 7.63%
- Cash-on-cash
- 4.77%
- DSCR
- 1.21
- GRM
- 6.2
CMA / ARV
No comps found within radius.
Projected returns pro-forma
-3.0% appreciation · 1.35% rent growth · sell at horizon
- IRR
- -11.2%
- Equity multiple
- 0.60×
- Total profit
- $-12,257
- Equity at exit
- $16,401
- IRR
- -5.2%
- Equity multiple
- 0.69×
- Total profit
- $-9,462
- Equity at exit
- $9,511
Cash invested: $30,800 (down + closing). Projections, not guarantees.
Landlord ↔ Tenant lean methodology
- Overall (STATE)
- 87 Strongly Landlord-Friendly
- State Florida
- 87 Strongly Landlord-Friendly · R+3
- County
- — inherits STATE
- City
- — inherits STATE
ZIP-level market 34769
- Home prices YoY
- -24.6%
- Rents YoY
- 1.4%
- Active inventory
- 258
- Price-to-rent
- 6.2×
Monthly cashflow live
- Estimated rent
- $1,488 high interval (Pro) →
- Mortgage (P&I)
- −$577
- Tax from tax record
- −$131 /mo · $1,569/yr
- Insurance
- −$46
- HOA
- −$300
- Vacancy / Maint / Mgmt
- −$313
- Net cashflow
- $122
Break-even live
UW: 25.0% down · 7.5% · 30yr · 1.5% tax · 5.0% vac · 8.0% maint · 8.0% mgmt
Financing live
Cash to close
- Down payment
- $27,500
- Closing costs
- $3,300
- Reserves months
- —
- Total cash needed
- —
Loan-product check · same deal, 3 products live
Conventional
25% down · 7.5% · 30yr
- Down + closing
- —
- Monthly P&I
- —
- Monthly cashflow
- —
- DSCR
- —
- Eligible?
- —
Personal DTI + credit; lowest rate.
DSCR
20% down · 8.5% · 30yr
- Down + closing
- —
- Monthly P&I
- —
- Monthly cashflow
- —
- DSCR
- —
- Eligible?
- —
No personal income docs; deal must DSCR.
Hard money
10% down · 12.0% · 12mo
- Down + closing
- —
- Monthly P&I
- —
- Monthly cashflow
- —
- DSCR
- —
- Eligible?
- —
Short-term bridge; refi at stabilization.
Rent comps 28 comps
| Address | Beds | Baths | Sqft | Rent | $/sqft | DOM | Units | Dist |
|---|---|---|---|---|---|---|---|---|
| 733 Michigan Ct St Cloud, FL | 2.0 | 1.0 | 784 | $1,295 | $1.65 | 23d | 1 | 0.03mi |
| 731 Michigan Ct St Cloud, FL | 2.0 | 1.0 | 784 | $1,350 | $1.72 | 7d | 1 | 0.04mi |
| 736 Michigan Ct #4 Saint Cloud, FL | 2.0 | 1.0 | 784 | $1,300 | $1.66 | 12d | 1 | 0.04mi |
| 698 Michigan Ct #1 Saint Cloud, FL | 2.0 | 1.0 | 784 | $1,225 | $1.56 | 21d | 1 | 0.07mi |
| 720 Michigan Ct #2 Saint Cloud, FL | 2.0 | 1.0 | 784 | $1,199 | $1.53 | 23d | 1 | 0.10mi |
| 720 Michigan Ct #4 Saint Cloud, FL | 2.0 | 1.0 | 784 | $1,295 | $1.65 | 23d | 1 | 0.10mi |
| 714 Michigan Ct #4 Saint Cloud, FL | 2.0 | 1.0 | 784 | $1,350 | $1.72 | 16d | 1 | 0.12mi |
| 715 Michigan Ct #3 Saint Cloud, FL | 2.0 | 1.0 | 784 | $1,300 | $1.66 | 23d | 1 | 0.12mi |
| 712 Michigan Ct #3 Saint Cloud, FL | 2.0 | 1.0 | 900 | $1,600 | $1.78 | 3d | 1 | 0.12mi |
| 1400 Carolina Ave Saint Cloud, FL | 2.0 | 1.5 | 920 | $1,495 | $1.62 | 23d | 1 | 0.45mi |
| 1818 Minnesota Ave Unit B St Cloud, FL | 1.0 | 1.5 | 700 | $1,600 | $2.29 | 23d | 1 | 0.64mi |
| 1007 Florida Ave Saint Cloud, FL | 1.0–2.0 | 1.0 | 800 | $1,350 | $1.69 | 16d | 2 | 0.70mi |
| 1022 Oregon Ave Saint Cloud, FL | 2.0 | 2.0 | 768 | $1,700 | $2.21 | 7d | 1 | 0.75mi |
| 1871 Cactus Ct Saint Cloud, FL | 3.0 | 2.0 | 900 | $1,400 | $1.56 | 17d | 1 | 0.79mi |
| 91 10th St Unit 91 St Cloud, FL | 2.0 | 1.0 | 1000 | $1,700 | $1.70 | 23d | 1 | 0.80mi |
| 821 Pennsylvania Ave Saint Cloud, FL | 3.0 | 1.0 | 1048 | $1,695 | $1.62 | 7d | 1 | 0.81mi |
| 610 Carolina Ave Saint Cloud, FL | 2.0 | 1.0 | 1015 | $2,500 | $2.46 | 23d | 1 | 0.92mi |
| 706 New York Ave Saint Cloud, FL | 1.0 | 1.0 | 750 | $1,425 | $1.90 | 23d | 1 | 0.94mi |
| 616 Massachusetts Ave Unit A St Cloud, FL | 2.0 | 1.0 | 900 | $999 | $1.11 | 21d | 1 | 1.01mi |
| 616 Massachusetts Ave Unit A St Cloud, FL | 2.0 | 1.0 | 900 | $999 | $1.11 | 23d | 1 | 1.01mi |
| 1400 Dakota Ave Saint Cloud, FL | 2.0 | 1.0 | 690 | $1,650 | $2.39 | 23d | 1 | 1.11mi |
| 9 E 5th St St Cloud, FL | 3.0 | 2.0 | 1110 | $1,495 | $1.35 | 23d | 1 | 1.12mi |
| 608 Missouri Ave Saint Cloud, FL | 2.0 | 1.0 | 956 | $1,395 | $1.46 | 3d | 1 | 1.18mi |
| 2400 16th St Saint Cloud, FL | 3.0 | 2.0 | 1040 | $1,799 | $1.73 | 17d | 1 | 1.20mi |
| 517 Jersey Ave Saint Cloud, FL | 1.0 | 1.0 | 600 | $1,250 | $2.08 | 7d | 1 | 1.29mi |
| 1423 Montana Ave Saint Cloud, FL | 3.0 | 2.0 | 1062 | $1,895 | $1.78 | 12d | 1 | 1.45mi |
| 1423 Montana Ave Unit 1423 St Cloud, FL | 3.0 | 2.0 | 1062 | $1,895 | $1.78 | 14d | 1 | 1.45mi |
| 607 Alabama Ave Saint Cloud, FL | 2.0 | 2.0 | 952 | $2,000 | $2.10 | 14d | 1 | 1.45mi |
HOA detail condo
- Monthly dues
- $300 · $3,600/yr
- Assessments
- None detected in remarks — confirm with the listing agent.
Listing history 19 events
-
2026-06-18remarks 631-char remark
-
2026-06-18status $110,000 Pending 72 DOM
-
2026-06-18days on market $110,000 Active 72 DOM
-
2026-06-17days on market $110,000 Active 71 DOM
-
2026-06-16days on market $110,000 Active 70 DOM
-
2026-06-15days on market $110,000 Active 69 DOM
-
2026-06-13remarks 591-char remark
-
2026-06-13pricedays on market $110,000 Active 67 DOM
-
2026-06-13days on market $123,000 Active 66 DOM
-
2026-06-09days on market $123,000 Active 63 DOM
-
2026-06-08days on market $123,000 Active 62 DOM
-
2026-06-07days on market $123,000 Active 61 DOM
-
2026-06-04days on market $123,000 Active 58 DOM
-
2026-06-03days on market $123,000 Active 57 DOM
-
2026-06-02days on market $123,000 Active 56 DOM
-
2026-06-02days on market $123,000 Active 55 DOM
-
2026-05-31days on market $123,000 Active 54 DOM
-
2026-04-07$123,000 Active
-
1992-10-30soldstatus $40,000
ⓘ Source: listings_history table (triggers on properties + properties_extension) + one-shot
backfill from property_details.listing_events for pre-trigger history.
Tax reassessment forecast FL · Resets to sale price
- Current annual tax
- $1,569 · $131/mo
- Projected year-2 tax
- $1,569 · $131/mo
- Expected delta
- $0/yr ($0/mo · 0.0%)
ⓘ Screening estimate from a state-policy table — verify with the county assessor before closing.
Climate risk First Street
- Flood 1/10 Low FEMA zone X (unshaded) · 0% chance over 30 yrs
- Wildfire 5/10 Major
- Heat 9/10 Extreme 7 d/yr ≥108°F today · 23 d/yr by 30 yrs out
- Wind 9/10 Extreme 99% chance of damaging wind over 30 yrs
- Air quality 1/10 Low 0 unhealthy d/yr today · 0 by 30 yrs out
Nearby sold comps map
Loading sold comps map…
Walkable amenities ~0.75 mi
Loading nearby amenities…
Taxation est. · year 1
- Rental income
- $17,861
- − Mortgage interest
- −$6,162
- − Property taxes
- −$1,569
- − Insurance
- −$550
- − Repairs & maintenance
- −$1,429
- − Management
- −$1,429
- − HOA
- −$3,600
- − Depreciation
- −$3,200
- Taxable loss
- −$78
- Est. tax savings @ 24.0%
- +$19
- After-tax cash flow
- $1,488/yr
For passive investors: Depreciation is non-cash, so a rental often shows a tax loss while cash-flowing — sheltering income. Rental losses are passive: they offset passive income freely, and up to $25,000/yr can offset ordinary (W-2) income if you actively participate and your MAGI is under $100k (phasing out to $0 by $150k); unused losses carry forward. On sale, claimed depreciation is recaptured at up to 25%, and gains may owe capital-gains tax (a 1031 exchange can defer both). Figures are a year-1 estimate at your 24.0% rate — not tax advice; consult a CPA.
Schools (NCES district)
- District
- Osceola
- NCES district ID
- 1201470
- Math proficiency
- 39% ▼ -9.00%
- Reading proficiency
- 45% ▼ -4.00%
- Median HH income
- $45,528
- Composite
- 35.7/100
- National rank
- #4865
- State rank
- #60 of 73 in FL
Livability — St. Cloud
No livability data for this city. (Only ~50 U.S. cities are tracked.)
Census & demographics
- Census place
- St. Cloud, FL
- County
- Osceola County · 410,217 people
- City population
- 29,247
- Metro
- Orlando-Kissimmee-Sanford, FL
- Population (ZIP)
- 30,204
- Household income
- $67,148
- Rent vs Own
- Severe rent burden
- 1138.0
Population outlook (Osceola County) Hauer SSP2
- Today (2025)
- 447,624 people
- By 2030
- 511,823 · +14.3%
- By 2040
- 642,986 · +43.6%
- By 2050
- 774,552 · +73.0%
- By 2075
- 1,078,144 · +140.9%
- By 2100
- 1,269,660 · +183.6%
Race, ethnicity, and origin ACS 2023
- Neighborhood character
- Diverse neighborhood (Simpson 0.60)
- Race & ethnicity
- White 50% Hispanic / Latino 38% Two or more races 17% Black 4%
- Hispanic origin (detail)
- Mexican 1% Puerto Rican 21% Dominican 5%
- Common ancestry
- Romanian 3% Lithuanian 3% Russian 2%
- Foreign-born
- 12% · Canada, Jamaica
- Languages at home
- 66% English-only · Spanish 31% French/Haitian/Cajun 2% Other Indo-European 1%
Political lean MEDSL · Osceola
- 2024 margin
- Toss-up / Even · D 48.7% · R 50.2% · Other 1.1%
- 2008→2024 swing
- -21.2pp toward R · 2008: 19.7pp · 2024: -1.4pp
- All cycles
- 2024: R+1.4 2020: D+13.8 2016: D+25.0 2012: D+24.5 2008: D+19.7
Not yet ingested
- Civics
- —
Market trends
- HPI YoY
- ▼ -106.08%
- Current HPI
- 324.6715
- Rent YoY
- ▲ 1.35%
- Metro
- Orlando-Kissimmee-Sanford, FL
- State GDP YoY
- ▲ 3.28%
- F500 in state
- 36
Industry mix (Fortune 500 HQ in FL)
| Industry | F500 HQs | Revenue |
|---|---|---|
| Industrial Technology | 2 | $29B |
|
||
| Insurance | 2 | $17B |
|
||
| Retail | 1 | $60B |
|
||
| Technology Distribution | 1 | $58B |
|
||
| Homebuilding | 1 | $35B |
|
||
| Technology Manufacturing | 1 | $35B |
|
||
Price history
+207.5% since first listed2 events — show timeline
- 2026-04-07 Listed $123,000 Stellar MLS as Distributed by MLS Grid
- 1992-10-30 Sold (Public Records) $40,000 Public Records
Property tax history
+5.7%/yrLatest (2025): $1,569 · +0.3% YoY. Source: county tax records.
Cash-flow waterfall
monthlySold comps — $/sqft
last 12 mo · ≤1 miLoading sold comps…