 Multi-family
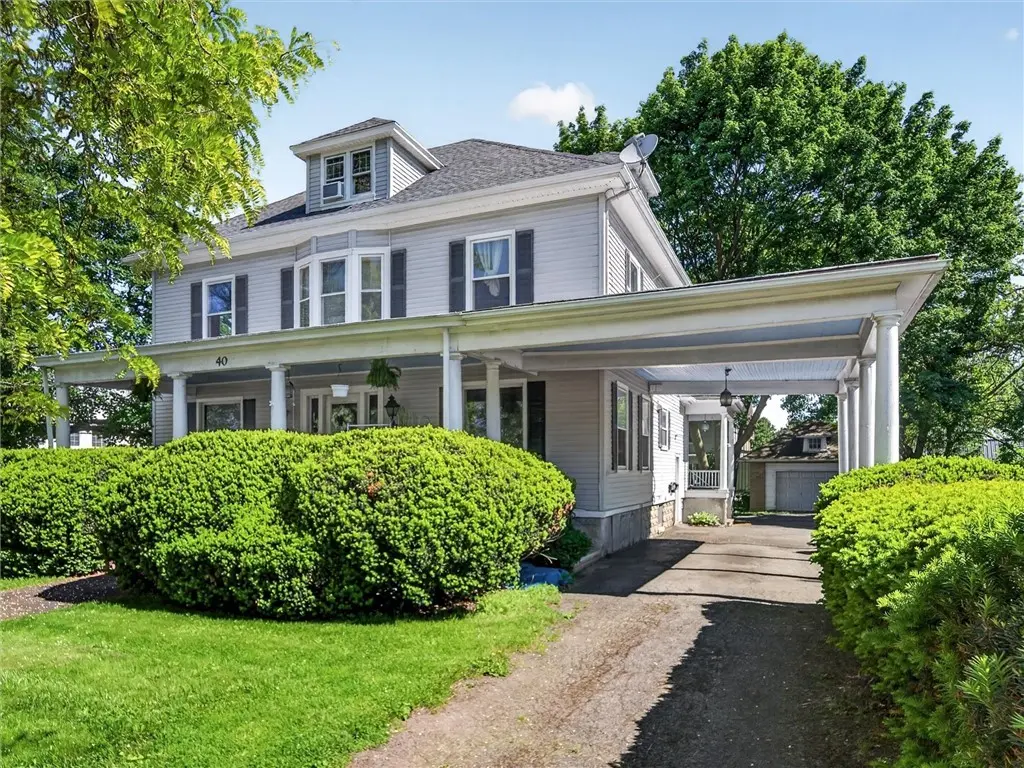
40 E Main St · Avon, NY
Flood risk 1/10 · Minimal
- FEMA flood zone
- X
- Chance of flooding over 30 yrs
- 0.0%
- Est. flood insurance / yr
- $473 – $860
Fire risk 2/10 · Minimal
- Est. fire insurance / yr
- $691 – $1,283
Heat risk 2/10 · Minimal
- Hot days now (above 94°F)
- 7 days/yr
- Hot days in 30 yrs
- 15 days/yr
Wind risk 1/10 · Minimal
- Chance of severe wind over 30 yrs
- —
Air-quality risk 2/10 · Minimal
- Unhealthy air days now
- 0 days/yr
- Unhealthy air days in 30 yrs
- 1 days/yr
Risk factors via First Street. Map © Google.
Why this score? — see what drove the B grade
The composite is a weighted blend of 9 inputs, each scored 0–100. Each bar is that input's sub-score; the figure is the points it added to the 100-point composite (weight × sub-score).
- Cash flow +30.0/30.0
- 1% rule +10.0/10.0
- DSCR +10.0/10.0
- ARV discount +7.5/15.0
- Schools +4.5/10.0
- Livability +3.6/5.0
- Rent growth +2.5/5.0
- Condition / age +2.5/5.0
- Appreciation +0.0/10.0
$385,000
🖨 Deal sheet 📄 Offer letter ✓ Due diligence
Multi-family units
County records classify this as Multi-Family (5+ Unit). Listing-text estimate: 1 unit. estimate disagrees with records
5+ unit building — per-unit beds/baths from public records are typically unavailable; the breakdown below (if shown) is an estimate from the listing text.
Listing remarks
Solid investment opportunity to own a Village of Avon legacy property. In the heart of the village and close to everything. This property has been very well maintain over 27 years of current ownership. All structural, electrical, and major mechanical systems are in good working order. Solid track record of tenancy and positive ROI. This is an amazing opportunity for an owner occupant to reside in the approximately 1600 Sq Ft 2nd Floor Apartment with in unit washer, dryer, dishwasher, double oven, Pass thru cabinets and more. 150' x 150' parcel with plenty of parking, garage, & just the right amount of yard. 3 of 4 units are leased. The 4th unit was just vacated and refreshed awaiting
Key facts
- 150 x 150 parcel
- Plenty of parking
- In unit dryer
Tags
Property features AI
Finance
- Financial info: Gross annual income: $47,280 (multi-unit); Operating expenses: $20,880 (includes electric, fuel, insurance, maintenance - structure, maintenance, trash, water/sewer); Owner pays heat, hot water, and trash collection; rent includes heat, hot water, and trash collection
Exterior
- Parking: Paved parking; Parking available with two or more spaces; 1-car garage
- Utilities: Public water connected; Sewer connected
- Home design: 3 stories; Resale property
- Construction: Frame construction with vinyl siding; Existing structure
- Exterior features: Corner lot; Rectangular lot; Main thoroughfare frontage
Interior
- Flooring: Carpet; Hardwood; Vinyl; Varies
- Bathrooms: 4 full bathrooms
- Heating & cooling: Gas heating; Hot water heating; Radiant heating
- Interior features: Attic; Full basement
- Laundry & utility: Gas water heater
Neighborhood map
What this means for you Summary
Snapshot
- This is a 5-bed/4.0-bath multifamily listed at $385k.
Deal economics
- At list price, monthly cash flow is $2k ($24k/yr) — positive.
- The deal already cash-flows at list — no discount required.
- Meets the 1% rule at list price ($6k rent vs $385k).
- Recommended offer: $379k (1.5% below list) — sets the bar for market timing.
Location & tenants
- Location reads 72/100 on livability (#373 in NY) — a middle-class / working-renter tenant base. Strengths: housing A+, health & safety A, employment A-; Watch: amenities F, commute F.
- Avon Central School District (town): math 53% / reading 50% proficiency, ranked #349 of 590 in NY (top 59%) — acceptable for families but not a draw, mixed tenant base, ~2y average lease.
- Market conditions: 37 active listings in the ZIP; 86 units permitted in Livingston County in 2024 (0 in 5+ unit buildings).
- At $5,964/mo this rent would consume 99% of the median local household income ($72k/yr) (locally 100% of renters already pay >50% of income on rent) — very limited rent-growth headroom before tenants either downsize or default.
Forward outlook
- Local home prices are declining (-3.0%/yr); year-one equity from $3k of loan paydown is wiped out by about $12k of value loss. Plan a longer hold.
- Livingston County population projected at -13% by 2050 — secular population decline; favor cash flow + early exit over multi-decade hold.
- At projected returns (-3.0% appreciation + 3.0% rent growth), your $108k cash investment doubles in ~6 years — after that, you're playing with house money.
Negotiation context
- It's been on market 16 days — a 2% lower offer ($379k) is reasonable based on typical stale-listing flexibility.
- 2 sale attempts with the ask held roughly flat each time — persistent listings suggest the price (not the market) is what's stuck; bring a comps-based counter.
- Current owner paid $152k; list at $385k implies a 153% gain — meaningful room to come down on a strong offer.
Risks & watch-outs
- Watch-outs: built in 1911 — expect roof / HVAC / electrical / plumbing capex.
Questions for the listing agent
- Built in 1911 — when were the roof, HVAC, electrical panel, plumbing, and water heater last replaced?
- Is there a deadline driving the sale (1031 exchange, divorce, estate, relocation)? That informs how much negotiation room exists.
- Schools are B-rated — typically a magnet for longer-tenancy family renters. What's the average tenant stay here, and is there a school-zone premium baked into asking?
- What's the average days-on-market for RENTAL listings here right now (not sales)? A rising rental-DOM trend means longer vacancies and softer asking-rent achievability than the comps imply.
- What's the recent tenant-quality profile in this submarket — average credit score on applications, eviction rate, late-payment / NSF rate, and stable-employment percentage? A property-management company in the area should have these aggregated.
- How much new apartment / multifamily construction is in the pipeline within 1–3 miles? Heavy new supply (>2% of stock underway) typically softens rents 12–24 months out; light construction supports rent growth.
Investment metrics
- 1% rule
- 1.55% ✓
- Cap rate
- 12.50%
- Cash-on-cash
- 22.18%
- DSCR
- 1.99
- GRM
- 5.4
CMA / ARV
No comps found within radius.
Projected returns pro-forma
-3.0% appreciation · 3.0% rent growth · sell at horizon
- IRR
- 14.9%
- Equity multiple
- 1.60×
- Total profit
- $64,617
- Equity at exit
- $57,405
- IRR
- 23.7%
- Equity multiple
- 3.04×
- Total profit
- $220,155
- Equity at exit
- $33,288
Cash invested: $107,800 (down + closing). Projections, not guarantees.
Landlord ↔ Tenant lean methodology
- Overall (STATE)
- 15 Strongly Tenant-Friendly
- State New York
- 15 Strongly Tenant-Friendly · D+10
- County
- — inherits STATE
- City
- — inherits STATE
ZIP-level market 14414
- Home prices YoY
- -14.1%
- Active inventory
- 37
- Price-to-rent
- 21.5×
Monthly cashflow live
- Estimated rent
- $5,964 medium interval (Pro) →
- Mortgage (P&I)
- −$2,019
- Tax from tax record
- −$540 /mo · $6,481/yr
- Insurance
- −$160
- HOA
- −$0
- Vacancy / Maint / Mgmt
- −$1,252
- Net cashflow
- $1,992
Break-even live
4-unit breakdown (identical units grouped — click to expand)
| Units | Beds | Baths | Est. rent |
|---|---|---|---|
| 4× units | 2 | 1 | $5,964 |
| #1 | 2 | 1 | $1,491 |
| #2 | 2 | 1 | $1,491 |
| #3 | 2 | 1 | $1,491 |
| #4 | 2 | 1 | $1,491 |
| Total (4 units) | $5,964 | ||
UW: 25.0% down · 7.5% · 30yr · 1.5% tax · 5.0% vac · 8.0% maint · 8.0% mgmt
Financing live
Cash to close
- Down payment
- $96,250
- Closing costs
- $11,550
- Reserves months
- —
- Total cash needed
- —
Loan-product check · same deal, 3 products live
Conventional
25% down · 7.5% · 30yr
- Down + closing
- —
- Monthly P&I
- —
- Monthly cashflow
- —
- DSCR
- —
- Eligible?
- —
Personal DTI + credit; lowest rate.
DSCR
20% down · 8.5% · 30yr
- Down + closing
- —
- Monthly P&I
- —
- Monthly cashflow
- —
- DSCR
- —
- Eligible?
- —
No personal income docs; deal must DSCR.
Hard money
10% down · 12.0% · 12mo
- Down + closing
- —
- Monthly P&I
- —
- Monthly cashflow
- —
- DSCR
- —
- Eligible?
- —
Short-term bridge; refi at stabilization.
Listing history 12 events
-
2026-06-18days on market $385,000 Active 16 DOM
-
2026-06-17days on market $385,000 Active 15 DOM
-
2026-06-16days on market $385,000 Active 14 DOM
-
2026-06-15days on market $385,000 Active 13 DOM
-
2026-06-13days on market $385,000 Active 11 DOM
-
2026-06-13days on market $385,000 Active 10 DOM
-
2026-06-10days on market $385,000 Active 8 DOM
-
2026-06-09days on market $385,000 Active 7 DOM
-
2026-06-08days on market $385,000 Active 6 DOM
-
2026-06-07days on market $385,000 Active 5 DOM
-
2026-06-03remarks 695-char remark
-
2026-06-03$385,000 Active 1 DOM
ⓘ Source: listings_history table (triggers on properties + properties_extension) + one-shot
backfill from property_details.listing_events for pre-trigger history.
Tax reassessment forecast NY · Partial reset (capped growth)
- Current annual tax
- $6,481 · $540/mo
- Projected year-2 tax
- $6,494 · $541/mo
- Expected delta
- +$13/yr (+$1/mo · 0.2%)
ⓘ Screening estimate from a state-policy table — verify with the county assessor before closing.
Climate risk First Street
- Flood 1/10 Low FEMA zone X · 0% chance over 30 yrs
- Wildfire 2/10 Low
- Heat 2/10 Low 7 d/yr ≥94°F today · 15 d/yr by 30 yrs out
- Wind 1/10 Low
- Air quality 2/10 Low 0 unhealthy d/yr today · 1 by 30 yrs out
Nearby sold comps map
Loading sold comps map…
Walkable amenities ~0.75 mi
Loading nearby amenities…
Taxation est. · year 1
- Rental income
- $71,568
- − Mortgage interest
- −$21,566
- − Property taxes
- −$6,481
- − Insurance
- −$1,925
- − Repairs & maintenance
- −$5,725
- − Management
- −$5,725
- − Depreciation
- −$11,200
- Taxable income
- $18,945
- Est. tax owed @ 24.0%
- −$4,547
- After-tax cash flow
- $19,358/yr
For passive investors: Depreciation is non-cash, so a rental often shows a tax loss while cash-flowing — sheltering income. Rental losses are passive: they offset passive income freely, and up to $25,000/yr can offset ordinary (W-2) income if you actively participate and your MAGI is under $100k (phasing out to $0 by $150k); unused losses carry forward. On sale, claimed depreciation is recaptured at up to 25%, and gains may owe capital-gains tax (a 1031 exchange can defer both). Figures are a year-1 estimate at your 24.0% rate — not tax advice; consult a CPA.
Schools (NCES district)
- District
- Avon Central School District
- NCES district ID
- 3603660
- Math proficiency
- 53% ▬ 0.00%
- Reading proficiency
- 50% ▲ 12.00%
- Median HH income
- $55,407
- Composite
- 44.56/100
- National rank
- #2786
- State rank
- #349 of 590 in NY
Livability — Avon
- Score
- 72/100
- State rank
- #373
- US rank
- #6426
Category grades
Schools grade is shown separately in the Schools card above.
Census & demographics
- Census place
- Avon, NY
- County
- Livingston County · 6,576 people
- City population
- 6,576
- Metro
- Rochester, NY
- Population (ZIP)
- 6,576
- Household income
- $72,006
- Rent vs Own
- Severe rent burden
- 100.0
Population outlook (Livingston County) Hauer SSP2
- Today (2025)
- 63,466 people
- By 2030
- 61,966 · -2.4%
- By 2040
- 58,398 · -8.0%
- By 2050
- 54,955 · -13.4%
- By 2075
- 49,958 · -21.3%
- By 2100
- 43,944 · -30.8%
Race, ethnicity, and origin ACS 2023
- Neighborhood character
- Predominantly White (92%)
- Race & ethnicity
- White 92% Two or more races 4% Hispanic / Latino 2% Black 1%
- Common ancestry
- Romanian 6% Italian 4% Lithuanian 2%
- Foreign-born
- 2% · China, Canada
- Languages at home
- 98% English-only · Spanish 1%
Political lean MEDSL · Livingston
- 2024 margin
- Strong R (+21.4) · D 39.3% · R 60.7%
- 2008→2024 swing
- -13.6pp toward R · 2008: -7.9pp · 2024: -21.4pp
- All cycles
- 2024: R+21.4 2020: R+18.2 2016: R+27.8 2012: R+9.4 2008: R+7.9
Not yet ingested
- Civics
- —
Market trends
- HPI YoY
- ▼ -40.57%
- Current HPI
- 247.7027
- Rent YoY
- —
- Metro
- Rochester, NY
- State GDP YoY
- ▲ 2.60%
- F500 in state
- 92
Industry mix (Fortune 500 HQ in NY)
| Industry | F500 HQs | Revenue |
|---|---|---|
| Financial Services | 10 | $950B |
|
||
| Consumer Goods | 9 | $162B |
|
||
| Insurance | 4 | $225B |
|
||
| Telecommunications | 2 | $144B |
|
||
| Pharmaceuticals | 2 | $112B |
|
||
| Media / Entertainment | 2 | $69B |
|
||
Price history
+234.8% since first listed5 events — show timeline
- 2026-06-02 Listed $385,000 UNYREIS
- 2025-10-30 Rental Removed $780 UNYREIS
- 2025-10-23 Listed for Rent $780 UNYREIS
- 1999-04-20 Sold (Public Records) $152,000 Public Records
- 1996-06-20 Sold (Public Records) $115,000 Public Records
Property tax history
-0.8%/yrLatest (2025): $6,481 · +3.1% YoY. Source: county tax records.
Cash-flow waterfall
monthlySold comps — $/sqft
last 12 mo · ≤1 miLoading sold comps…