 🏗️ New Construction
101 Colgan Ave #26 · Santa Rosa, CA
Flood risk 8/10 · Major
- FEMA flood zone
- AE
- Chance of flooding over 30 yrs
- 0.99%
- Est. flood insurance / yr
- $1,737 – $8,500
Fire risk 5/10 · Moderate
- Est. fire insurance / yr
- $659 – $1,223
Heat risk 4/10 · Minor
- Hot days now (above 92°F)
- 7 days/yr
- Hot days in 30 yrs
- 16 days/yr
Wind risk 1/10 · Minimal
- Chance of severe wind over 30 yrs
- —
Air-quality risk 8/10 · Major
- Unhealthy air days now
- 15 days/yr
- Unhealthy air days in 30 yrs
- 17 days/yr
Risk factors via First Street. Map © Google.
Why this score? — see what drove the B grade
The composite is a weighted blend of 9 inputs, each scored 0–100. Each bar is that input's sub-score; the figure is the points it added to the 100-point composite (weight × sub-score).
- Cash flow +30.0/30.0
- DSCR +10.0/10.0
- 1% rule +9.1/10.0
- ARV discount +7.5/15.0
- Condition / age +4.0/5.0
- Livability +3.8/5.0
- Schools +3.7/10.0
- Rent growth +2.8/5.0
- Appreciation +0.0/10.0
$169,000
🖨 Deal sheet 📄 Offer letter ✓ Due diligence
Listing remarks
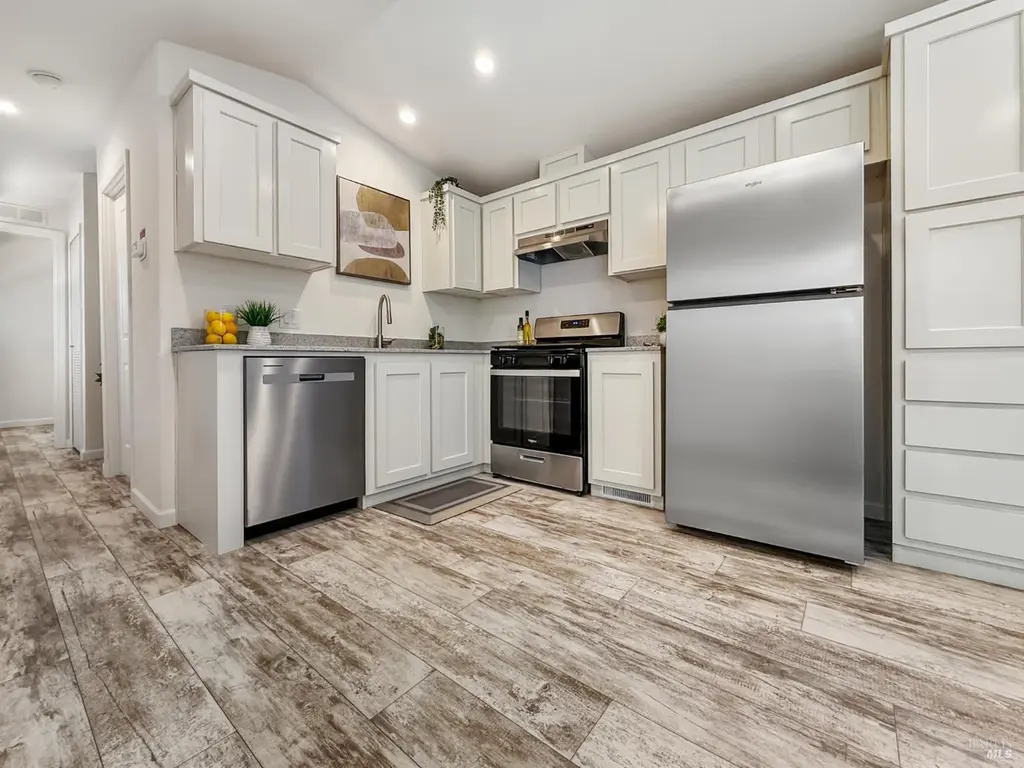
Welcome to this beautiful new home, offering the perfect balance of comfort, style, and practicality. This 2-bedroom, 1-bathroom residence features a thoughtfully designed floor plan and a bright, inviting living space. The kitchen is equipped with stainless steel appliances, including a gas range, dishwasher, and refrigerator, making meal preparation a breeze. Interior laundry hookups provide added convenience, while the heating and air conditioning system ensures comfort throughout the seasons. Conveniently situated near shopping, restaurants, and freeway access, this home is an excellent opportunity for those seeking modern living in a central location.
Key facts
- Central location
- Gas range
- 2 parking spots
Tags
Property features AI
Finance
- Financial info: Space rent currently listed as $0; Land lease amount listed separately as $975
- HOA & community: No association; Not a senior community; Land lease: No; Park: Colgan park
Exterior
- Parking: 2 assigned parking spaces
- Utilities: Public sewer; No on-site power production
- Home design: Manufactured home in park; Single-wide; New construction
- Construction: Manufacturer: Champion; Skirting: Other
- Exterior features: Composition roof
Interior
- Kitchen: Dishwasher; Gas range; Refrigerator; Range hood; Slab countertops
- Bedrooms: 2 bedrooms
- Flooring: Other
- Bathrooms: 1 full bathroom with shower stall
- Heating & cooling: Central heating; Central air conditioning
- Interior features: Dishwasher; Free standing gas range; Free standing refrigerator; Range hood; Slab countertops
- Laundry & utility: Washer/dryer hookups only
Neighborhood map
What this means for you Summary
Snapshot
- This is a 2-bed/1.0-bath manufactured listed at $169k. Condition is rated good.
Deal economics
- At list price, monthly cash flow is $231 ($3k/yr) — positive.
- The deal already cash-flows at list — no discount required.
- Meets the 1% rule at list price ($2k rent vs $169k).
- Recommended offer: $166k (1.5% below list) — sets the bar for market timing.
- Cap rate 11.4% vs local median 2.5% in Santa Rosa — top-decile yield for the area; either an underpriced asset or a hidden risk that comps aren't pricing in. Stress-test before assuming the spread holds.
Location & tenants
- Location reads 75/100 on livability (#112 in CA, #3,940 nationally) — a middle-class / working-renter tenant base. Strengths: amenities A+, commute A+, employment A+; Watch: schools C-, cost of living F.
- Santa Rosa High (urban): math 31% / reading 47% proficiency, ranked #703 of 1,400 in CA (top 50%) — families likely to look elsewhere, expect single-tenant / working-renter base with shorter leases.
- Market conditions: Rents rising (+1.1%/yr); 248 active listings in the ZIP; 14 comparable units currently listed for rent nearby; rentals leasing fast (median 14d on market — plan ~1-2 weeks tenant-placement turnaround); solid renter incomes; 1,039 units permitted in Sonoma County in 2024 (185 in 5+ unit buildings).
Forward outlook
- Local home prices are declining (-3.0%/yr); year-one equity from $1k of loan paydown is wiped out by about $5k of value loss. Plan a longer hold.
- Sonoma County population projected at +8% by 2050 — modest demand growth; plan on rents tracking national, not racing it.
Negotiation context
- It's been on market 17 days — a 2% lower offer ($166k) is reasonable based on typical stale-listing flexibility.
Risks & watch-outs
- Watch-outs: flood insurance adds $427/mo.
- Climate carrying-cost: in FEMA flood zone AE (mandatory federal flood insurance); moderate wildfire risk — expect insurance premiums to compound above CPI over the hold.
Questions for the listing agent
- What's the actual annual flood-insurance premium (NFIP or private), and is the property in a SFHA with mandatory coverage?
- Is there a deadline driving the sale (1031 exchange, divorce, estate, relocation)? That informs how much negotiation room exists.
- What's the average days-on-market for RENTAL listings here right now (not sales)? A rising rental-DOM trend means longer vacancies and softer asking-rent achievability than the comps imply.
- What's the recent tenant-quality profile in this submarket — average credit score on applications, eviction rate, late-payment / NSF rate, and stable-employment percentage? A property-management company in the area should have these aggregated.
- How much new for-sale + rental construction is in the pipeline within 1–3 miles? Heavy new supply typically softens prices + rents 12–24 months out; constrained supply supports both.
Investment metrics
- 1% rule
- 1.41% ✓
- Cap rate
- 11.38%
- Cash-on-cash
- 18.17%
- DSCR
- 1.81
- GRM
- 5.9
CMA / ARV
- ARV (on-the-fly)
- $155,120
- Comps found
- 1
Show comp detail 1 sale within ~0.75 mi
| Address | Dist | Beds/Ba | Sqft | Sold | Price | $/sf | Match |
|---|---|---|---|---|---|---|---|
| 101 Colgan Ave #24 | 0.04mi | 2/1.0 | 560 (0%) | 4mo | $155,000 | $277 | 95 |
Match score weights: distance 35% · size 25% · config 20% · recency 20%. Top-matched comps best support the ARV.
Projected returns pro-forma
-3.0% appreciation · 1.1% rent growth · sell at horizon
- IRR
- -9.2%
- Equity multiple
- 0.67×
- Total profit
- $-14,224
- Equity at exit
- $23,129
- IRR
- -3.3%
- Equity multiple
- 0.81×
- Total profit
- $-8,453
- Equity at exit
- $13,412
Cash invested: $43,434 (down + closing). Projections, not guarantees.
Landlord ↔ Tenant lean methodology
- Overall (STATE)
- 18 Strongly Tenant-Friendly
- State California
- 18 Strongly Tenant-Friendly · D+13
- County
- — inherits STATE
- City
- — inherits STATE
ZIP-level market 95404
- Rents YoY
- 1.1%
- Active inventory
- 248
- Price-to-rent
- 6.4×
Monthly cashflow live
- Estimated rent
- $2,190 high interval (Pro) →
- Mortgage (P&I)
- −$813
- Tax est. 1.5%
- −$194 /mo · $2,327/yr
- Insurance
- −$65
- Flood insurance flood zone
- −$427 /mo · $5,118/yr
- HOA
- −$0
- Vacancy / Maint / Mgmt
- −$460
- Net cashflow
- $231
Break-even live
UW: 25.0% down · 7.5% · 30yr · 1.5% tax · 5.0% vac · 8.0% maint · 8.0% mgmt
Financing live
Cash to close
- Down payment
- $38,780
- Closing costs
- $4,654
- Reserves months
- —
- Total cash needed
- —
Loan-product check · same deal, 3 products live
Conventional
25% down · 7.5% · 30yr
- Down + closing
- —
- Monthly P&I
- —
- Monthly cashflow
- —
- DSCR
- —
- Eligible?
- —
Personal DTI + credit; lowest rate.
DSCR
20% down · 8.5% · 30yr
- Down + closing
- —
- Monthly P&I
- —
- Monthly cashflow
- —
- DSCR
- —
- Eligible?
- —
No personal income docs; deal must DSCR.
Hard money
10% down · 12.0% · 12mo
- Down + closing
- —
- Monthly P&I
- —
- Monthly cashflow
- —
- DSCR
- —
- Eligible?
- —
Short-term bridge; refi at stabilization.
Rent comps 14 comps
| Address | Beds | Baths | Sqft | Rent | $/sqft | DOM | Units | Dist |
|---|---|---|---|---|---|---|---|---|
| 147 Colgan Ave Santa Rosa, CA | 1.0–2.0 | 1.0 | 623 | $1,941 | $3.12 | 13d | 3 | 0.08mi |
| 777 Aston Ave Santa Rosa, CA | 1.0 | 1.0 | 635 | $1,749 | $2.75 | 13d | 1 | 0.39mi |
| 2146 Bedford St Santa Rosa, CA | 1.0 | 1.0 | 720 | $1,900 | $2.64 | 13d | 1 | 0.54mi |
| 2146 Bedford St Unit 2134-211 Santa Rosa, CA | 1.0 | 1.0 | 720 | $2,075 | $2.88 | 13d | 1 | 0.55mi |
| 2111 Kawana Springs Rd Santa Rosa, CA | 1.0–3.0 | 1.0–2.0 | 936 | $2,892 | $3.09 | 13d | 8 | 0.62mi |
| 1020 Kawana Springs Rd Santa Rosa, CA | 1.0–3.0 | 1.0–2.0 | 890 | $2,860 | $3.21 | 13d | 27 | 0.67mi |
| 240 Burt St Santa Rosa, CA | 1.0–2.0 | 1.0–2.0 | 742 | $2,563 | $3.45 | 13d | 10 | 0.88mi |
| 445 S E St Unit 20 Santa Rosa, CA | 1.0 | 1.0 | 575 | $1,795 | $3.12 | 13d | 1 | 0.95mi |
| 1467 Maple Ave Unit 1467 Santa Rosa, CA | 1.0 | 1.0 | 674 | $1,750 | $2.60 | 13d | 1 | 1.20mi |
| 750 Apple Creek Ln Santa Rosa, CA | 1.0–2.0 | 1.0–2.0 | 748 | $2,599 | $3.47 | 13d | 16 | 1.24mi |
| 420 Mendocino Ave Santa Rosa, CA | 2.0 | 1.0–2.0 | 784 | $3,923 | $5.00 | 13d | 21 | 1.36mi |
| 1018 Bellevue Ave Santa Rosa, CA | 1.0–4.0 | 1.0–2.0 | 1010 | $1,874 | $1.86 | 13d | 1 | 1.42mi |
| 724 Morgan St Unit 726b Santa Rosa, CA | 1.0 | 1.0 | 600 | $1,600 | $2.67 | 23d | 1 | 1.43mi |
| 888 4th St Santa Rosa, CA | 1.0–2.0 | 1.0–2.0 | 685 | $3,485 | $5.08 | 13d | 20 | 1.47mi |
Listing history 14 events
-
2026-06-18days on market $169,000 Active 17 DOM
-
2026-06-17days on market $169,000 Active 16 DOM
-
2026-06-16days on market $169,000 Active 15 DOM
-
2026-06-15days on market $169,000 Active 14 DOM
-
2026-06-14days on market $169,000 Active 12 DOM
-
2026-06-13days on market $169,000 Active 11 DOM
-
2026-06-10days on market $169,000 Active 9 DOM
-
2026-06-09days on market $169,000 Active 8 DOM
-
2026-06-08days on market $169,000 Active 7 DOM
-
2026-06-07days on market $169,000 Active 6 DOM
-
2026-06-05days on market $169,000 Active 3 DOM
-
2026-06-03days on market $169,000 Active 2 DOM
-
2026-06-02remarks 664-char remark
-
2026-06-02$169,000 Active 1 DOM
ⓘ Source: listings_history table (triggers on properties + properties_extension) + one-shot
backfill from property_details.listing_events for pre-trigger history.
Climate risk First Street
- Flood 8/10 Severe FEMA zone AE · 99% chance over 30 yrs
- Wildfire 5/10 Major
- Heat 4/10 Moderate 7 d/yr ≥92°F today · 16 d/yr by 30 yrs out
- Wind 1/10 Low
- Air quality 8/10 Severe 15 unhealthy d/yr today · 17 by 30 yrs out
Nearby sold comps map
Loading sold comps map…
Walkable amenities ~0.75 mi
Loading nearby amenities…
Taxation est. · year 1
- Rental income
- $26,274
- − Mortgage interest
- −$8,689
- − Property taxes
- −$2,327
- − Insurance
- −$5,894
- − Repairs & maintenance
- −$2,102
- − Management
- −$2,102
- − Depreciation
- −$4,513
- Taxable income
- $648
- Est. tax owed @ 24.0%
- −$156
- After-tax cash flow
- $2,619/yr
For passive investors: Depreciation is non-cash, so a rental often shows a tax loss while cash-flowing — sheltering income. Rental losses are passive: they offset passive income freely, and up to $25,000/yr can offset ordinary (W-2) income if you actively participate and your MAGI is under $100k (phasing out to $0 by $150k); unused losses carry forward. On sale, claimed depreciation is recaptured at up to 25%, and gains may owe capital-gains tax (a 1031 exchange can defer both). Figures are a year-1 estimate at your 24.0% rate — not tax advice; consult a CPA.
Condition & rehab AI · 12 photos
This beautiful new manufactured home offers a well-designed floor plan and modern living in a central location. With good condition and minimal repairs needed, it's an excellent opportunity for those seeking a move-in-ready property.
Value-add opportunities
- Both Paint exterior — Enhances curb appeal and resale value
- Both Replace window treatments — Improves aesthetics and energy efficiency
- Both Install smart home devices — Enhances convenience and marketability
Renovation cost estimate screening
Value-add ROI direction
- Both Paint exterior — Enhances curb appeal and resale value ↑
- Both Replace window treatments — Improves aesthetics and energy efficiency ↑
- Both Install smart home devices — Enhances convenience and marketability ↑
ⓘ Cost ranges are severity-bucket heuristics (US national rule-of-thumb). Get contractor quotes + a written scope before underwriting a rehab budget.
Schools (NCES district)
- District
- Santa Rosa High
- NCES district ID
- 0635830
- Math proficiency
- 31% —
- Reading proficiency
- 47% —
- Median HH income
- $62,000
- Composite
- 37.25/100
- National rank
- #8972
- State rank
- #703 of 1400 in CA
Livability — Santa Rosa
- Score
- 75/100
- State rank
- #112
- US rank
- #3940
Category grades
Schools grade is shown separately in the Schools card above.
Census & demographics
- County
- Sonoma County · 449,805 people
- City population
- 210,074
- Metro
- Santa Rosa-Petaluma, CA
- Population (ZIP)
- 37,011
- Household income
- $105,437
- Rent vs Own
- Severe rent burden
- 1663.0
Population outlook (Sonoma County) Hauer SSP2
- Today (2025)
- 539,935 people
- By 2030
- 554,870 · +2.8%
- By 2040
- 573,262 · +6.2%
- By 2050
- 580,715 · +7.6%
- By 2075
- 579,229 · +7.3%
- By 2100
- 547,835 · +1.5%
Race, ethnicity, and origin ACS 2023
- Neighborhood character
- Diverse neighborhood (Simpson 0.56)
- Race & ethnicity
- White 61% Hispanic / Latino 25% Two or more races 13% Asian 7% Black 2%
- Hispanic origin (detail)
- Mexican 21%
- Common ancestry
- Lithuanian 4% Italian 4% Slovak 3%
- Foreign-born
- 14% · Canada, China
- Languages at home
- 76% English-only · Spanish 16% Other Asian/Pacific 2% Tagalog/Filipino 2%
Political lean MEDSL · Sonoma
- 2024 margin
- Solid D (+46.2) · D 71.4% · R 25.2% · Other 3.3%
- 2008→2024 swing
- -3.4pp toward R · 2008: 49.6pp · 2024: 46.2pp
- All cycles
- 2024: D+46.2 2020: D+51.5 2016: D+47.9 2012: D+44.9 2008: D+49.6
Not yet ingested
- Civics
- —
Market trends
- HPI YoY
- ▼ -797.65%
- Current HPI
- 244.7593
- Rent YoY
- ▲ 1.10%
- Metro
- Santa Rosa-Petaluma, CA
- State GDP YoY
- ▲ 3.21%
- F500 in state
- 116
Industry mix (Fortune 500 HQ in CA)
| Industry | F500 HQs | Revenue |
|---|---|---|
| Technology | 27 | $1,492B |
|
||
| Financial Services | 3 | $174B |
|
||
| Retail | 3 | $44B |
|
||
| Insurance | 3 | $26B |
|
||
| Media / Entertainment | 2 | $115B |
|
||
| Pharmaceuticals / Biotech | 2 | $62B |
|
||
Price history
1 event — show timeline
- 2026-06-01 Listed $169,000 BAREIS
Cash-flow waterfall
monthlySold comps — $/sqft
last 12 mo · ≤1 miLoading sold comps…