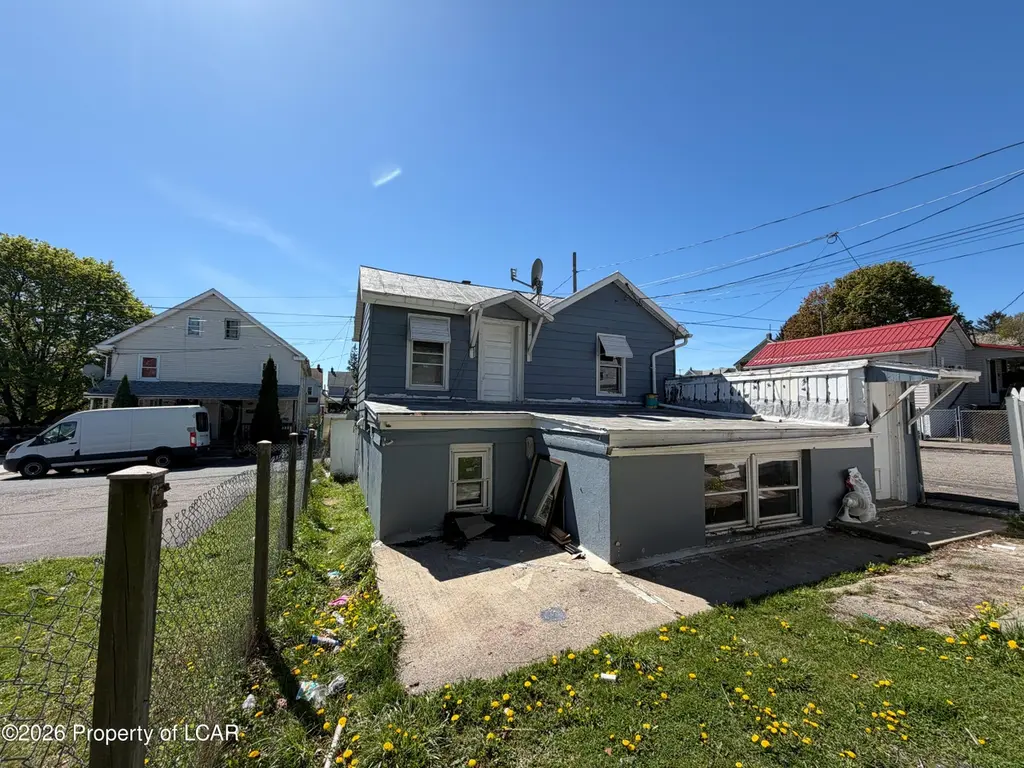
540 Freemont Ct · Hazleton, PA
Flood risk 1/10 · Minimal
- FEMA flood zone
- X (unshaded)
- Chance of flooding over 30 yrs
- 0.0%
- Est. flood insurance / yr
- $507 – $1,088
Fire risk 3/10 · Minor
- Est. fire insurance / yr
- $511 – $949
Heat risk 3/10 · Minor
- Hot days now (above 91°F)
- 7 days/yr
- Hot days in 30 yrs
- 16 days/yr
Wind risk 4/10 · Minor
- Chance of severe wind over 30 yrs
- 8.0%
Air-quality risk 2/10 · Minimal
- Unhealthy air days now
- 1 days/yr
- Unhealthy air days in 30 yrs
- 2 days/yr
Risk factors via First Street. Map © Google.
Why this score? — see what drove the C+ grade
The composite is a weighted blend of 9 inputs, each scored 0–100. Each bar is that input's sub-score; the figure is the points it added to the 100-point composite (weight × sub-score).
- Cash flow +23.7/30.0
- ARV discount +15.0/15.0
- DSCR +7.6/10.0
- 1% rule +6.2/10.0
- Livability +3.4/5.0
- Rent growth +2.5/5.0
- Condition / age +2.2/5.0
- Schools +2.0/10.0
- Appreciation +0.0/10.0
$130,000
🖨 Deal sheet 📄 Offer letter ✓ Due diligence
Listing remarks
CALLING ALL INVESTORS. ADD THIS PROPERTY TO YOUR PORTFOLIO 4-bedroom, 1-bath home on a desirable corner lot priced at $135,000! SOLD AS IS--perfect opportunity for investors or buyers looking to add value. Spacious yard offers great outdoor potential.
Key facts
- 1,500 sq ft lot
- Listed 35 days
Property features AI
Exterior
- Utilities: Public water; Public sewer
- Home design: Single family residence; Two levels; Residential zoning
- Construction: Vinyl siding; 1,200 above-grade finished area
- Exterior features: Fenced yard; Corner lot
Interior
- Kitchen: Eat-in kitchen
- Bathrooms: 1 full bathroom
- Heating & cooling: Electric baseboard heating
- Interior features: Eat-in kitchen; 7 total rooms
Neighborhood map
What this means for you Summary
Snapshot
- This is a 4-bed/1.0-bath single-family listed at $130k. Condition is rated fair.
Deal economics
- At list price, monthly cash flow is $247 ($3k/yr) — positive.
- The deal already cash-flows at list — no discount required.
- Meets the 1% rule at list price ($1k rent vs $130k).
- Recommended offer: $126k (3.0% below list) — sets the bar for market timing.
- Cap rate 8.6% vs local median 4.5% in Hazleton — top-decile yield for the area; either an underpriced asset or a hidden risk that comps aren't pricing in. Stress-test before assuming the spread holds.
Location & tenants
- Location reads 67/100 on livability (#930 in PA) — a middle-class / working-renter tenant base. Strengths: cost of living A+, housing A+, crime A-; Watch: schools F, amenities F, commute F.
- Hazleton Area SD (suburban): math 18% / reading 30% proficiency, ranked #476 of 539 in PA (top 88%) — low school quality limits family demand, transient renter base, plan for 1-2y turnover.
- Market conditions: 118 active listings in the ZIP; 1 comparable units currently listed for rent nearby; 349 units permitted in Luzerne County in 2024 (16 in 5+ unit buildings).
Forward outlook
- Local home prices are declining (-3.0%/yr); year-one equity from $899 of loan paydown is wiped out by about $4k of value loss. Plan a longer hold.
- Luzerne County population projected at +4% by 2050 — modest demand growth; plan on rents tracking national, not racing it.
Negotiation context
- It's been on market 35 days — a 3% lower offer ($126k) is reasonable based on typical stale-listing flexibility.
Questions for the listing agent
- It's been on market 35 days. Have you received any prior offers? Is the seller open to a 3% concession, seller financing, or rate buy-down credit?
- Have any recent inspections been done? Can we get a copy of the seller's disclosures and any deferred-maintenance estimates?
- Is there a deadline driving the sale (1031 exchange, divorce, estate, relocation)? That informs how much negotiation room exists.
- Schools are F-rated, which usually means shorter tenancies and higher turnover. Who's the typical renter profile here, and what's been the actual vacancy rate?
- What's the average days-on-market for RENTAL listings here right now (not sales)? A rising rental-DOM trend means longer vacancies and softer asking-rent achievability than the comps imply.
- What's the recent tenant-quality profile in this submarket — average credit score on applications, eviction rate, late-payment / NSF rate, and stable-employment percentage? A property-management company in the area should have these aggregated.
- How much new for-sale + rental construction is in the pipeline within 1–3 miles? Heavy new supply typically softens prices + rents 12–24 months out; constrained supply supports both.
Investment metrics
- 1% rule
- 1.12% ✓
- Cap rate
- 8.57%
- Cash-on-cash
- 8.15%
- DSCR
- 1.36
- GRM
- 7.5
CMA / ARV
- ARV (median comp)
- $189,864
- List price
- $130,000
- Delta
- -31.53%
- Verdict
- UNDERPRICED
- Comps
- 20 within 1.0 mi
Show comp detail 12 sales within ~0.75 mi
| Address | Dist | Beds/Ba | Sqft | Sold | Price | $/sf | Match |
|---|---|---|---|---|---|---|---|
| 591 Cleveland St | 0.10mi | 3/1.0 (-1) | 1,503 (0%) | 13mo | $140,000 | $93 | 80 |
| 808 3rd St | 0.16mi | 3/2.0 (-1) | 1,556 (+4%) | 1mo | $325,000 | $209 | 76 |
| 527 Monges St | 0.15mi | 4/2.0 | 1,540 (+2%) | 14mo | $240,000 | $156 | 73 |
| 720 7th St | 0.20mi | 4/2.0 | 1,700 (+13%) | 1mo | $245,000 | $144 | 64 |
| 696 Garfield St | 0.37mi | 3/1.0 (-1) | 1,400 (-7%) | 11mo | $235,000 | $168 | 57 |
| 575 Scott Ct | 0.28mi | 3/1.0 (-1) | 1,343 (-11%) | 10mo | $175,000 | $130 | 56 |
| 706 Monges St | 0.31mi | 3/2.0 (-1) | 1,657 (+10%) | 7mo | $228,000 | $138 | 54 |
| 608 Pardee St | 0.24mi | 3/1.0 (-1) | 1,280 (-15%) | 7mo | $229,900 | $180 | 53 |
| 555 Garfield St | 0.20mi | 3/2.0 (-1) | 1,688 (+12%) | 9mo | $183,000 | $108 | 53 |
| 21 8th St | 0.59mi | 3/1.5 (-1) | 1,485 (-1%) | 14mo | $197,000 | $133 | 52 |
| 619 Perry Ct | 0.46mi | 4/1.5 | 1,668 (+11%) | 14mo | $180,000 | $108 | 46 |
| 900 9th St | 0.35mi | 3/2.0 (-1) | 1,305 (-13%) | 13mo | $216,000 | $166 | 42 |
Match score weights: distance 35% · size 25% · config 20% · recency 20%. Top-matched comps best support the ARV.
Projected returns pro-forma
-3.0% appreciation · 3.0% rent growth · sell at horizon
- IRR
- -3.9%
- Equity multiple
- 0.85×
- Total profit
- $-5,306
- Equity at exit
- $19,383
- IRR
- 5.8%
- Equity multiple
- 1.43×
- Total profit
- $15,734
- Equity at exit
- $11,240
Cash invested: $36,400 (down + closing). Projections, not guarantees.
Landlord ↔ Tenant lean methodology
- Overall (STATE)
- 62 Landlord-Friendly
- State Pennsylvania
- 62 Landlord-Friendly · EVEN
- County
- — inherits STATE
- City
- — inherits STATE
ZIP-level market 18201
- Home prices YoY
- -14.9%
- Active inventory
- 118
- Price-to-rent
- 7.5×
Monthly cashflow live
- Estimated rent
- $1,450 medium interval (Pro) →
- Mortgage (P&I)
- −$682
- Tax est. 1.5%
- −$162 /mo · $1,950/yr
- Insurance
- −$54
- HOA
- −$0
- Vacancy / Maint / Mgmt
- −$304
- Net cashflow
- $247
Break-even live
UW: 25.0% down · 7.5% · 30yr · 1.5% tax · 5.0% vac · 8.0% maint · 8.0% mgmt
Financing live
Cash to close
- Down payment
- $32,500
- Closing costs
- $3,900
- Reserves months
- —
- Total cash needed
- —
Loan-product check · same deal, 3 products live
Conventional
25% down · 7.5% · 30yr
- Down + closing
- —
- Monthly P&I
- —
- Monthly cashflow
- —
- DSCR
- —
- Eligible?
- —
Personal DTI + credit; lowest rate.
DSCR
20% down · 8.5% · 30yr
- Down + closing
- —
- Monthly P&I
- —
- Monthly cashflow
- —
- DSCR
- —
- Eligible?
- —
No personal income docs; deal must DSCR.
Hard money
10% down · 12.0% · 12mo
- Down + closing
- —
- Monthly P&I
- —
- Monthly cashflow
- —
- DSCR
- —
- Eligible?
- —
Short-term bridge; refi at stabilization.
Rent comps 1 comps
| Address | Beds | Baths | Sqft | Rent | $/sqft | DOM | Units | Dist |
|---|---|---|---|---|---|---|---|---|
| 538 Carson St Hazleton, PA | 3.0 | 1.0 | 1400 | $1,450 | $1.04 | 43d | 1 | 0.54mi |
Listing history 14 events
-
2026-06-18status $130,000 Pending 35 DOM
-
2026-06-17days on market $130,000 Active 35 DOM
-
2026-06-16days on market $130,000 Active 34 DOM
-
2026-06-15days on market $130,000 Active 33 DOM
-
2026-06-14days on market $130,000 Active 31 DOM
-
2026-06-12days on market $130,000 Active 30 DOM
-
2026-06-09days on market $130,000 Active 27 DOM
-
2026-06-08days on market $130,000 Active 26 DOM
-
2026-06-07days on market $130,000 Active 25 DOM
-
2026-06-02days on market $130,000 Active 20 DOM
-
2026-06-01days on market $130,000 Active 19 DOM
-
2026-05-31days on market $130,000 Active 18 DOM
-
2026-05-30days on market $130,000 Active 17 DOM
-
2026-05-13$130,000 Active 251-char remark
ⓘ Source: listings_history table (triggers on properties + properties_extension) + one-shot
backfill from property_details.listing_events for pre-trigger history.
Climate risk First Street
- Flood 1/10 Low FEMA zone X (unshaded) · 0% chance over 30 yrs
- Wildfire 3/10 Moderate
- Heat 3/10 Moderate 7 d/yr ≥91°F today · 16 d/yr by 30 yrs out
- Wind 4/10 Moderate 8% chance of damaging wind over 30 yrs
- Air quality 2/10 Low 1 unhealthy d/yr today · 2 by 30 yrs out
Nearby sold comps map
Loading sold comps map…
Walkable amenities ~0.75 mi
Loading nearby amenities…
Taxation est. · year 1
- Rental income
- $17,400
- − Mortgage interest
- −$7,282
- − Property taxes
- −$1,950
- − Insurance
- −$650
- − Repairs & maintenance
- −$1,392
- − Management
- −$1,392
- − Depreciation
- −$3,782
- Taxable income
- $952
- Est. tax owed @ 24.0%
- −$229
- After-tax cash flow
- $2,737/yr
For passive investors: Depreciation is non-cash, so a rental often shows a tax loss while cash-flowing — sheltering income. Rental losses are passive: they offset passive income freely, and up to $25,000/yr can offset ordinary (W-2) income if you actively participate and your MAGI is under $100k (phasing out to $0 by $150k); unused losses carry forward. On sale, claimed depreciation is recaptured at up to 25%, and gains may owe capital-gains tax (a 1031 exchange can defer both). Figures are a year-1 estimate at your 24.0% rate — not tax advice; consult a CPA.
Condition & rehab AI · 18 photos
This property requires moderate renovations, including repairs to the kitchen, bathroom, exterior, and plumbing. Painting and flooring replacement can significantly increase its value.
Repairs flagged
- Major Exposed plumbing — Exposed plumbing indicates potential water damage
- Major Missing countertops — Missing countertops in the kitchen
- Major Missing fixtures — Missing fixtures in the bathroom
- Major Damaged siding — Damaged siding requires repair
- Major Missing windows — Missing windows need replacement
Value-add opportunities
- Both Painting — Fresh paint can improve curb appeal and interior aesthetics
- Both Flooring replacement — New flooring can enhance the home's value and appeal
- Both Plumbing repairs — Fixing exposed plumbing can prevent further damage and improve functionality
Renovation cost estimate screening
| Repair item | Severity | Est. cost |
|---|---|---|
| Exposed plumbing · Exposed plumbing indicates potential water damage | Major | $15,000–50,000 |
| Missing countertops · Missing countertops in the kitchen | Major | $15,000–50,000 |
| Missing fixtures · Missing fixtures in the bathroom | Major | $15,000–50,000 |
| Damaged siding · Damaged siding requires repair | Major | $15,000–50,000 |
| Missing windows · Missing windows need replacement | Major | $15,000–50,000 |
| Total estimated repair cost · 5 items | $75,000–250,000 |
Value-add ROI direction
- Both Painting — Fresh paint can improve curb appeal and interior aesthetics ↑
- Both Flooring replacement — New flooring can enhance the home's value and appeal ↑
- Both Plumbing repairs — Fixing exposed plumbing can prevent further damage and improve functionality ↑
ⓘ Cost ranges are severity-bucket heuristics (US national rule-of-thumb). Get contractor quotes + a written scope before underwriting a rehab budget.
Schools (NCES district)
- District
- Hazleton Area SD
- NCES district ID
- 4211700
- Math proficiency
- 18% ▼ -3.00%
- Reading proficiency
- 30% ▼ -15.00%
- Median HH income
- $42,247
- Composite
- 20.44/100
- National rank
- #8582
- State rank
- #476 of 539 in PA
Livability — Hazleton
- Score
- 67/100
- State rank
- #930
- US rank
- #10115
Category grades
Schools grade is shown separately in the Schools card above.
Census & demographics
- Census place
- Hazleton, PA
- City population
- 13,755
- Population (ZIP)
- 31,428
Population outlook (Luzerne County) Hauer SSP2
- Today (2025)
- 319,505 people
- By 2030
- 319,943 · +0.1%
- By 2040
- 322,643 · +1.0%
- By 2050
- 330,817 · +3.5%
- By 2075
- 379,145 · +18.7%
- By 2100
- 431,908 · +35.2%
Race, ethnicity, and origin ACS 2023
- Neighborhood character
- Majority Hispanic (60%)
- Race & ethnicity
- Hispanic / Latino 60% White 36% Two or more races 18% Black 2%
- Hispanic origin (detail)
- Mexican 6% Puerto Rican 6% Dominican 41%
- Common ancestry
- Romanian 5% Iranian 1% Russian 1%
- Foreign-born
- 36% · Canada, Jamaica
- Languages at home
- 43% English-only · Spanish 54% Russian/Polish/Slavic 1% Other Indo-European 1%
Political lean MEDSL · Luzerne
- 2024 margin
- R (+19.2) · D 40.0% · R 59.2%
- 2008→2024 swing
- -27.6pp toward R · 2008: 8.4pp · 2024: -19.2pp
- All cycles
- 2024: R+19.2 2020: R+14.4 2016: R+19.6 2012: D+4.8 2008: D+8.4
Not yet ingested
- Civics
- —
Market trends
- HPI YoY
- ▼ -62.00%
- Current HPI
- 354.7443
- Rent YoY
- —
- Metro
- —
- State GDP YoY
- ▲ 1.68%
- F500 in state
- 34
Industry mix (Fortune 500 HQ in PA)
| Industry | F500 HQs | Revenue |
|---|---|---|
| Healthcare | 2 | $309B |
|
||
| Insurance | 2 | $27B |
|
||
| Telecommunications / Media | 1 | $124B |
|
||
| Industrial Distribution | 1 | $22B |
|
||
| Financial Services | 1 | $20B |
|
||
| Chemicals / Materials | 1 | $18B |
|
||
Price history
2 events — show timeline
- 2026-06-18 Pending — LCAR
- 2026-05-13 Listed $130,000 LCAR
Cash-flow waterfall
monthlySold comps — $/sqft
last 12 mo · ≤1 miLoading sold comps…