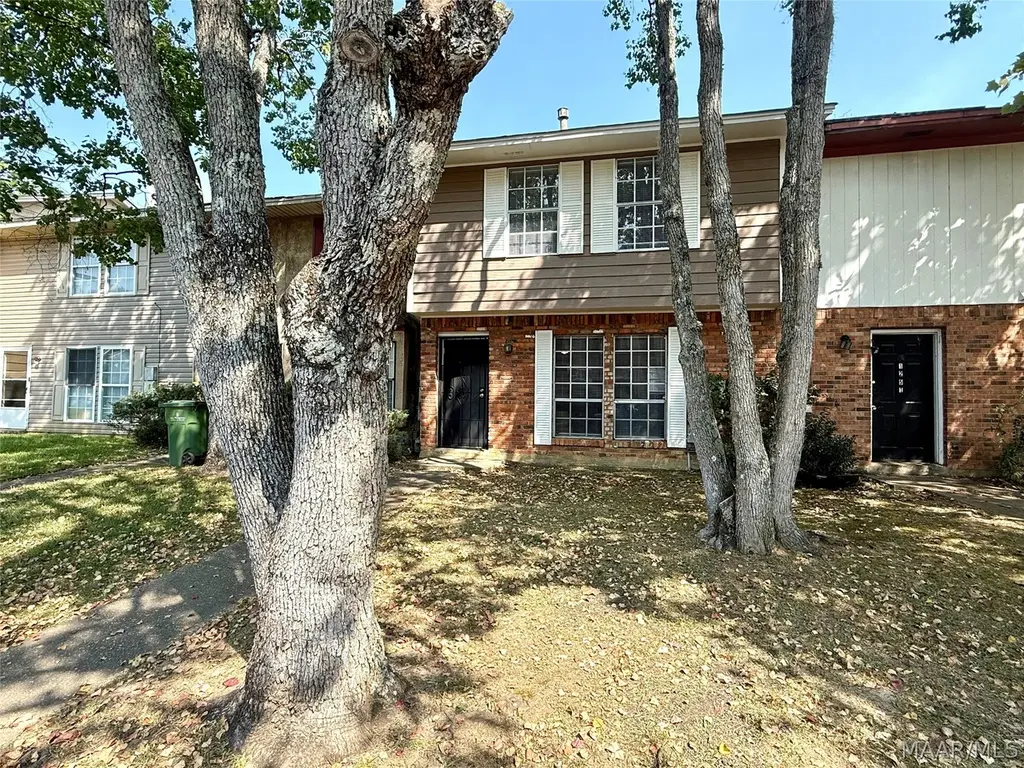
1249 Seth Johnson Dr · Montgomery, AL
Flood risk 1/10 · Minimal
- FEMA flood zone
- X (unshaded)
- Chance of flooding over 30 yrs
- 0.0%
- Est. flood insurance / yr
- $507 – $1,088
Fire risk 3/10 · Minor
- Est. fire insurance / yr
- $916 – $1,700
Heat risk 7/10 · Major
- Hot days now (above 108°F)
- 7 days/yr
- Hot days in 30 yrs
- 20 days/yr
Wind risk 8/10 · Major
- Chance of severe wind over 30 yrs
- 80.0%
Air-quality risk 2/10 · Minimal
- Unhealthy air days now
- 1 days/yr
- Unhealthy air days in 30 yrs
- 1 days/yr
Risk factors via First Street. Map © Google.
Why this score? — see what drove the C+ grade
The composite is a weighted blend of 9 inputs, each scored 0–100. Each bar is that input's sub-score; the figure is the points it added to the 100-point composite (weight × sub-score).
- Cash flow +30.0/30.0
- DSCR +10.0/10.0
- 1% rule +9.0/10.0
- Rent growth +3.9/5.0
- Livability +3.2/5.0
- Condition / age +2.5/5.0
- Schools +1.7/10.0
- ARV discount +0.0/15.0
- Appreciation +0.0/10.0
$85,000
🖨 Deal sheet 📄 Offer letter ✓ Due diligence
Listing remarks MLS
OPEN HOUSE Sunday, May 17th from 2-4! Hosted by Gloria McClain, Realtor. Cute, updated townhome in Seth Johnson ready for new owner!! Beautiful LVP flooring just installed! Plus the interior has been painted a beautiful gray. Great room is spacious and is open to the kitchen. Half bath and laundry room downstairs. Upstairs you will find 3 bedrooms and a full bath. Great starter home, or a great investment as a rental home! 100% financing available if purchased as primary residence. Move in ready! Call today for your personal showing!
Key facts
- Parking
- Built 1981
- Listed 59 days
Neighborhood map
What this means for you Summary
Snapshot
- This is a 3-bed/2.0-bath single-family listed at $85k.
Deal economics
- At list price, monthly cash flow is $414 ($5k/yr) — positive.
- The deal already cash-flows at list — no discount required.
- Meets the 1% rule at list price ($1k rent vs $85k).
- Recommended offer: $82k (3.0% below list) — sets the bar for market timing.
- Cap rate 12.1% vs local median 6.0% in Montgomery — top-decile yield for the area; either an underpriced asset or a hidden risk that comps aren't pricing in. Stress-test before assuming the spread holds.
Location & tenants
- Location reads 65/100 on livability (#138 in AL) — a middle-class / working-renter tenant base. Strengths: cost of living A+, housing A+; Watch: schools C-, employment D, crime F.
- Montgomery County (urban): math 9% / reading 31% proficiency, ranked #106 of 129 in AL (top 82%) — low school quality limits family demand, transient renter base, plan for 1-2y turnover; 70% free/reduced lunch — lower-income household profile, screen leases tightly.
- Market conditions: Rents rising fast (+5.7%/yr); 293 active listings in the ZIP; 14 comparable units currently listed for rent nearby; rentals at typical pace (median 21d on market — plan ~3-4 weeks tenant-placement turnaround); 460 units permitted in Montgomery County in 2024 (37 in 5+ unit buildings).
Forward outlook
- Local home prices are declining (-3.0%/yr); year-one equity from $588 of loan paydown is wiped out by about $3k of value loss. Plan a longer hold.
- Montgomery County population projected to shrink 8% by 2050 — rents likely to lag national; underwrite the cash flow, not the appreciation.
- At projected returns (-3.0% appreciation + 5.7% rent growth), your $24k cash investment doubles in ~6 years — after that, you're playing with house money.
Negotiation context
- It's been on market 59 days — a 3% lower offer ($82k) is reasonable based on typical stale-listing flexibility.
- 7 sale attempts since 24y ago with the ask held roughly flat each time — persistent listings suggest the price (not the market) is what's stuck; bring a comps-based counter.
- Current owner paid $29k; list at $85k implies a 193% gain — meaningful room to come down on a strong offer.
Risks & watch-outs
- Climate carrying-cost: severe wind risk, 80% chance of damaging wind over 30y; extreme-heat days projected 7→20/yr by 2055 (HVAC capex compounding) — expect insurance premiums to compound above CPI over the hold.
Questions for the listing agent
- It's been on market 59 days. Have you received any prior offers? Is the seller open to a 3% concession, seller financing, or rate buy-down credit?
- Is there a deadline driving the sale (1031 exchange, divorce, estate, relocation)? That informs how much negotiation room exists.
- Crime grade is F in this area — have there been break-ins, vandalism, or insurance claims at this property in the last 3 years? What carrier currently insures it and at what premium?
- What's the average days-on-market for RENTAL listings here right now (not sales)? A rising rental-DOM trend means longer vacancies and softer asking-rent achievability than the comps imply.
- What's the recent tenant-quality profile in this submarket — average credit score on applications, eviction rate, late-payment / NSF rate, and stable-employment percentage? A property-management company in the area should have these aggregated.
- How much new for-sale + rental construction is in the pipeline within 1–3 miles? Heavy new supply typically softens prices + rents 12–24 months out; constrained supply supports both.
Investment metrics
- 1% rule
- 1.40% ✓
- Cap rate
- 12.13%
- Cash-on-cash
- 20.86%
- DSCR
- 1.93
- GRM
- 6.0
CMA / ARV
- ARV (median comp)
- $69,769
- List price
- $85,000
- Delta
- 21.83%
- Verdict
- OVERPRICED
- Comps
- 5 within 1.0 mi
Show comp detail 10 sales within ~0.75 mi
| Address | Dist | Beds/Ba | Sqft | Sold | Price | $/sf | Match |
|---|---|---|---|---|---|---|---|
| 1702 Marlowe Dr | 0.62mi | 3/2.0 | 1,196 (-0%) | 2mo | $25,000 | $21 | 69 |
| 4507 Coventry Rd | 0.57mi | 3/1.5 | 1,163 (-3%) | 1mo | $40,000 | $34 | 66 |
| 1214 Seth Johnson Dr | 0.03mi | 2/2.0 (-1) | 1,102 (-8%) | 18mo | $49,500 | $45 | 65 |
| 1308 Biscayne Dr | 0.53mi | 3/2.0 | 1,148 (-4%) | 14mo | $120,900 | $105 | 56 |
| 1441 Flamingo Ln | 0.65mi | 3/1.5 | 1,283 (+7%) | 2mo | $65,000 | $51 | 55 |
| 1375 Biscayne Dr | 0.58mi | 3/2.0 | 1,328 (+11%) | 1mo | $50,000 | $38 | 54 |
| 4711 Banyan Dr | 0.46mi | 3/2.0 | 1,274 (+6%) | 23mo | $110,000 | $86 | 49 |
| 1518 Flamingo Ln | 0.67mi | 3/1.0 | 1,131 (-6%) | 9mo | $90,000 | $80 | 48 |
| 1330 Buckingham Dr | 0.69mi | 3/2.0 | 1,361 (+13%) | 16mo | $99,000 | $73 | 32 |
| 4608 Rainbow Rd | 0.72mi | 3/2.0 | 1,368 (+14%) | 22mo | $71,500 | $52 | 24 |
Match score weights: distance 35% · size 25% · config 20% · recency 20%. Top-matched comps best support the ARV.
Projected returns pro-forma
-3.0% appreciation · 5.65% rent growth · sell at horizon
- IRR
- 16.0%
- Equity multiple
- 1.66×
- Total profit
- $15,802
- Equity at exit
- $12,674
- IRR
- 26.4%
- Equity multiple
- 3.59×
- Total profit
- $61,666
- Equity at exit
- $7,349
Cash invested: $23,800 (down + closing). Projections, not guarantees.
Landlord ↔ Tenant lean methodology
- Overall (STATE)
- 90 Strongly Landlord-Friendly
- State Alabama
- 90 Strongly Landlord-Friendly · R+15
- County
- — inherits STATE
- City
- — inherits STATE
ZIP-level market 36116
- Home prices YoY
- -9.7%
- Rents YoY
- 5.7%
- Active inventory
- 293
- Price-to-rent
- 6.0×
Monthly cashflow live
- Estimated rent
- $1,186 high interval (Pro) →
- Mortgage (P&I)
- −$446
- Tax from tax record
- −$42 /mo · $502/yr
- Insurance
- −$35
- HOA
- −$0
- Vacancy / Maint / Mgmt
- −$249
- Net cashflow
- $414
Break-even live
UW: 25.0% down · 7.5% · 30yr · 1.5% tax · 5.0% vac · 8.0% maint · 8.0% mgmt
Financing live
Cash to close
- Down payment
- $21,250
- Closing costs
- $2,550
- Reserves months
- —
- Total cash needed
- —
Loan-product check · same deal, 3 products live
Conventional
25% down · 7.5% · 30yr
- Down + closing
- —
- Monthly P&I
- —
- Monthly cashflow
- —
- DSCR
- —
- Eligible?
- —
Personal DTI + credit; lowest rate.
DSCR
20% down · 8.5% · 30yr
- Down + closing
- —
- Monthly P&I
- —
- Monthly cashflow
- —
- DSCR
- —
- Eligible?
- —
No personal income docs; deal must DSCR.
Hard money
10% down · 12.0% · 12mo
- Down + closing
- —
- Monthly P&I
- —
- Monthly cashflow
- —
- DSCR
- —
- Eligible?
- —
Short-term bridge; refi at stabilization.
Rent comps 14 comps
| Address | Beds | Baths | Sqft | Rent | $/sqft | DOM | Units | Dist |
|---|---|---|---|---|---|---|---|---|
| 4581 Narrow Lane Rd Montgomery, AL | 1.0–2.0 | 1.0–2.0 | 866 | $800 | $0.92 | 43d | 2 | 0.21mi |
| 1219 Biscayne Dr Montgomery, AL | 4.0 | 1.5 | 1228 | $1,295 | $1.05 | 20d | 1 | 0.50mi |
| 4342 Sunshine Dr Montgomery, AL | 3.0 | 2.0 | 1323 | $1,250 | $0.94 | 13d | 1 | 0.76mi |
| 3212 Herbert Dr Montgomery, AL | 3.0 | 2.0 | 1180 | $1,425 | $1.21 | 20d | 1 | 0.95mi |
| 1114 Druid Hills Dr Montgomery, AL | 3.0 | 1.0 | 1192 | $1,250 | $1.05 | 20d | 1 | 1.10mi |
| 2230 Woodley Sq W Montgomery, AL | 1.0–2.0 | 1.0–2.0 | 902 | $898 | $1.00 | 13d | 11 | 1.12mi |
| 2401 Overhill Rd Montgomery, AL | 3.0 | 1.0 | 999 | $700 | $0.70 | 20d | 1 | 1.12mi |
| 253 John Morris Ave Montgomery, AL | 3.0 | 1.0 | 912 | $950 | $1.04 | 20d | 1 | 1.32mi |
| 548 Winston Dr Montgomery, AL | 2.0 | 2.5 | 1396 | $1,000 | $0.72 | 43d | 1 | 1.43mi |
| 3751 Wesley Dr Apt A Montgomery, AL | 2.0 | 1.0 | 1034 | $550 | $0.53 | 43d | 1 | 1.46mi |
| 3735 Wesley Dr Montgomery, AL | 3.0 | 1.0 | 1000 | $1,200 | $1.20 | 20d | 1 | 1.48mi |
| 3733 Wesley Dr Montgomery, AL | 3.0 | 1.0 | 1000 | $1,200 | $1.20 | 20d | 1 | 1.49mi |
| 2619 Brantford Pl Montgomery, AL | 3.0 | 2.0 | 1323 | $1,200 | $0.91 | 43d | 1 | 1.49mi |
| 3723 Wesley Dr Montgomery, AL | 3.0 | 1.0 | 1000 | $1,200 | $1.20 | 20d | 1 | 1.50mi |
Listing history 24 events
-
2026-06-18days on market $85,000 Active 59 DOM
-
2026-06-17days on market $85,000 Active 58 DOM
-
2026-06-16days on market $85,000 Active 57 DOM
-
2026-06-15days on market $85,000 Active 56 DOM
-
2026-06-14days on market $85,000 Active 54 DOM
-
2026-06-13days on market $85,000 Active 53 DOM
-
2026-06-10days on market $85,000 Active 51 DOM
-
2026-06-09days on market $85,000 Active 50 DOM
-
2026-06-08days on market $85,000 Active 49 DOM
-
2026-06-07days on market $85,000 Active 48 DOM
-
2026-06-03days on market $85,000 Active 44 DOM
-
2026-06-02days on market $85,000 Active 43 DOM
-
2026-06-01days on market $85,000 Active 42 DOM
-
2026-05-31days on market $85,000 Active 41 DOM
-
2026-05-30days on market $85,000 Active 40 DOM
-
2026-04-20$85,000 Active 544-char remark
Show marketing remark (544 chars)
OPEN HOUSE Sunday, May 17th from 2-4! Hosted by Gloria McClain, Realtor. Cute, updated townhome in Seth Johnson ready for new owner!! Beautiful LVP flooring just installed! Plus the interior has been painted a beautiful gray. Great room is spacious and is open to the kitchen. Half bath and laundry room downstairs. Upstairs you will find 3 bedrooms and a full bath. Great starter home, or a great investment as a rental home! 100% financing available if purchased as primary residence. Move in ready! Call today for your personal showing!
-
2026-02-01historical $1,200
-
2026-01-01$1,200
-
2025-09-21$95,000 Active
-
2004-04-19soldstatus $29,000
-
2004-02-25$29,900
-
2004-01-05$29,900
-
2003-09-17$34,900
-
2002-12-21$42,500
ⓘ Source: listings_history table (triggers on properties + properties_extension) + one-shot
backfill from property_details.listing_events for pre-trigger history.
Tax reassessment forecast AL · Resets to sale price
- Current annual tax
- $502 · $42/mo
- Projected year-2 tax
- $502 · $42/mo
- Expected delta
- $0/yr ($0/mo · 0.0%)
ⓘ Screening estimate from a state-policy table — verify with the county assessor before closing.
Climate risk First Street
- Flood 1/10 Low FEMA zone X (unshaded) · 0% chance over 30 yrs
- Wildfire 3/10 Moderate
- Heat 7/10 Severe 7 d/yr ≥108°F today · 20 d/yr by 30 yrs out
- Wind 8/10 Severe 80% chance of damaging wind over 30 yrs
- Air quality 2/10 Low 1 unhealthy d/yr today · 1 by 30 yrs out
Nearby sold comps map
Loading sold comps map…
Walkable amenities ~0.75 mi
Loading nearby amenities…
Taxation est. · year 1
- Rental income
- $14,230
- − Mortgage interest
- −$4,761
- − Property taxes
- −$502
- − Insurance
- −$425
- − Repairs & maintenance
- −$1,138
- − Management
- −$1,138
- − Depreciation
- −$2,473
- Taxable income
- $3,791
- Est. tax owed @ 24.0%
- −$910
- After-tax cash flow
- $4,055/yr
For passive investors: Depreciation is non-cash, so a rental often shows a tax loss while cash-flowing — sheltering income. Rental losses are passive: they offset passive income freely, and up to $25,000/yr can offset ordinary (W-2) income if you actively participate and your MAGI is under $100k (phasing out to $0 by $150k); unused losses carry forward. On sale, claimed depreciation is recaptured at up to 25%, and gains may owe capital-gains tax (a 1031 exchange can defer both). Figures are a year-1 estimate at your 24.0% rate — not tax advice; consult a CPA.
Schools (NCES district)
- District
- Montgomery County
- NCES district ID
- 0102430
- Math proficiency
- 9% ▼ -21.00%
- Reading proficiency
- 31% ▼ -1.00%
- Median HH income
- $43,902
- Composite
- 17.24/100
- National rank
- #9093
- State rank
- #106 of 129 in AL
Livability — Montgomery
- Score
- 65/100
- State rank
- #138
- US rank
- #13416
Category grades
Schools grade is shown separately in the Schools card above.
Census & demographics
- Census place
- Montgomery, AL
- County
- Montgomery County · 190,016 people
- City population
- 175,913
- Metro
- Montgomery, AL
- Population (ZIP)
- 45,250
- Household income
- $55,160
- Rent vs Own
- Severe rent burden
- 2786.0
Population outlook (Montgomery County) Hauer SSP2
- Today (2025)
- 224,008 people
- By 2030
- 221,460 · -1.1%
- By 2040
- 214,179 · -4.4%
- By 2050
- 204,912 · -8.5%
- By 2075
- 177,821 · -20.6%
- By 2100
- 145,134 · -35.2%
Race, ethnicity, and origin ACS 2023
- Neighborhood character
- Predominantly Black (80%)
- Race & ethnicity
- Black 80% White 12% Two or more races 4% Asian 3% Hispanic / Latino 2%
- Common ancestry
- Italian 1%
- Foreign-born
- 5% · Canada, South Korea
- Languages at home
- 94% English-only · Spanish 2% Other Indo-European 1% Korean 1%
Political lean MEDSL · Montgomery
- 2024 margin
- Solid D (+30.7) · D 64.8% · R 34.1% · Other 1.1%
- 2008→2024 swing
- +11.5pp toward D · 2008: 19.2pp · 2024: 30.7pp
- All cycles
- 2024: D+30.7 2020: D+31.5 2016: D+26.2 2012: D+24.3 2008: D+19.2
Not yet ingested
- Civics
- —
Market trends
- HPI YoY
- ▼ -16.31%
- Current HPI
- 151.8598
- Rent YoY
- ▲ 5.65%
- Metro
- Montgomery, AL
- State GDP YoY
- ▲ 2.94%
- F500 in state
- 4
Industry mix (Fortune 500 HQ in AL)
| Industry | F500 HQs | Revenue |
|---|---|---|
| Financial Services | 1 | $8B |
|
||
| Healthcare | 1 | $5B |
|
||
Price history
+100.0% since first listed9 events — show timeline
- 2026-04-20 Listed $85,000 MAAR
- 2026-02-01 Rental Removed $1,200 TURBOTENANT
- 2026-01-01 Listed for Rent $1,200 TURBOTENANT
- 2025-09-21 Listed $95,000 MAAR
- 2004-04-19 Sold (MLS) $29,000 MAAR
- 2004-02-25 Listed $29,900 MAAR
- 2004-01-05 Listed $29,900 MAAR
- 2003-09-17 Listed $34,900 MAAR
- 2002-12-21 Listed $42,500 MAAR
Property tax history
+6.0%/yrLatest (2025): $502 · +0.0% YoY. Source: county tax records.
Cash-flow waterfall
monthlySold comps — $/sqft
last 12 mo · ≤1 miLoading sold comps…