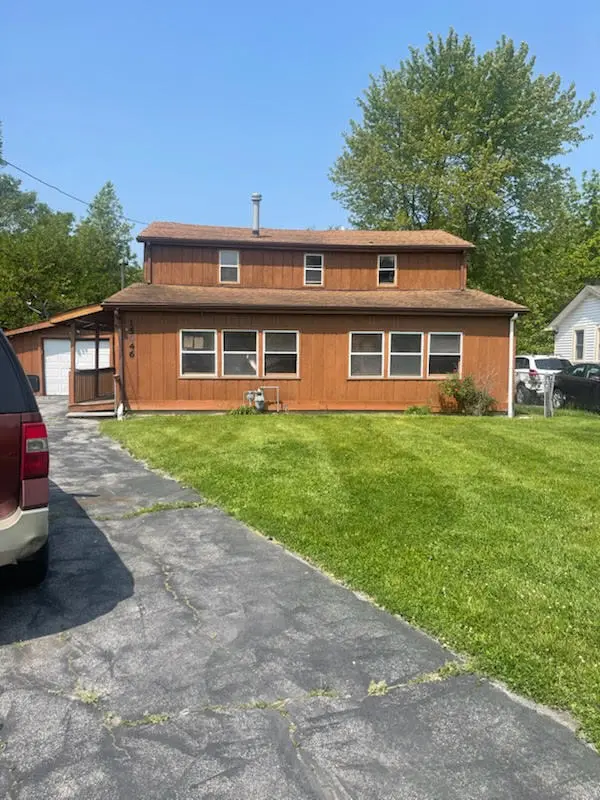
15046 Perry Ave · South Holland, IL
Flood risk 1/10 · Minimal
- FEMA flood zone
- X (unshaded)
- Chance of flooding over 30 yrs
- 0.0%
- Est. flood insurance / yr
- $473 – $860
Fire risk 1/10 · Minimal
- Est. fire insurance / yr
- $804 – $1,492
Heat risk 3/10 · Minor
- Hot days now (above 101°F)
- 7 days/yr
- Hot days in 30 yrs
- 15 days/yr
Wind risk 2/10 · Minimal
- Chance of severe wind over 30 yrs
- —
Air-quality risk 4/10 · Minor
- Unhealthy air days now
- 4 days/yr
- Unhealthy air days in 30 yrs
- 5 days/yr
Risk factors via First Street. Map © Google.
Why this score? — see what drove the B- grade
The composite is a weighted blend of 9 inputs, each scored 0–100. Each bar is that input's sub-score; the figure is the points it added to the 100-point composite (weight × sub-score).
- Cash flow +30.0/30.0
- 1% rule +10.0/10.0
- DSCR +10.0/10.0
- ARV discount +7.5/15.0
- Livability +3.9/5.0
- Rent growth +2.5/5.0
- Condition / age +2.5/5.0
- Schools +0.7/10.0
- Appreciation +0.0/10.0
$79,900
🖨 Deal sheet (PDF) 📄 Offer letter ✓ Due diligence
Listing remarks
Calling all investors, rehabbers & contractors! Check out this 3 bed 2 bath home in South Holland. Can easily convert to a 4 bed 2 bath plus a loft on the 2nd floor level. Property being sold AS-IS , WHERE IS and no survey. Call & schedule your showing today!
Key facts
- Garage
- Listed 15 days
Property features AI
Finance
- Other: Parcel includes additional parcels: 29093160260000, 29093150110000; Tax exemptions: Homeowner, Senior
- HOA & community: No master association fee required
Exterior
- Parking: Attached garage (1 garage space); 2 total parking spaces
- Utilities: Public water; Public sewer
- Home design: Detached single-family home; 1.5 story; Fee simple ownership; Built before 1978
- Construction: Frame construction; Estimated living area; Property age approximately 81–90 years
- Exterior features: Lot less than 0.25 acre; Lot dimensions: 2488
Interior
- Kitchen: Kitchen on main level
- Bedrooms: 3 bedrooms (master plus two additional bedrooms on the second floor)
- Bathrooms: 2 full bathrooms
- Heating & cooling: Natural gas heating; Central air conditioning
- Interior features: 5 total rooms; Dining room; Family room; Living room
- Laundry & utility: Laundry room
Neighborhood map
What this means for you Summary
Snapshot
- This is a 4-bed/2.5-bath single-family listed at $80k.
Deal economics
- At list price, monthly cash flow is $2k ($23k/yr) — positive.
- The deal already cash-flows at list — no discount required.
- Meets the 1% rule at list price ($3k rent vs $80k).
- Recommended offer: $79k (1.5% below list) — sets the bar for market timing.
- Cap rate 34.6% vs local median 8.4% in South Holland — top-decile yield for the area; either an underpriced asset or a hidden risk that comps aren't pricing in. Stress-test before assuming the spread holds.
Location & tenants
- Location reads 77/100 on livability (#167 in IL, #3,071 nationally) — a middle-class / working-renter tenant base. Strengths: commute A+, housing A+, cost of living A; Watch: crime C-, amenities C-, schools D+.
- Thornton Twp Hsd 205 (suburban): math 7% / reading 8% proficiency, ranked #594 of 620 in IL (top 96%) — low school quality limits family demand, transient renter base, plan for 1-2y turnover.
- Market conditions: 136 active listings in the ZIP; 6,272 units permitted in Cook County in 2024 (4,658 in 5+ unit buildings).
Forward outlook
- Local home prices are declining (-3.0%/yr); year-one equity from $552 of loan paydown is wiped out by about $2k of value loss. Plan a longer hold.
- At projected returns (-3.0% appreciation + 3.0% rent growth), your $22k cash investment doubles in ~2 years — after that, you're playing with house money.
Negotiation context
- It's been on market 16 days — a 2% lower offer ($79k) is reasonable based on typical stale-listing flexibility.
- 6 sale attempts since 16y ago with the ask held roughly flat each time — persistent listings suggest the price (not the market) is what's stuck; bring a comps-based counter.
Risks & watch-outs
- Watch-outs: built in 1927 — expect roof / HVAC / electrical / plumbing capex.
Questions for the listing agent
- Built in 1927 — when were the roof, HVAC, electrical panel, plumbing, and water heater last replaced?
- Is there a deadline driving the sale (1031 exchange, divorce, estate, relocation)? That informs how much negotiation room exists.
- Schools are D-rated, which usually means shorter tenancies and higher turnover. Who's the typical renter profile here, and what's been the actual vacancy rate?
- What's the average days-on-market for RENTAL listings here right now (not sales)? A rising rental-DOM trend means longer vacancies and softer asking-rent achievability than the comps imply.
- What's the recent tenant-quality profile in this submarket — average credit score on applications, eviction rate, late-payment / NSF rate, and stable-employment percentage? A property-management company in the area should have these aggregated.
- How much new for-sale + rental construction is in the pipeline within 1–3 miles? Heavy new supply typically softens prices + rents 12–24 months out; constrained supply supports both.
Investment metrics
- 1% rule
- 3.87% ✓
- Cap rate
- 34.64%
- Cash-on-cash
- 101.25%
- DSCR
- 5.51
- GRM
- 2.2
CMA / ARV
- ARV (on-the-fly)
- $291,096
- Comps found
- 5
Show comp detail 5 sales within ~0.75 mi
| Address | Dist | Beds/Ba | Sqft | Sold | Price | $/sf | Match |
|---|---|---|---|---|---|---|---|
| 15351 S 3rd Ave | 0.46mi | 3/2.5 (-1) | 2,400 (-4%) | 2mo | $277,000 | $115 | 66 |
| 15239 Vincennes Rd | 0.38mi | 5/2.0 (+1) | 2,286 (-8%) | 4mo | $205,580 | $90 | 58 |
| 15622 State St | 0.71mi | 4/3.0 | 2,600 (+4%) | 0mo | $305,000 | $117 | 57 |
| 633 E 153rd St | 0.37mi | 5/3.0 (+1) | 2,200 (-12%) | 3mo | $265,000 | $120 | 54 |
| 15257 State St | 0.69mi | 5/2.0 (+1) | 2,419 (-3%) | 13mo | $334,900 | $138 | 45 |
Match score weights: distance 35% · size 25% · config 20% · recency 20%. Top-matched comps best support the ARV.
Projected returns pro-forma
-3.0% appreciation · 3.0% rent growth · sell at horizon
- IRR
- —
- Equity multiple
- 5.80×
- Total profit
- $107,326
- Equity at exit
- $11,913
- IRR
- —
- Equity multiple
- 12.11×
- Total profit
- $248,458
- Equity at exit
- $6,908
Cash invested: $22,372 (down + closing). Projections, not guarantees.
Landlord ↔ Tenant lean methodology
- Overall (STATE)
- 43 Moderately Tenant-Leaning
- State Illinois
- 43 Moderately Tenant-Leaning · D+7
- County
- — inherits STATE
- City
- — inherits STATE
ZIP-level market 60473
- Active inventory
- 136
- Price-to-rent
- 2.2×
Monthly cashflow live
- Estimated rent
- $3,088 medium interval (Pro) →
- Mortgage (P&I)
- −$419
- Tax est. 1.5%
- −$100 /mo · $1,198/yr
- Insurance
- −$33
- HOA
- −$0
- Vacancy / Maint / Mgmt
- −$649
- Net cashflow
- $1,888
Break-even live
Sensitivity live
| Price | -10% $1,943 | -5% $1,915 | +0% $1,888 | +5% $1,860 | +10% $1,832 |
|---|---|---|---|---|---|
| Rent | -10% $1,644 | -5% $1,766 | +0% $1,888 | +5% $2,010 | +10% $2,132 |
| Rate | -1.0pp $1,928 | -0.5pp $1,908 | base $1,888 | +0.5pp $1,867 | +1.0pp $1,846 |
UW: 25.0% down · 7.5% · 30yr · 1.5% tax · 5.0% vac · 8.0% maint · 8.0% mgmt
Financing live
Cash to close
- Down payment
- $19,975
- Closing costs
- $2,397
- Reserves months
- —
- Total cash needed
- —
Loan-product check · same deal, 3 products live
Conventional
25% down · 7.5% · 30yr
- Down + closing
- —
- Monthly P&I
- —
- Monthly cashflow
- —
- DSCR
- —
- Eligible?
- —
Personal DTI + credit; lowest rate.
DSCR
20% down · 8.5% · 30yr
- Down + closing
- —
- Monthly P&I
- —
- Monthly cashflow
- —
- DSCR
- —
- Eligible?
- —
No personal income docs; deal must DSCR.
Hard money
10% down · 12.0% · 12mo
- Down + closing
- —
- Monthly P&I
- —
- Monthly cashflow
- —
- DSCR
- —
- Eligible?
- —
Short-term bridge; refi at stabilization.
Listing history 11 events
-
2026-06-21days on market $79,900 Active 16 DOM
-
2026-06-18days on market $79,900 Active 13 DOM
-
2026-06-17days on market $79,900 Active 12 DOM
-
2026-06-16days on market $79,900 Active 11 DOM
-
2026-06-15days on market $79,900 Active 10 DOM
-
2026-06-13days on market $79,900 Active 8 DOM
-
2026-06-13days on market $79,900 Active 7 DOM
-
2026-06-09days on market $79,900 Active 4 DOM
-
2026-06-08days on market $79,900 Active 3 DOM
-
2026-06-07remarks 265-char remark
-
2026-06-07$79,900 Active 2 DOM
ⓘ Source: listings_history table (triggers on properties + properties_extension) + one-shot
backfill from property_details.listing_events for pre-trigger history.
Climate risk First Street
- Flood 1/10 Low FEMA zone X (unshaded) · 0% chance over 30 yrs
- Wildfire 1/10 Low
- Heat 3/10 Moderate 7 d/yr ≥101°F today · 15 d/yr by 30 yrs out
- Wind 2/10 Low
- Air quality 4/10 Moderate 4 unhealthy d/yr today · 5 by 30 yrs out
Nearby sold comps map
Loading sold comps map…
Walkable amenities ~0.75 mi
Loading nearby amenities…
Taxation est. · year 1
- Rental income
- $37,061
- − Mortgage interest
- −$4,476
- − Property taxes
- −$1,198
- − Insurance
- −$400
- − Repairs & maintenance
- −$2,965
- − Management
- −$2,965
- − Depreciation
- −$2,324
- Taxable income
- $22,733
- Est. tax owed @ 24.0%
- −$5,456
- After-tax cash flow
- $17,196/yr
For passive investors: Depreciation is non-cash, so a rental often shows a tax loss while cash-flowing — sheltering income. Rental losses are passive: they offset passive income freely, and up to $25,000/yr can offset ordinary (W-2) income if you actively participate and your MAGI is under $100k (phasing out to $0 by $150k); unused losses carry forward. On sale, claimed depreciation is recaptured at up to 25%, and gains may owe capital-gains tax (a 1031 exchange can defer both). Figures are a year-1 estimate at your 24.0% rate — not tax advice; consult a CPA.
Schools (NCES district)
- District
- Thornton Twp Hsd 205
- NCES district ID
- 1738970
- Math proficiency
- 7% ▬ 0.00%
- Reading proficiency
- 8% ▼ -2.00%
- Median HH income
- $43,392
- Composite
- 6.92/100
- National rank
- #9976
- State rank
- #594 of 620 in IL
Livability — South Holland
- Score
- 77/100
- State rank
- #167
- US rank
- #3071
Category grades
Schools grade is shown separately in the Schools card above.
Census & demographics
- Census place
- South Holland, IL
- City population
- 21,407
- Population (ZIP)
- 21,407
Population outlook (Cook County) Hauer SSP2
- Today (2025)
- 5,347,519 people
- By 2030
- 5,357,703 · +0.2%
- By 2040
- 5,324,924 · -0.4%
- By 2050
- 5,230,762 · -2.2%
- By 2075
- 4,785,735 · -10.5%
- By 2100
- 4,188,836 · -21.7%
Race, ethnicity, and origin ACS 2023
- Neighborhood character
- Predominantly Black (75%)
- Race & ethnicity
- Black 75% White 10% Hispanic / Latino 10% Two or more races 3% Asian 1%
- Hispanic origin (detail)
- Mexican 9% Puerto Rican 1%
- Common ancestry
- Iranian 3% Romanian 2%
- Foreign-born
- 6% · Canada, China
- Languages at home
- 87% English-only · Spanish 8% Other Asian/Pacific 1% Russian/Polish/Slavic 1%
Political lean MEDSL · Cook
- 2024 margin
- Solid D (+42.0) · D 70.4% · R 28.4% · Other 1.2%
- 2008→2024 swing
- -11.4pp toward R · 2008: 53.4pp · 2024: 42.0pp
- All cycles
- 2024: D+42.0 2020: D+50.3 2016: D+53.0 2012: D+49.4 2008: D+53.4
Not yet ingested
- Civics
- —
Market trends
- HPI YoY
- ▼ -114.36%
- Current HPI
- 201.2479
- Rent YoY
- —
- Metro
- —
- State GDP YoY
- ▲ 1.59%
- F500 in state
- 60
Industry mix (Fortune 500 HQ in IL)
| Industry | F500 HQs | Revenue |
|---|---|---|
| Insurance | 4 | $201B |
|
||
| Consumer Goods | 4 | $87B |
|
||
| Industrial Machinery | 3 | $64B |
|
||
| Healthcare | 2 | $55B |
|
||
| Retail / Pharmacy | 1 | $148B |
|
||
| Agriculture / Food | 1 | $86B |
|
||
Price history
+88.0% since first listed21 events — show timeline
- 2026-06-05 Listed $79,900 MRED as Distributed by MLS Grid
- 2026-04-24 Listing Removed — MRED as Distributed by MLS Grid
- 2026-04-13 Price Changed — MRED as Distributed by MLS Grid
- 2026-03-13 Listed — MRED as Distributed by MLS Grid
- 2026-01-21 Listing Removed — MRED as Distributed by MLS Grid
- 2025-12-08 Price Changed — MRED as Distributed by MLS Grid
- 2025-11-04 Price Changed — MRED as Distributed by MLS Grid
- 2025-10-20 Relisted — MRED as Distributed by MLS Grid
- 2025-10-20 Price Changed — MRED as Distributed by MLS Grid
- 2025-07-21 Pending — MRED as Distributed by MLS Grid
- 2025-07-11 Listed — MRED as Distributed by MLS Grid
- 2024-02-07 Sold (Public Records) $91,000 Public Records
- 2010-05-28 Sold (MLS) $55,900 MRED as Distributed by MLS Grid
- 2010-05-18 Pending — MRED as Distributed by MLS Grid
- 2010-04-13 Relisted — MRED as Distributed by MLS Grid
- 2010-01-29 Pending — MRED as Distributed by MLS Grid
- 2010-01-14 Listed $55,900 MRED as Distributed by MLS Grid
- 2007-07-19 Sold (Public Records) $180,000 Public Records
- 1992-12-16 Sold (Public Records) $73,000 Public Records
- 1989-12-20 Sold (Public Records) $70,000 Public Records
- 1983-10-01 Sold (Public Records) $42,500 Public Records
Property tax history
+7.5%/yrLatest (2023): $4,067 · +111.9% YoY. Source: county tax records.
Cash-flow waterfall
monthlySold comps — $/sqft
last 12 mo · ≤1 miLoading sold comps…