1201 E Buckeye St · Columbus, KS
Flood risk 1/10 · Minimal
- FEMA flood zone
- X (unshaded)
- Chance of flooding over 30 yrs
- 0.0%
- Est. flood insurance / yr
- $507 – $1,088
Fire risk 5/10 · Moderate
- Est. fire insurance / yr
- $1,154 – $2,142
Heat risk 5/10 · Moderate
- Hot days now (above 108°F)
- 7 days/yr
- Hot days in 30 yrs
- 20 days/yr
Wind risk 2/10 · Minimal
- Chance of severe wind over 30 yrs
- 2.0%
Air-quality risk 2/10 · Minimal
- Unhealthy air days now
- 1 days/yr
- Unhealthy air days in 30 yrs
- 1 days/yr
Risk factors via First Street. Map © Google.
Why this score? — see what drove the C+ grade
The composite is a weighted blend of 9 inputs, each scored 0–100. Each bar is that input's sub-score; the figure is the points it added to the 100-point composite (weight × sub-score).
- Cash flow +27.1/30.0
- DSCR +9.4/10.0
- ARV discount +7.5/15.0
- 1% rule +7.3/10.0
- Livability +3.7/5.0
- Rent growth +2.5/5.0
- Condition / age +2.5/5.0
- Schools +2.4/10.0
- Appreciation +0.0/10.0
$65,000
🖨 Deal sheet (PDF) 📄 Offer letter ✓ Due diligence
Listing remarks MLS
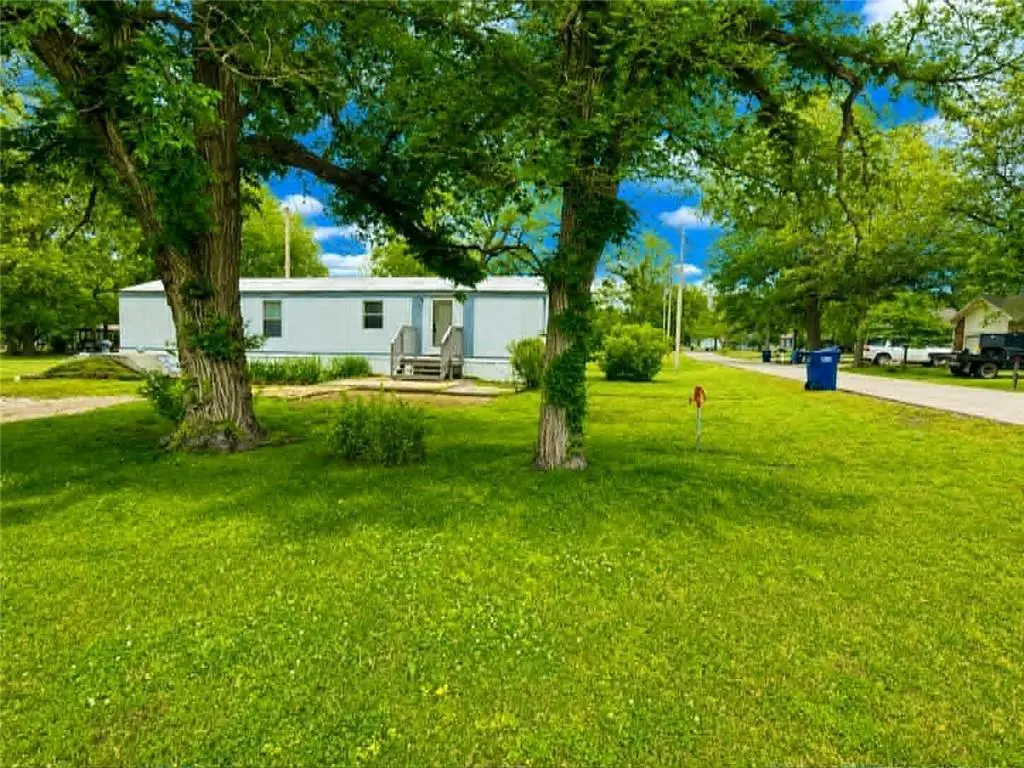
Well-maintained 1992 single-wide home situated on a beautiful park-like corner acre with multiple mature trees offering shade galore. This property features a storm shelter, septic system, city water, and a fenced yard perfect for outdoor enjoyment. Also INCLUDED are two additional lots that could be sold separately, providing investment or expansion potential. The lot at 0 N Ave is not within the city limits, and the lot at 513 N Ave previously had an electric meter installed. Plenty of space, and the possibilities are endless.
Key facts
- Fenced yard
- Additional lots
- City water
Tags
Property features AI
Finance
- Other: Living area reported as 868 (public records); Age estimated at 31–40 years
- HOA & community: Association fee listed as $1 (no regular frequency indicated); No maintenance provided
Exterior
- Parking: Off-street parking
- Utilities: Public water; Septic tank sewer
- Home design: Manufactured single-family residence
- Construction: Vinyl siding; Other type roof
- Exterior features: Property not in a flood plain; Approximately 1-acre lot
Interior
- Bedrooms: 2 bedrooms
- Bathrooms: 1 full bathroom
- Heating & cooling: Electric heating; Electric cooling (has cooling)
- Interior features: Ranch floor plan; Crawl space basement
Neighborhood map
What this means for you Summary
Snapshot
- This is a 2-bed/1.0-bath manufactured listed at $65k.
Deal economics
- At list price, monthly cash flow is $183 ($2k/yr) — positive.
- The deal already cash-flows at list — no discount required.
- Meets the 1% rule at list price ($801 rent vs $65k).
- Cap rate 9.7% vs local median 5.4% in Columbus — top-decile yield for the area; either an underpriced asset or a hidden risk that comps aren't pricing in. Stress-test before assuming the spread holds.
Location & tenants
- Location reads 73/100 on livability (#96 in KS) — a middle-class / working-renter tenant base. Strengths: cost of living A+, health & safety A+, housing B; Watch: schools D-, amenities F, commute F.
- Columbus (town): math 22% / reading 35% proficiency, ranked #120 of 169 in KS (top 71%) — low school quality limits family demand, transient renter base, plan for 1-2y turnover.
- Market conditions: 40 active listings in the ZIP; 4 comparable units currently listed for rent nearby; rentals at typical pace (median 22d on market — plan ~3-4 weeks tenant-placement turnaround); 17 units permitted in Cherokee County in 2024 (0 in 5+ unit buildings).
Forward outlook
- Local home prices are declining (-3.0%/yr); year-one equity from $449 of loan paydown is wiped out by about $2k of value loss. Plan a longer hold.
- Cherokee County population projected at -26% by 2050 — secular population decline; favor cash flow + early exit over multi-decade hold.
- At projected returns (-3.0% appreciation + 3.0% rent growth), your $18k cash investment doubles in ~10 years — after that, you're playing with house money.
Negotiation context
- Only 10 days on market — expect competitive offers; lowballing is unlikely to land.
- 2 sale attempts with the ask held roughly flat each time — persistent listings suggest the price (not the market) is what's stuck; bring a comps-based counter.
Risks & watch-outs
- Climate carrying-cost: moderate wildfire risk; extreme-heat days projected 7→20/yr by 2055 (HVAC capex compounding) — expect insurance premiums to compound above CPI over the hold.
Questions for the listing agent
- Is there a deadline driving the sale (1031 exchange, divorce, estate, relocation)? That informs how much negotiation room exists.
- Schools are D-rated, which usually means shorter tenancies and higher turnover. Who's the typical renter profile here, and what's been the actual vacancy rate?
- What's the average days-on-market for RENTAL listings here right now (not sales)? A rising rental-DOM trend means longer vacancies and softer asking-rent achievability than the comps imply.
- What's the recent tenant-quality profile in this submarket — average credit score on applications, eviction rate, late-payment / NSF rate, and stable-employment percentage? A property-management company in the area should have these aggregated.
- How much new for-sale + rental construction is in the pipeline within 1–3 miles? Heavy new supply typically softens prices + rents 12–24 months out; constrained supply supports both.
Investment metrics
- 1% rule
- 1.23% ✓
- Cap rate
- 9.68%
- Cash-on-cash
- 12.09%
- DSCR
- 1.54
- GRM
- 6.8
CMA / ARV
No comps found within radius.
Projected returns pro-forma
-3.0% appreciation · 3.0% rent growth · sell at horizon
- IRR
- 1.7%
- Equity multiple
- 1.06×
- Total profit
- $1,157
- Equity at exit
- $9,692
- IRR
- 11.3%
- Equity multiple
- 1.88×
- Total profit
- $16,093
- Equity at exit
- $5,620
Cash invested: $18,200 (down + closing). Projections, not guarantees.
Landlord ↔ Tenant lean methodology
- Overall (STATE)
- 83 Strongly Landlord-Friendly
- State Kansas
- 83 Strongly Landlord-Friendly · R+10
- County
- — inherits STATE
- City
- — inherits STATE
ZIP-level market 66725
- Home prices YoY
- -11.7%
- Active inventory
- 40
- Price-to-rent
- 6.8×
Monthly cashflow live
- Estimated rent
- $801 medium interval (Pro) →
- Mortgage (P&I)
- −$341
- Tax est. 1.5%
- −$81 /mo · $975/yr
- Insurance
- −$27
- HOA
- −$0
- Vacancy / Maint / Mgmt
- −$168
- Net cashflow
- $183
Break-even live
Sensitivity live
| Price | -10% $228 | -5% $206 | +0% $183 | +5% $161 | +10% $138 |
|---|---|---|---|---|---|
| Rent | -10% $120 | -5% $152 | +0% $183 | +5% $215 | +10% $247 |
| Rate | -1.0pp $216 | -0.5pp $200 | base $183 | +0.5pp $167 | +1.0pp $149 |
UW: 25.0% down · 7.5% · 30yr · 1.5% tax · 5.0% vac · 8.0% maint · 8.0% mgmt
Financing live
Cash to close
- Down payment
- $16,250
- Closing costs
- $1,950
- Reserves months
- —
- Total cash needed
- —
Loan-product check · same deal, 3 products live
Conventional
25% down · 7.5% · 30yr
- Down + closing
- —
- Monthly P&I
- —
- Monthly cashflow
- —
- DSCR
- —
- Eligible?
- —
Personal DTI + credit; lowest rate.
DSCR
20% down · 8.5% · 30yr
- Down + closing
- —
- Monthly P&I
- —
- Monthly cashflow
- —
- DSCR
- —
- Eligible?
- —
No personal income docs; deal must DSCR.
Hard money
10% down · 12.0% · 12mo
- Down + closing
- —
- Monthly P&I
- —
- Monthly cashflow
- —
- DSCR
- —
- Eligible?
- —
Short-term bridge; refi at stabilization.
Rent comps 4 comps
| Address | Beds | Baths | Sqft | Rent | $/sqft | DOM | Units | Dist |
|---|---|---|---|---|---|---|---|---|
| 401 Northeast Ave Columbus, KS | 1.0 | 1.0 | 900 | $900 | $1.00 | 22d | 1 | 0.26mi |
| 109 S Illinois Ave Columbus, KS | 1.0 | 1.0 | 690 | $750 | $1.09 | 22d | 1 | 0.47mi |
| 305 W Maple St Columbus, KS | 1.0 | 1.0 | 550 | $650 | $1.18 | 22d | 1 | 1.00mi |
| 305 W Maple St Apt 1 Columbus, KS | 1.0 | 1.0 | 550 | $500 | $0.91 | 22d | 1 | 1.00mi |
Listing history 3 events
-
2026-05-15$65,000 Active 534-char remark
Show marketing remark (534 chars)
Well-maintained 1992 single-wide home situated on a beautiful park-like corner acre with multiple mature trees offering shade galore. This property features a storm shelter, septic system, city water, and a fenced yard perfect for outdoor enjoyment. Also INCLUDED are two additional lots that could be sold separately, providing investment or expansion potential. The lot at 0 N Ave is not within the city limits, and the lot at 513 N Ave previously had an electric meter installed. Plenty of space, and the possibilities are endless.
-
1992-05-01soldstatus
ⓘ Source: listings_history table (triggers on properties + properties_extension) + one-shot
backfill from property_details.listing_events for pre-trigger history.
Climate risk First Street
- Flood 1/10 Low FEMA zone X (unshaded) · 0% chance over 30 yrs
- Wildfire 5/10 Major
- Heat 5/10 Major 7 d/yr ≥108°F today · 20 d/yr by 30 yrs out
- Wind 2/10 Low 2% chance of damaging wind over 30 yrs
- Air quality 2/10 Low 1 unhealthy d/yr today · 1 by 30 yrs out
Nearby sold comps map
Loading sold comps map…
Walkable amenities ~0.75 mi
Loading nearby amenities…
Taxation est. · year 1
- Rental income
- $9,608
- − Mortgage interest
- −$3,641
- − Property taxes
- −$975
- − Insurance
- −$325
- − Repairs & maintenance
- −$769
- − Management
- −$769
- − Depreciation
- −$1,891
- Taxable income
- $1,239
- Est. tax owed @ 24.0%
- −$297
- After-tax cash flow
- $1,903/yr
For passive investors: Depreciation is non-cash, so a rental often shows a tax loss while cash-flowing — sheltering income. Rental losses are passive: they offset passive income freely, and up to $25,000/yr can offset ordinary (W-2) income if you actively participate and your MAGI is under $100k (phasing out to $0 by $150k); unused losses carry forward. On sale, claimed depreciation is recaptured at up to 25%, and gains may owe capital-gains tax (a 1031 exchange can defer both). Figures are a year-1 estimate at your 24.0% rate — not tax advice; consult a CPA.
Schools (NCES district)
- District
- Columbus
- NCES district ID
- 2005070
- Math proficiency
- 22% ▼ -1.00%
- Reading proficiency
- 35% ▼ -3.00%
- Median HH income
- $41,308
- Composite
- 24.08/100
- National rank
- #7756
- State rank
- #120 of 169 in KS
Livability — Columbus
- Score
- 73/100
- State rank
- #96
- US rank
- #5460
Category grades
Schools grade is shown separately in the Schools card above.
Census & demographics
- Census place
- Columbus, KS
- Population (ZIP)
- 5,102
Population outlook (Cherokee County) Hauer SSP2
- Today (2025)
- 18,848 people
- By 2030
- 17,862 · -5.2%
- By 2040
- 15,850 · -15.9%
- By 2050
- 13,915 · -26.2%
- By 2075
- 10,102 · -46.4%
- By 2100
- 6,977 · -63.0%
Race, ethnicity, and origin ACS 2023
- Neighborhood character
- Predominantly White (86%)
- Race & ethnicity
- White 86% Two or more races 8% Black 2% Hispanic / Latino 2% Native American 1%
- Common ancestry
- Italian 4% Lithuanian 2% Serbian 1%
- Foreign-born
- 1% · Canada
- Languages at home
- 97% English-only · Spanish 3%
Political lean MEDSL · Cherokee
- 2024 margin
- Solid R (+52.9) · D 22.6% · R 75.5% · Other 1.9%
- 2008→2024 swing
- -29.2pp toward R · 2008: -23.7pp · 2024: -52.9pp
- All cycles
- 2024: R+52.9 2020: R+49.9 2016: R+48.4 2012: R+29.5 2008: R+23.7
Not yet ingested
- Civics
- —
Market trends
- HPI YoY
- ▼ -28.61%
- Current HPI
- 216.89
- Rent YoY
- —
- Metro
- —
- State GDP YoY
- —
- F500 in state
- 0
Price history
+0.0% since first listed7 events — show timeline
- 2026-06-02 Sold (MLS) — Heartland MLS as Distributed by MLS Grid
- 2026-06-02 Sold (MLS) — OGAR
- 2026-05-27 Pending — OGAR
- 2026-05-25 Pending — Heartland MLS as Distributed by MLS Grid
- 2026-05-15 Listed $65,000 Heartland MLS as Distributed by MLS Grid
- 2026-05-15 Listed $65,000 OGAR
- 1992-05-01 Sold (Public Records) — Public Records
Property tax history
-1.1%/yrLatest (2025): $64 · -62.3% YoY. Source: county tax records.
Cash-flow waterfall
monthlySold comps — $/sqft
last 12 mo · ≤1 miLoading sold comps…