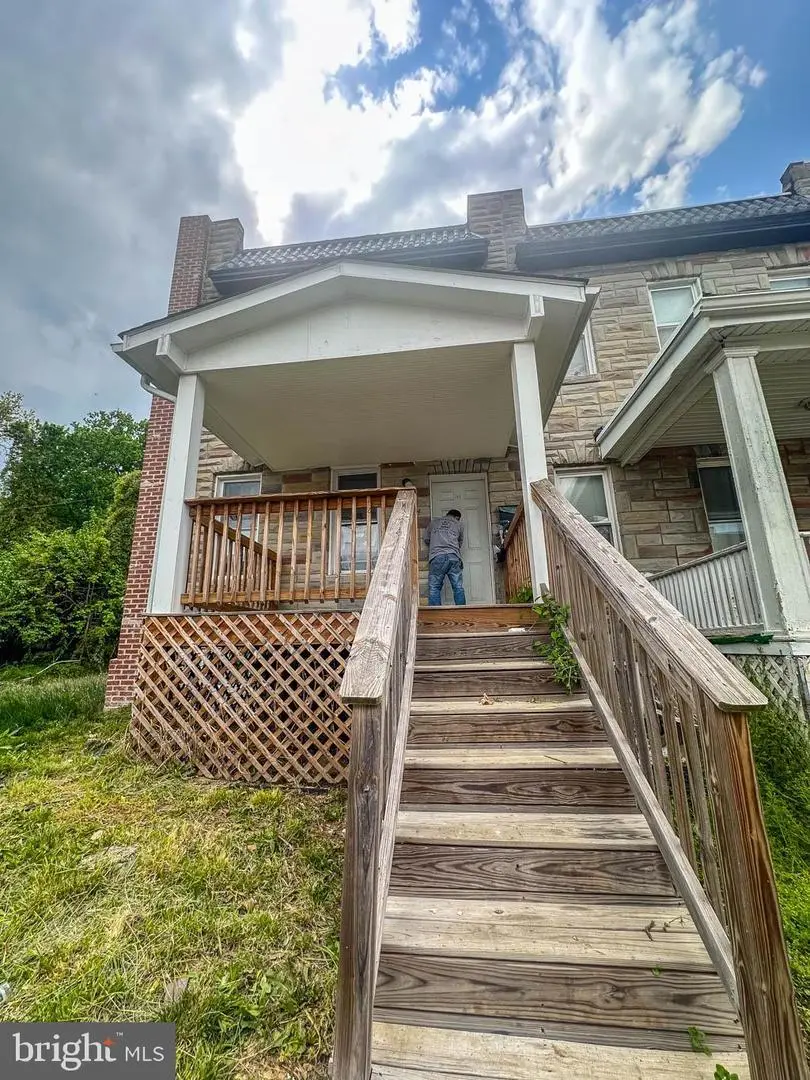
144 Palormo Ave · Baltimore, MD
Flood risk 1/10 · Minimal
- FEMA flood zone
- X (unshaded)
- Chance of flooding over 30 yrs
- 0.0%
- Est. flood insurance / yr
- $473 – $860
Fire risk 1/10 · Minimal
- Est. fire insurance / yr
- $755 – $1,403
Heat risk 7/10 · Major
- Hot days now (above 103°F)
- 7 days/yr
- Hot days in 30 yrs
- 15 days/yr
Wind risk 5/10 · Moderate
- Chance of severe wind over 30 yrs
- 24.0%
Air-quality risk 3/10 · Minor
- Unhealthy air days now
- 3 days/yr
- Unhealthy air days in 30 yrs
- 4 days/yr
Risk factors via First Street. Map © Google.
Why this score? — see what drove the B+ grade
The composite is a weighted blend of 9 inputs, each scored 0–100. Each bar is that input's sub-score; the figure is the points it added to the 100-point composite (weight × sub-score).
- Cash flow +30.0/30.0
- ARV discount +15.0/15.0
- 1% rule +10.0/10.0
- DSCR +10.0/10.0
- Rent growth +3.8/5.0
- Livability +3.8/5.0
- Condition / age +2.5/5.0
- Schools +1.0/10.0
- Appreciation +0.0/10.0
$69,900
🖨 Deal sheet 📄 Offer letter ✓ Due diligence
Listing remarks MLS
BUY NOW POST ACTION. 2 Story Townhome located in the Saint Josephs area. In close proximity to Saint Agnes Hospital. Property is vacant. 998 sqft. 10% Buyer's Premium or $1,000 whichever is greater. Deposit $2,000. For full Terms and Conditions contact auctioneer s office.
Key facts
- Built 1920
- Listed 13 days
Property features AI
Exterior
- Parking: On-street parking
- Utilities: Public water; Public sewer
- Home design: Interior townhouse/rowhouse; Fee simple ownership; Year built (estimated)
- Construction: Brick construction; Stone foundation; Above-grade and below-grade structures
- Exterior features: No tidal water
Interior
- Bedrooms: Three bedrooms on the first upper level
- Bathrooms: One full bathroom (all upper levels); One half bathroom on the main level
- Heating & cooling: Natural gas heating; Electric cooling
- Interior features: Estimated living area; Full basement
Neighborhood map
What this means for you Summary
Snapshot
- This is a 3-bed/1.5-bath townhouse listed at $70k.
Deal economics
- At list price, monthly cash flow is $868 ($10k/yr) — positive.
- The deal already cash-flows at list — no discount required.
- Meets the 1% rule at list price ($2k rent vs $70k).
- Cap rate 21.2% vs local median 6.0% in Baltimore — top-decile yield for the area; either an underpriced asset or a hidden risk that comps aren't pricing in. Stress-test before assuming the spread holds.
Location & tenants
- Location reads 76/100 on livability (#90 in MD, #3,396 nationally) — a middle-class / working-renter tenant base. Strengths: amenities A+, commute A+, housing A+; Watch: schools D, crime F.
- Baltimore City Public Schools (urban): math 7% / reading 16% proficiency, ranked #24 of 24 in MD (top 100%) — low school quality limits family demand, transient renter base, plan for 1-2y turnover; 79% free/reduced lunch — lower-income household profile, screen leases tightly.
- Market conditions: Rents rising fast (+5.4%/yr); 252 active listings in the ZIP; 35 comparable units currently listed for rent nearby; rentals at typical pace (median 24d on market — plan ~3-4 weeks tenant-placement turnaround); 1,273 units permitted in Baltimore city in 2024 (1,104 in 5+ unit buildings).
- This rent runs 33% of the median local income ($60k/yr) — at the standard rent-burdened threshold; future hikes will face affordability resistance.
Forward outlook
- Local home prices are declining (-3.0%/yr); year-one equity from $483 of loan paydown is wiped out by about $2k of value loss. Plan a longer hold.
- Baltimore County population projected to shrink 4% by 2050 — rents likely to lag national; underwrite the cash flow, not the appreciation.
- At projected returns (-3.0% appreciation + 5.4% rent growth), your $20k cash investment doubles in ~3 years — after that, you're playing with house money.
Negotiation context
- Only 13 days on market — expect competitive offers; lowballing is unlikely to land.
- 6 sale attempts since 7y ago with the ask held roughly flat each time — persistent listings suggest the price (not the market) is what's stuck; bring a comps-based counter.
Risks & watch-outs
- Watch-outs: built in 1920 — expect roof / HVAC / electrical / plumbing capex.
- Climate carrying-cost: moderate wind risk, 24% chance of damaging wind over 30y; extreme-heat days projected 7→15/yr by 2055 (HVAC capex compounding) — expect insurance premiums to compound above CPI over the hold.
Questions for the listing agent
- Built in 1920 — when were the roof, HVAC, electrical panel, plumbing, and water heater last replaced?
- Is there a deadline driving the sale (1031 exchange, divorce, estate, relocation)? That informs how much negotiation room exists.
- Schools are D-rated, which usually means shorter tenancies and higher turnover. Who's the typical renter profile here, and what's been the actual vacancy rate?
- Crime grade is F in this area — have there been break-ins, vandalism, or insurance claims at this property in the last 3 years? What carrier currently insures it and at what premium?
- What's the average days-on-market for RENTAL listings here right now (not sales)? A rising rental-DOM trend means longer vacancies and softer asking-rent achievability than the comps imply.
- What's the recent tenant-quality profile in this submarket — average credit score on applications, eviction rate, late-payment / NSF rate, and stable-employment percentage? A property-management company in the area should have these aggregated.
- How much new for-sale + rental construction is in the pipeline within 1–3 miles? Heavy new supply typically softens prices + rents 12–24 months out; constrained supply supports both.
Investment metrics
- 1% rule
- 2.35% ✓
- Cap rate
- 21.19%
- Cash-on-cash
- 53.21%
- DSCR
- 3.37
- GRM
- 3.6
CMA / ARV
- ARV (on-the-fly)
- $136,452
- Comps found
- 12
Show comp detail 12 sales within ~0.75 mi
| Address | Dist | Beds/Ba | Sqft | Sold | Price | $/sf | Match |
|---|---|---|---|---|---|---|---|
| 23 N Morley St | 0.28mi | 3/1.0 | 1,041 (+4%) | 6mo | $85,000 | $82 | 72 |
| 119 Hilton St | 0.31mi | 2/2.0 (-1) | 1,040 (+4%) | 0mo | $211,000 | $203 | 71 |
| 107 N Monastery Ave | 0.33mi | 2/1.5 (-1) | 1,080 (+8%) | 2mo | $65,000 | $60 | 64 |
| 3386 Dulany St | 0.61mi | 3/2.0 | 1,014 (+2%) | 6mo | $169,000 | $167 | 62 |
| 1 N Culver St | 0.20mi | 3/2.0 | 1,140 (+14%) | 4mo | $225,000 | $197 | 61 |
| 133 N Monastery Ave | 0.35mi | 2/2.0 (-1) | 1,080 (+8%) | 3mo | $142,000 | $131 | 60 |
| 3306 W Franklin St | 0.66mi | 3/2.0 | 960 (-4%) | 1mo | $51,500 | $54 | 60 |
| 3302 W Franklin St | 0.67mi | 3/1.0 | 960 (-4%) | 2mo | $50,000 | $52 | 60 |
| 209 Mount Holly St | 0.51mi | 3/2.0 | 1,080 (+8%) | 2mo | $228,000 | $211 | 59 |
| 222 N Hilton St | 0.42mi | 3/1.0 | 1,120 (+12%) | 1mo | $89,775 | $80 | 57 |
| 3396 Dulany St | 0.61mi | 2/1.5 (-1) | 1,080 (+8%) | 0mo | $177,523 | $164 | 52 |
| 427 Gwynn Ave | 0.63mi | 3/1.5 | 1,116 (+12%) | 5mo | $152,650 | $137 | 46 |
Match score weights: distance 35% · size 25% · config 20% · recency 20%. Top-matched comps best support the ARV.
Projected returns pro-forma
-3.0% appreciation · 5.38% rent growth · sell at horizon
- IRR
- 53.8%
- Equity multiple
- 3.45×
- Total profit
- $47,955
- Equity at exit
- $10,422
- IRR
- 59.9%
- Equity multiple
- 7.65×
- Total profit
- $130,206
- Equity at exit
- $6,044
Cash invested: $19,572 (down + closing). Projections, not guarantees.
Landlord ↔ Tenant lean methodology
- Overall (CITY)
- 12 Strongly Tenant-Friendly
- State Maryland
- 27 Tenant-Leaning · D+14
- County
- — inherits STATE
- City Baltimore
- 12 Strongly Tenant-Friendly · D+58
ZIP-level market 21229
- Rents YoY
- 5.4%
- Active inventory
- 252
- Price-to-rent
- 3.6×
Monthly cashflow live
- Estimated rent
- $1,639 high interval (Pro) →
- Mortgage (P&I)
- −$367
- Tax from tax record
- −$32 /mo · $378/yr
- Insurance
- −$29
- HOA
- −$0
- Vacancy / Maint / Mgmt
- −$344
- Net cashflow
- $868
Break-even live
UW: 25.0% down · 7.5% · 30yr · 1.5% tax · 5.0% vac · 8.0% maint · 8.0% mgmt
Financing live
Cash to close
- Down payment
- $17,475
- Closing costs
- $2,097
- Reserves months
- —
- Total cash needed
- —
Loan-product check · same deal, 3 products live
Conventional
25% down · 7.5% · 30yr
- Down + closing
- —
- Monthly P&I
- —
- Monthly cashflow
- —
- DSCR
- —
- Eligible?
- —
Personal DTI + credit; lowest rate.
DSCR
20% down · 8.5% · 30yr
- Down + closing
- —
- Monthly P&I
- —
- Monthly cashflow
- —
- DSCR
- —
- Eligible?
- —
No personal income docs; deal must DSCR.
Hard money
10% down · 12.0% · 12mo
- Down + closing
- —
- Monthly P&I
- —
- Monthly cashflow
- —
- DSCR
- —
- Eligible?
- —
Short-term bridge; refi at stabilization.
Rent comps 35 comps
| Address | Beds | Baths | Sqft | Rent | $/sqft | DOM | Units | Dist |
|---|---|---|---|---|---|---|---|---|
| 3310 Elbert St Baltimore, MD | 2.0 | 1.0 | 920 | $1,550 | $1.68 | 24d | 1 | 0.30mi |
| 4018 Massachusetts Ave Baltimore, MD | 3.0 | 1.0 | 1050 | $1,400 | $1.33 | 24d | 1 | 0.44mi |
| 304 Collins Ave Unit 2 Baltimore, MD | 3.0 | 1.0 | 1016 | $2,100 | $2.07 | 44d | 1 | 0.49mi |
| 3607 W Lexington St Baltimore, MD | 3.0 | 2.0 | 1050 | $1,895 | $1.80 | 4d | 1 | 0.51mi |
| 3392 Saint Benedict St Baltimore, MD | 2.0 | 1.0 | 864 | $1,450 | $1.68 | 24d | 1 | 0.63mi |
| 2 S Woodington Rd Baltimore, MD | 2.0 | 1.0 | 856 | $1,160 | $1.36 | 15d | 1 | 0.67mi |
| 2 N Woodington Rd Baltimore, MD | 1.0–2.0 | 1.0 | 738 | $1,335 | $1.81 | 3d | 5 | 0.68mi |
| 3706 W Franklin St Unit 1 Baltimore, MD | 2.0 | 1.0 | 735 | $1,100 | $1.50 | 4d | 1 | 0.71mi |
| 4301 Parkton St Baltimore, MD | 1.0–3.0 | 1.0 | 730 | $1,550 | $2.12 | 44d | 1 | 0.74mi |
| 709 Denison St Baltimore, MD | 2.0 | 2.0 | 840 | $1,630 | $1.94 | 24d | 1 | 0.88mi |
| 2657 Lehman St Unit 1 Baltimore, MD | 2.0 | 1.0 | 1056 | $1,000 | $0.95 | 44d | 1 | 0.91mi |
| 2815 W Mulberry St Baltimore, MD | 4.0 | 2.0 | 1040 | $2,050 | $1.97 | 44d | 1 | 0.92mi |
| 332 S Franklintown Rd Unit 2 Baltimore, MD | 2.0 | 1.0 | 776 | $795 | $1.02 | 24d | 1 | 0.93mi |
| 4431 Eldone Rd Baltimore, MD | 3.0 | 2.0 | 896 | $2,000 | $2.23 | 24d | 1 | 0.97mi |
| 2540 Frederick Ave Baltimore, MD | 3.0 | 1.0 | 1075 | $1,400 | $1.30 | 24d | 1 | 0.97mi |
| 787 N Grantley St Baltimore, MD | 3.0 | 1.0 | 1116 | $1,575 | $1.41 | 24d | 1 | 0.98mi |
| 2516 Hollins St Baltimore, MD | 3.0 | 2.0 | 1100 | $1,700 | $1.55 | 44d | 1 | 1.00mi |
| 751 Yale Ave Baltimore, MD | 3.0 | 1.5 | 1024 | $1,750 | $1.71 | 44d | 1 | 1.01mi |
| 4601 Pen Lucy Rd Unit 4714-B Baltimore, MD | 2.0 | 1.0 | 730 | $1,205 | $1.65 | 15d | 1 | 1.05mi |
| 4601 Pen Lucy Rd Unit 103-H Baltimore, MD | 2.0 | 1.0 | 798 | $1,315 | $1.65 | 24d | 1 | 1.05mi |
| 4601 Pen Lucy Rd Unit 4718-F Baltimore, MD | 2.0 | 1.0 | 879 | $1,225 | $1.39 | 2d | 1 | 1.05mi |
| 4601 Pen Lucy Rd Unit 4615-G Baltimore, MD | 2.0 | 1.0 | 798 | $1,200 | $1.50 | 22d | 1 | 1.05mi |
| 402 Colleen Rd Baltimore, MD | 1.0–2.0 | 1.0 | 910 | $1,450 | $1.59 | 2d | 11 | 1.10mi |
| 4520 Scarlet Oak Ln Baltimore, MD | 2.0 | 1.0 | 1025 | $1,500 | $1.46 | 44d | 1 | 1.10mi |
| 627 Lucia Ave Baltimore, MD | 3.0 | 1.0 | 892 | $1,750 | $1.96 | 24d | 1 | 1.13mi |
| 219 Atholgate Ln Baltimore, MD | 1.0–3.0 | 1.0–1.5 | 814 | $1,500 | $1.84 | 3d | 2 | 1.18mi |
| 613 S Beechfield Ave Baltimore, MD | 3.0 | 1.5 | 1080 | $1,950 | $1.81 | 44d | 1 | 1.18mi |
| 62 N Gorman Ave Baltimore, MD | 3.0 | 2.0 | 1100 | $2,500 | $2.27 | 18d | 1 | 1.21mi |
| 1042 Ellicott Dr Baltimore, MD | 2.0 | 1.0 | 900 | $1,450 | $1.61 | 44d | 1 | 1.25mi |
| 501 Hazlett Ave Baltimore, MD | 2.0–3.0 | 1.5–2.0 | 1044 | $1,879 | $1.80 | 2d | 8 | 1.28mi |
| 4103 Mountwood Rd Baltimore, MD | 3.0 | 2.0 | 1030 | $1,700 | $1.65 | 44d | 1 | 1.31mi |
| 1216 N Augusta Ave Baltimore, MD | 3.0 | 1.0 | 1024 | $1,550 | $1.51 | 24d | 1 | 1.32mi |
| 1307 Wildwood Pkwy Baltimore, MD | 2.0 | 1.0 | 725 | $1,295 | $1.79 | 44d | 1 | 1.32mi |
| 4103 Stokes Dr Apt 1 Baltimore, MD | 2.0 | 1.0 | 725 | $1,095 | $1.51 | 44d | 1 | 1.41mi |
| 532 Coventry Rd Baltimore, MD | 2.0 | 1.0 | 661 | $1,300 | $1.97 | 22d | 1 | 1.43mi |
Listing history 9 events
-
2026-06-18days on market $69,900 Active 13 DOM
-
2026-06-17days on market $69,900 Active 12 DOM
-
2026-06-16days on market $69,900 Active 11 DOM
-
2026-06-15days on market $69,900 Active 10 DOM
-
2026-06-13days on market $69,900 Active 8 DOM
-
2026-06-09days on market $69,900 Active 4 DOM
-
2026-06-08days on market $69,900 Active 3 DOM
-
2026-06-07remarks 268-char remark
-
2026-06-07$69,900 Active 2 DOM
ⓘ Source: listings_history table (triggers on properties + properties_extension) + one-shot
backfill from property_details.listing_events for pre-trigger history.
Tax reassessment forecast MD · Partial reset (capped growth)
- Current annual tax
- $378 · $32/mo
- Projected year-2 tax
- $570 · $48/mo
- Expected delta
- +$192/yr (+$16/mo · 50.7%)
ⓘ Screening estimate from a state-policy table — verify with the county assessor before closing.
Climate risk First Street
- Flood 1/10 Low FEMA zone X (unshaded) · 0% chance over 30 yrs
- Wildfire 1/10 Low
- Heat 7/10 Severe 7 d/yr ≥103°F today · 15 d/yr by 30 yrs out
- Wind 5/10 Major 24% chance of damaging wind over 30 yrs
- Air quality 3/10 Moderate 3 unhealthy d/yr today · 4 by 30 yrs out
Nearby sold comps map
Loading sold comps map…
Walkable amenities ~0.75 mi
Loading nearby amenities…
Taxation est. · year 1
- Rental income
- $19,671
- − Mortgage interest
- −$3,915
- − Property taxes
- −$378
- − Insurance
- −$350
- − Repairs & maintenance
- −$1,574
- − Management
- −$1,574
- − Depreciation
- −$2,033
- Taxable income
- $9,847
- Est. tax owed @ 24.0%
- −$2,363
- After-tax cash flow
- $8,051/yr
For passive investors: Depreciation is non-cash, so a rental often shows a tax loss while cash-flowing — sheltering income. Rental losses are passive: they offset passive income freely, and up to $25,000/yr can offset ordinary (W-2) income if you actively participate and your MAGI is under $100k (phasing out to $0 by $150k); unused losses carry forward. On sale, claimed depreciation is recaptured at up to 25%, and gains may owe capital-gains tax (a 1031 exchange can defer both). Figures are a year-1 estimate at your 24.0% rate — not tax advice; consult a CPA.
Schools (NCES district)
- District
- Baltimore City Public Schools
- NCES district ID
- 2400090
- Math proficiency
- 7% ▼ -9.00%
- Reading proficiency
- 16% ▼ -5.00%
- Median HH income
- $42,108
- Composite
- 10.08/100
- National rank
- #9805
- State rank
- #24 of 24 in MD
Livability — Baltimore
- Score
- 76/100
- State rank
- #90
- US rank
- #3396
Category grades
Schools grade is shown separately in the Schools card above.
Census & demographics
- Census place
- Baltimore, MD
- County
- Baltimore City · 558,601 people
- City population
- 588,727
- Metro
- Baltimore-Columbia-Towson, MD
- Population (ZIP)
- 46,679
- Household income
- $60,047
- Rent vs Own
- Severe rent burden
- 2776.0
Population outlook (Baltimore County) Hauer SSP2
- Today (2025)
- 624,249 people
- By 2030
- 621,541 · -0.4%
- By 2040
- 609,756 · -2.3%
- By 2050
- 597,249 · -4.3%
- By 2075
- 552,236 · -11.5%
- By 2100
- 513,934 · -17.7%
Race, ethnicity, and origin ACS 2023
- Neighborhood character
- Predominantly Black (73%)
- Race & ethnicity
- Black 73% White 15% Hispanic / Latino 6% Two or more races 4% Asian 3%
- Hispanic origin (detail)
- Common ancestry
- Lithuanian 1% Romanian 1% Serbian 1%
- Foreign-born
- 5% · Canada, Philippines
- Languages at home
- 91% English-only · Spanish 4% Other Indo-European 2% Other Asian/Pacific 1%
Political lean MEDSL · Baltimore
- 2024 margin
- Solid D (+73.0) · D 85.2% · R 12.2% · Other 2.6%
- 2008→2024 swing
- -2.5pp toward R · 2008: 75.5pp · 2024: 73.0pp
- All cycles
- 2024: D+73.0 2020: D+76.6 2016: D+74.6 2012: D+76.4 2008: D+75.5
Not yet ingested
- Civics
- —
Market trends
- HPI YoY
- ▼ -259.07%
- Current HPI
- 226.896
- Rent YoY
- ▲ 5.38%
- Metro
- Baltimore-Columbia-Towson, MD
- State GDP YoY
- ▲ 2.97%
- F500 in state
- 12
Industry mix (Fortune 500 HQ in MD)
| Industry | F500 HQs | Revenue |
|---|---|---|
| Aerospace / Defense | 1 | $71B |
|
||
| Utilities | 1 | $25B |
|
||
| Hotels | 1 | $24B |
|
||
| Consumer Goods | 1 | $7B |
|
||
| Real Estate | 1 | $6B |
|
||
| Chemicals | 1 | $2B |
|
||
Price history
+1298.0% since first listed22 events — show timeline
- 2026-06-05 Listed $69,900 BRIGHT MLS
- 2024-01-29 Sold (Public Records) $300,000 Public Records
- 2023-06-11 Listing Removed — BRIGHT MLS
- 2023-06-02 Relisted — BRIGHT MLS
- 2023-02-15 Listing Removed — BRIGHT MLS
- 2023-02-03 Price Changed $115,000 BRIGHT MLS
- 2023-01-19 Price Changed $120,000 BRIGHT MLS
- 2022-11-18 Price Changed $125,000 BRIGHT MLS
- 2022-10-10 Price Changed $130,000 BRIGHT MLS
- 2022-09-23 Price Changed $140,000 BRIGHT MLS
- 2022-07-28 Relisted — BRIGHT MLS
- 2022-07-14 Relisted — BRIGHT MLS
- 2022-07-11 Listing Removed — BRIGHT MLS
- 2022-04-16 Contingent — BRIGHT MLS
- 2022-03-17 Price Changed $145,000 BRIGHT MLS
- 2022-02-28 Listed $150,000 BRIGHT MLS
- 2020-01-20 Sold (MLS) $10,000 BRIGHT MLS
- 2019-12-18 Pending — BRIGHT MLS
- 2019-12-10 Price Changed $9,000 BRIGHT MLS
- 2019-10-09 Price Changed $10,000 BRIGHT MLS
- 2019-04-23 Price Changed $20,000 BRIGHT MLS
- 2019-04-17 Listed $5,000 BRIGHT MLS
Property tax history
-8.6%/yrLatest (2025): $378 · +3.9% YoY. Source: county tax records.
Cash-flow waterfall
monthlySold comps — $/sqft
last 12 mo · ≤1 miLoading sold comps…