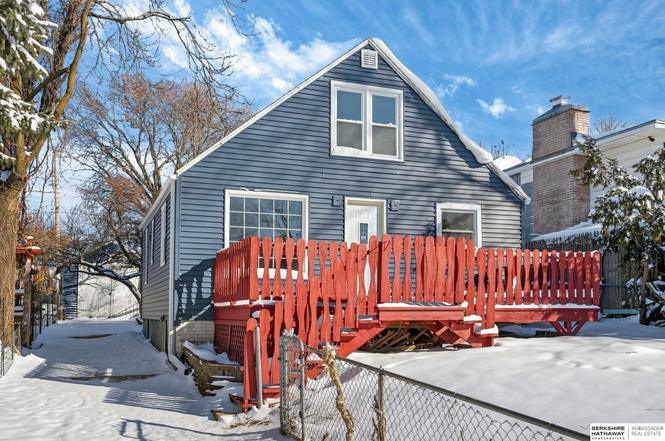
6316 Franklin St · Omaha, NE
Flood risk 1/10 · Minimal
- FEMA flood zone
- X (unshaded)
- Chance of flooding over 30 yrs
- 0.0%
- Est. flood insurance / yr
- $473 – $860
Fire risk 1/10 · Minimal
- Est. fire insurance / yr
- $1,161 – $2,155
Heat risk 3/10 · Minor
- Hot days now (above 104°F)
- 7 days/yr
- Hot days in 30 yrs
- 15 days/yr
Wind risk 2/10 · Minimal
- Chance of severe wind over 30 yrs
- —
Air-quality risk 2/10 · Minimal
- Unhealthy air days now
- 0 days/yr
- Unhealthy air days in 30 yrs
- 1 days/yr
Risk factors via First Street. Map © Google.
Why this score? — see what drove the D grade
The composite is a weighted blend of 9 inputs, each scored 0–100. Each bar is that input's sub-score; the figure is the points it added to the 100-point composite (weight × sub-score).
- Cash flow +16.7/30.0
- ARV discount +7.5/15.0
- DSCR +5.2/10.0
- Livability +4.2/5.0
- 1% rule +3.8/10.0
- Rent growth +3.1/5.0
- Condition / age +2.5/5.0
- Schools +2.1/10.0
- Appreciation +0.0/10.0
$200,000
🖨 Deal sheet (PDF) 📄 Offer letter ✓ Due diligence
Listing remarks
AMA. PRE-INSPECTED. Updated 5-bed, 2-bath home in the Benson neighborhood! Detached garage, alley access, and spacious backyard. Features new siding, gutters, deck, interior paint, refinished floors, and renovated kitchen & baths. Move-in ready near Benson dining, shops, and entertainment. March 2026 seller installed Carbon Armor in the foundation for support
Key facts
- Alley access
- Spacious backyard
- New siding
Tags
Property features AI
Exterior
- Parking: Detached garage (1 covered space, 1 total parking space)
- Utilities: Public water; Public sewer; Electricity available; Natural gas available
- Home design: Single-family residence; One and one-half levels; Not new / not a model
- Construction: Vinyl siding; Composition roof; Slab foundation; Built in 1925
- Exterior features: Deck; Chain link fence; City lot with public sidewalk; Up to 1/4 acre lot
Interior
- Kitchen: Range; Refrigerator; Disposal
- Bedrooms: Primary bedroom on 2nd floor (approx. 11.1 x 12.6); Bedroom 2 on 2nd floor (approx. 9.1 x 12.6); Bedroom 3 on main floor (approx. 9.1 x 9.1); Bedroom 4 on main floor (approx. 11.1 x 8.1); Bedroom 5 in basement (approx. 12.2 x 11.1)
- Flooring: Vinyl flooring
- Bathrooms: 2 full bathrooms (1 on main level)
- Heating & cooling: Natural gas forced air heating; Central air conditioning
- Interior features: Partially finished basement; No fireplaces; Vinyl flooring
- Laundry & utility: Basement utilities and finished below-grade space
Neighborhood map
What this means for you Summary
Snapshot
- This is a 4-bed/1.5-bath other listed at $200k.
Deal economics
- At list price, monthly cash flow is $123 ($1k/yr) — positive.
- The deal already cash-flows at list — no discount required.
- To meet the 1% rule (rent ≥ 1% of price), the offer needs to be $175k (12.3% below list).
- Recommended offer: $175k (12.3% below list) — sets the bar for 1% rule.
- Cap rate 7.0% vs local median 3.6% in Omaha — top-decile yield for the area; either an underpriced asset or a hidden risk that comps aren't pricing in. Stress-test before assuming the spread holds.
Location & tenants
- Location reads 84/100 on livability (#7 in NE, #663 nationally) — a professional / high-income tenant draw. Strengths: amenities A+, commute A+, cost of living A+; Watch: crime F.
- Omaha Public Schools (urban): math 20% / reading 28% proficiency, ranked #110 of 111 in NE (top 99%) — low school quality limits family demand, transient renter base, plan for 1-2y turnover; 62% free/reduced lunch — lower-income household profile, screen leases tightly.
- Zoned schools: Western Hills Magnet Center (math 17% / reading 32%, grade F, #445 of 502 statewide, top 91%, 333 students, 0% FRL); Lewis & Clark Middle School (math 23% / reading 35%, grade F, #115 of 128 statewide, top 90%, 860 students, 0% FRL); Benson High School (math 9% / reading 12%, grade F, #257 of 261 statewide, top 98%, 1,570 students, 0% FRL) — zoned schools average 0% FRL vs 62% district-wide (62 pts lower); this property's tenant base skews higher-income than the district average.
- Market conditions: Rents rising (+2.4%/yr); 181 active listings in the ZIP; 15 comparable units currently listed for rent nearby; rentals at typical pace (median 26d on market — plan ~3-4 weeks tenant-placement turnaround); 40% of comp listings sitting > 30 days — soft ceiling on asking rent; 4,539 units permitted in Douglas County in 2024 (2,583 in 5+ unit buildings).
- This rent runs 35% of the median local income ($61k/yr) — at the standard rent-burdened threshold; future hikes will face affordability resistance.
Forward outlook
- Local home prices are declining (-3.0%/yr); year-one equity from $1k of loan paydown is wiped out by about $6k of value loss. Plan a longer hold.
- Douglas County population projected at +28% by 2050 — long-run rental-demand tailwind backs the buy-and-hold thesis.
Negotiation context
- It's been on market 45 days — a 3% lower offer ($194k) is reasonable based on typical stale-listing flexibility.
- 2 sale attempts; this cycle's ask has dropped $18k (8%) from the opening price — seller is motivated, your offer sets the floor, not the list.
- Current owner paid $95k; list at $200k implies a 111% gain — meaningful room to come down on a strong offer.
Risks & watch-outs
- Watch-outs: built in 1925 — expect roof / HVAC / electrical / plumbing capex.
Questions for the listing agent
- It's been on market 45 days. Have you received any prior offers? Is the seller open to a 12% concession, seller financing, or rate buy-down credit?
- Built in 1925 — when were the roof, HVAC, electrical panel, plumbing, and water heater last replaced?
- Is there a deadline driving the sale (1031 exchange, divorce, estate, relocation)? That informs how much negotiation room exists.
- Crime grade is F in this area — have there been break-ins, vandalism, or insurance claims at this property in the last 3 years? What carrier currently insures it and at what premium?
- The area grade is low — what's the realistic commute time and amenity access for the typical tenant pool here? Any planned neighborhood developments (good or bad) we should know about?
- What's the average days-on-market for RENTAL listings here right now (not sales)? A rising rental-DOM trend means longer vacancies and softer asking-rent achievability than the comps imply.
- What's the recent tenant-quality profile in this submarket — average credit score on applications, eviction rate, late-payment / NSF rate, and stable-employment percentage? A property-management company in the area should have these aggregated.
- How much new for-sale + rental construction is in the pipeline within 1–3 miles? Heavy new supply typically softens prices + rents 12–24 months out; constrained supply supports both.
Investment metrics
- 1% rule
- 0.88% ✗
- Cap rate
- 7.03%
- Cash-on-cash
- 2.63%
- DSCR
- 1.12
- GRM
- 9.5
CMA / ARV
No comps found within radius.
Projected returns pro-forma
-3.0% appreciation · 2.35% rent growth · sell at horizon
- IRR
- -12.8%
- Equity multiple
- 0.54×
- Total profit
- $-25,773
- Equity at exit
- $29,821
- IRR
- -4.8%
- Equity multiple
- 0.69×
- Total profit
- $-17,178
- Equity at exit
- $17,292
Cash invested: $56,000 (down + closing). Projections, not guarantees.
Landlord ↔ Tenant lean methodology
- Overall (STATE)
- 83 Strongly Landlord-Friendly
- State Nebraska
- 83 Strongly Landlord-Friendly · R+13
- County
- — inherits STATE
- City
- — inherits STATE
ZIP-level market 68104
- Rents YoY
- 2.4%
- Active inventory
- 181
- Price-to-rent
- 9.5×
Monthly cashflow live
- Estimated rent
- $1,755 high interval (Pro) →
- Mortgage (P&I)
- −$1,049
- Tax from tax record
- −$131 /mo · $1,575/yr
- Insurance
- −$83
- HOA
- −$0
- Vacancy / Maint / Mgmt
- −$368
- Net cashflow
- $123
Break-even live
Sensitivity live
| Price | -10% $236 | -5% $179 | +0% $123 | +5% $66 | +10% $10 |
|---|---|---|---|---|---|
| Rent | -10% $-16 | -5% $53 | +0% $123 | +5% $192 | +10% $261 |
| Rate | -1.0pp $224 | -0.5pp $174 | base $123 | +0.5pp $71 | +1.0pp $18 |
UW: 25.0% down · 7.5% · 30yr · 1.5% tax · 5.0% vac · 8.0% maint · 8.0% mgmt
Financing live
Cash to close
- Down payment
- $50,000
- Closing costs
- $6,000
- Reserves months
- —
- Total cash needed
- —
Loan-product check · same deal, 3 products live
Conventional
25% down · 7.5% · 30yr
- Down + closing
- —
- Monthly P&I
- —
- Monthly cashflow
- —
- DSCR
- —
- Eligible?
- —
Personal DTI + credit; lowest rate.
DSCR
20% down · 8.5% · 30yr
- Down + closing
- —
- Monthly P&I
- —
- Monthly cashflow
- —
- DSCR
- —
- Eligible?
- —
No personal income docs; deal must DSCR.
Hard money
10% down · 12.0% · 12mo
- Down + closing
- —
- Monthly P&I
- —
- Monthly cashflow
- —
- DSCR
- —
- Eligible?
- —
Short-term bridge; refi at stabilization.
Rent comps 15 comps
| Address | Beds | Baths | Sqft | Rent | $/sqft | DOM | Units | Dist |
|---|---|---|---|---|---|---|---|---|
| 6241 Decatur St Omaha, NE | 3.0 | 1.0 | 866 | $1,595 | $1.84 | 12d | 1 | 0.11mi |
| 6020 Franklin St Omaha, NE | 3.0 | 1.5 | 1216 | $1,900 | $1.56 | 45d | 1 | 0.24mi |
| 5633 Parker St Omaha, NE | 3.0 | 1.5 | 1200 | $1,695 | $1.41 | 45d | 1 | 0.51mi |
| 2817 N 60th St Unit 2817/02 Omaha, NE | 3.0 | 1.0 | 1188 | $1,500 | $1.26 | 5d | 1 | 0.75mi |
| 2817 N 60th St Unit 2821/02 Omaha, NE | 3.0 | 1.0 | 1188 | $1,045 | $0.88 | 25d | 1 | 0.76mi |
| 7602 Parker St Omaha, NE | 3.0 | 2.0 | 1050 | $1,700 | $1.62 | 45d | 1 | 1.06mi |
| 7602 Parker St Omaha, NE | 3.0 | 2.0 | 1040 | $1,695 | $1.63 | 5d | 1 | 1.06mi |
| 6010 Evans St Omaha, NE | 3.0 | 2.0 | 1196 | $1,850 | $1.55 | 25d | 1 | 1.18mi |
| 4918 California St Omaha, NE | 3.0 | 1.0 | 1369 | $1,695 | $1.24 | 25d | 1 | 1.34mi |
| 2914 N 49th Ave Omaha, NE | 3.0 | 1.0 | 1375 | $1,615 | $1.17 | 25d | 1 | 1.35mi |
| 4824 Webster St Unit 4824/4824 Omaha, NE | 4.0 | 1.0 | 1317 | $1,050 | $0.80 | 45d | 1 | 1.37mi |
| 4874 Maple St Omaha, NE | 3.0 | 1.0 | 1098 | $1,545 | $1.41 | 45d | 1 | 1.41mi |
| 7725 Webster St Omaha, NE | 3.0 | 2.0 | 1300 | $1,850 | $1.42 | 23d | 1 | 1.45mi |
| 3002 N 48th Ave Omaha, NE | 4.0 | 2.0 | 1205 | $1,550 | $1.29 | 25d | 1 | 1.47mi |
| 5119 Pratt St Omaha, NE | 3.0 | 1.0 | 1008 | $1,900 | $1.88 | 45d | 1 | 1.49mi |
Listing history 8 events
-
2026-04-17status Pending
-
2026-04-15price $200,000
-
2026-04-10status Back On Market
-
2026-04-02status Pending
-
2026-03-27price $209,900
-
2026-03-19price $215,000
-
2026-02-23$218,000 New
-
2025-10-08soldstatus $94,862
ⓘ Source: listings_history table (triggers on properties + properties_extension) + one-shot
backfill from property_details.listing_events for pre-trigger history.
Tax reassessment forecast NE · Resets to sale price
- Current annual tax
- $1,575 · $131/mo
- Projected year-2 tax
- $3,460 · $288/mo
- Expected delta
- +$1,885/yr (+$157/mo · 119.7%)
ⓘ Screening estimate from a state-policy table — verify with the county assessor before closing.
Climate risk First Street
- Flood 1/10 Low FEMA zone X (unshaded) · 0% chance over 30 yrs
- Wildfire 1/10 Low
- Heat 3/10 Moderate 7 d/yr ≥104°F today · 15 d/yr by 30 yrs out
- Wind 2/10 Low
- Air quality 2/10 Low 0 unhealthy d/yr today · 1 by 30 yrs out
Nearby sold comps map
Loading sold comps map…
Walkable amenities ~0.75 mi
Loading nearby amenities…
Taxation est. · year 1
- Rental income
- $21,057
- − Mortgage interest
- −$11,203
- − Property taxes
- −$1,575
- − Insurance
- −$1,000
- − Repairs & maintenance
- −$1,685
- − Management
- −$1,685
- − Depreciation
- −$5,818
- Taxable loss
- −$1,909
- Est. tax savings @ 24.0%
- +$458
- After-tax cash flow
- $1,932/yr
For passive investors: Depreciation is non-cash, so a rental often shows a tax loss while cash-flowing — sheltering income. Rental losses are passive: they offset passive income freely, and up to $25,000/yr can offset ordinary (W-2) income if you actively participate and your MAGI is under $100k (phasing out to $0 by $150k); unused losses carry forward. On sale, claimed depreciation is recaptured at up to 25%, and gains may owe capital-gains tax (a 1031 exchange can defer both). Figures are a year-1 estimate at your 24.0% rate — not tax advice; consult a CPA.
Schools (NCES district)
- District
- Omaha Public Schools
- NCES district ID
- 3174820
- Math proficiency
- 20% ▼ -10.00%
- Reading proficiency
- 28% ▼ -5.00%
- Median HH income
- $46,039
- Composite
- 20.83/100
- National rank
- #8502
- State rank
- #110 of 111 in NE
Livability — Omaha
- Score
- 84/100
- State rank
- #7
- US rank
- #663
Category grades
Schools grade is shown separately in the Schools card above.
Census & demographics
- Census place
- Omaha, NE
- County
- Douglas County · 538,646 people
- City population
- 552,986
- Metro
- Omaha-Council Bluffs, NE-IA
- Population (ZIP)
- 36,673
- Household income
- $60,549
- Rent vs Own
- Severe rent burden
- 1738.0
Population outlook (Douglas County) Hauer SSP2
- Today (2025)
- 625,245 people
- By 2030
- 661,613 · +5.8%
- By 2040
- 732,395 · +17.1%
- By 2050
- 801,988 · +28.3%
- By 2075
- 968,637 · +54.9%
- By 2100
- 1,101,871 · +76.2%
Race, ethnicity, and origin ACS 2023
- Neighborhood character
- Diverse neighborhood (Simpson 0.68)
- Race & ethnicity
- White 50% Black 23% Asian 12% Two or more races 11% Hispanic / Latino 7%
- Hispanic origin (detail)
- Mexican 6%
- Common ancestry
- Slovak 2% Lithuanian 2% Romanian 2%
- Foreign-born
- 13% · Philippines, Canada, India
- Languages at home
- 83% English-only · Other Asian/Pacific 8% Spanish 5% Other Indo-European 2%
Political lean MEDSL · Douglas
- 2024 margin
- D (+10.2) · D 54.4% · R 44.2% · Other 1.4%
- 2008→2024 swing
- +5.5pp toward D · 2008: 4.6pp · 2024: 10.2pp
- All cycles
- 2024: D+10.2 2020: D+11.3 2016: D+1.4 2012: R+4.3 2008: D+4.6
Not yet ingested
- Civics
- —
Market trends
- HPI YoY
- ▼ -196.54%
- Current HPI
- 298.8625
- Rent YoY
- ▲ 2.35%
- Metro
- Omaha-Council Bluffs, NE-IA
- State GDP YoY
- ▲ 0.68%
- F500 in state
- 2
Industry mix (Fortune 500 HQ in NE)
| Industry | F500 HQs | Revenue |
|---|---|---|
| Conglomerate | 1 | $371B |
|
||
Price history
+110.8% since first listed8 events — show timeline
- 2026-04-17 Pending — GPRMLS
- 2026-04-15 Price Changed $200,000 GPRMLS
- 2026-04-10 Relisted — GPRMLS
- 2026-04-02 Pending — GPRMLS
- 2026-03-27 Price Changed $209,900 GPRMLS
- 2026-03-19 Price Changed $215,000 GPRMLS
- 2026-02-23 Listed $218,000 GPRMLS
- 2025-10-08 Sold (Public Records) $94,862 Public Records
Property tax history
+0.5%/yrLatest (2025): $1,575 · +0.4% YoY. Source: county tax records.
Cash-flow waterfall
monthlySold comps — $/sqft
last 12 mo · ≤1 miLoading sold comps…