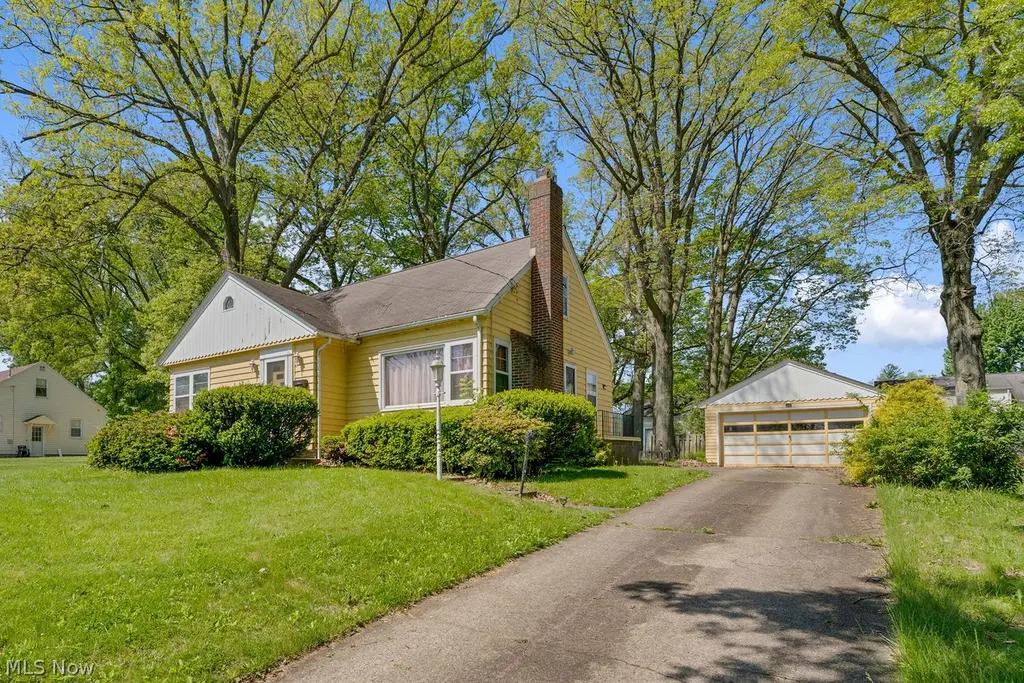
132 S Main St · Austintown, OH
Flood risk 1/10 · Minimal
- FEMA flood zone
- X (unshaded)
- Chance of flooding over 30 yrs
- 0.0%
- Est. flood insurance / yr
- $473 – $860
Fire risk 1/10 · Minimal
- Est. fire insurance / yr
- $713 – $1,323
Heat risk 3/10 · Minor
- Hot days now (above 98°F)
- 7 days/yr
- Hot days in 30 yrs
- 17 days/yr
Wind risk 1/10 · Minimal
- Chance of severe wind over 30 yrs
- —
Air-quality risk 2/10 · Minimal
- Unhealthy air days now
- 1 days/yr
- Unhealthy air days in 30 yrs
- 2 days/yr
Risk factors via First Street. Map © Google.
Why this score? — see what drove the B- grade
The composite is a weighted blend of 9 inputs, each scored 0–100. Each bar is that input's sub-score; the figure is the points it added to the 100-point composite (weight × sub-score).
- Cash flow +24.5/30.0
- ARV discount +15.0/15.0
- DSCR +7.9/10.0
- 1% rule +6.3/10.0
- Schools +5.1/10.0
- Livability +3.7/5.0
- Rent growth +2.5/5.0
- Condition / age +2.5/5.0
- Appreciation +0.0/10.0
$115,000
🖨 Deal sheet 📄 Offer letter ✓ Due diligence
Listing remarks
Full of timeless charm and character, this classic cape cod in the heart of Austintown is ready to welcome you home! Featuring 3 bedrooms, 1 full bathroom, and original hardwood floors that bring warmth and personality throughout, this home offers the kind of character you just can’t recreate. The 2-car detached garage provides plenty of storage and parking, while the inclusion of two parcels gives you extra outdoor space and added flexibility rarely found at this price point. From the cozy character inside to the spacious yard outside, this home is filled with opportunity to make it your own. Located in the highly desirable Austintown Local School District with convenient access to s
Key facts
- Spacious yard
- Two parcels
- 0.26 acre lot
Tags
Neighborhood map
What this means for you Summary
Snapshot
- This is a 3-bed/1.0-bath single-family listed at $115k.
Deal economics
- At list price, monthly cash flow is $235 ($3k/yr) — positive.
- The deal already cash-flows at list — no discount required.
- Meets the 1% rule at list price ($1k rent vs $115k).
- Cap rate 8.7% vs local median 4.8% in Austintown — top-decile yield for the area; either an underpriced asset or a hidden risk that comps aren't pricing in. Stress-test before assuming the spread holds.
Location & tenants
- Location reads 73/100 on livability (#322 in OH) — a middle-class / working-renter tenant base. Strengths: cost of living A+, housing A+, schools A; Watch: amenities F, commute F, employment D-.
- Austintown Local Schools (suburban): math 56% / reading 65% proficiency, ranked #290 of 656 in OH (top 44%) — acceptable for families but not a draw, mixed tenant base, ~2y average lease.
- Market conditions: 84 active listings in the ZIP; 7 comparable units currently listed for rent nearby; rentals at typical pace (median 21d on market — plan ~3-4 weeks tenant-placement turnaround); 147 units permitted in Mahoning County in 2024 (0 in 5+ unit buildings).
Forward outlook
- Local home prices are declining (-3.0%/yr); year-one equity from $795 of loan paydown is wiped out by about $3k of value loss. Plan a longer hold.
- Mahoning County population projected at -14% by 2050 — secular population decline; favor cash flow + early exit over multi-decade hold.
Negotiation context
- Only 2 days on market — expect competitive offers; lowballing is unlikely to land.
- Current owner paid $90k; 28% above their basis — modest negotiation headroom, anchor on the comps not their cost.
Risks & watch-outs
- Watch-outs: built in 1953 — expect roof / HVAC / electrical / plumbing capex.
Questions for the listing agent
- Built in 1953 — when were the roof, HVAC, electrical panel, plumbing, and water heater last replaced?
- Is there a deadline driving the sale (1031 exchange, divorce, estate, relocation)? That informs how much negotiation room exists.
- Schools are A-rated — typically a magnet for longer-tenancy family renters. What's the average tenant stay here, and is there a school-zone premium baked into asking?
- What's the average days-on-market for RENTAL listings here right now (not sales)? A rising rental-DOM trend means longer vacancies and softer asking-rent achievability than the comps imply.
- What's the recent tenant-quality profile in this submarket — average credit score on applications, eviction rate, late-payment / NSF rate, and stable-employment percentage? A property-management company in the area should have these aggregated.
- How much new for-sale + rental construction is in the pipeline within 1–3 miles? Heavy new supply typically softens prices + rents 12–24 months out; constrained supply supports both.
Investment metrics
- 1% rule
- 1.13% ✓
- Cap rate
- 8.75%
- Cash-on-cash
- 8.76%
- DSCR
- 1.39
- GRM
- 7.3
CMA / ARV
- ARV (on-the-fly)
- $167,706
- Comps found
- 12
Show comp detail 12 sales within ~0.75 mi
| Address | Dist | Beds/Ba | Sqft | Sold | Price | $/sf | Match |
|---|---|---|---|---|---|---|---|
| 132 S Main St | 0.00mi | 3/1.0 | 1,452 (+9%) | 0mo | $110,000 | $76 | 84 |
| 136 Rosemont Ave | 0.06mi | 3/1.5 | 1,438 (+8%) | 2mo | $126,000 | $88 | 80 |
| 102 S Main St | 0.06mi | 3/1.0 | 1,498 (+12%) | 1mo | $185,000 | $123 | 76 |
| 255 S Beverly Ave | 0.32mi | 3/2.0 | 1,288 (-3%) | 2mo | $185,000 | $144 | 74 |
| 119 S Beverly Ave | 0.22mi | 3/2.0 | 1,432 (+8%) | 4mo | $165,000 | $115 | 70 |
| 179 S Beverly Ave | 0.24mi | 3/2.0 | 1,200 (-10%) | 1mo | $189,900 | $158 | 68 |
| 923 Kirwan Dr | 0.58mi | 3/2.0 | 1,292 (-3%) | 2mo | $213,000 | $165 | 62 |
| 225 S Raccoon Rd | 0.44mi | 4/1.5 (+1) | 1,257 (-6%) | 2mo | $165,000 | $131 | 62 |
| 600 S Meridian Rd | 0.74mi | 3/1.0 | 1,308 (-2%) | 2mo | $170,000 | $130 | 61 |
| 3827 Frederick St | 0.37mi | 3/1.0 | 1,152 (-13%) | 1mo | $132,800 | $115 | 59 |
| 155 N Beverly Ave | 0.57mi | 4/1.0 (+1) | 1,224 (-8%) | 4mo | $154,429 | $126 | 52 |
| 161 N Roanoke Ave | 0.57mi | 3/1.0 | 1,140 (-14%) | 3mo | $128,500 | $113 | 47 |
Match score weights: distance 35% · size 25% · config 20% · recency 20%. Top-matched comps best support the ARV.
Projected returns pro-forma
-3.0% appreciation · 3.0% rent growth · sell at horizon
- IRR
- -3.0%
- Equity multiple
- 0.89×
- Total profit
- $-3,645
- Equity at exit
- $17,147
- IRR
- 6.7%
- Equity multiple
- 1.50×
- Total profit
- $16,185
- Equity at exit
- $9,943
Cash invested: $32,200 (down + closing). Projections, not guarantees.
Landlord ↔ Tenant lean methodology
- Overall (STATE)
- 73 Landlord-Friendly
- State Ohio
- 73 Landlord-Friendly · R+6
- County
- — inherits STATE
- City
- — inherits STATE
ZIP-level market 44515
- Home prices YoY
- -26.4%
- Active inventory
- 84
- Price-to-rent
- 7.3×
Monthly cashflow live
- Estimated rent
- $1,304 high interval (Pro) →
- Mortgage (P&I)
- −$603
- Tax from tax record
- −$144 /mo · $1,732/yr
- Insurance
- −$48
- HOA
- −$0
- Vacancy / Maint / Mgmt
- −$274
- Net cashflow
- $235
Break-even live
UW: 25.0% down · 7.5% · 30yr · 1.5% tax · 5.0% vac · 8.0% maint · 8.0% mgmt
Financing live
Cash to close
- Down payment
- $28,750
- Closing costs
- $3,450
- Reserves months
- —
- Total cash needed
- —
Loan-product check · same deal, 3 products live
Conventional
25% down · 7.5% · 30yr
- Down + closing
- —
- Monthly P&I
- —
- Monthly cashflow
- —
- DSCR
- —
- Eligible?
- —
Personal DTI + credit; lowest rate.
DSCR
20% down · 8.5% · 30yr
- Down + closing
- —
- Monthly P&I
- —
- Monthly cashflow
- —
- DSCR
- —
- Eligible?
- —
No personal income docs; deal must DSCR.
Hard money
10% down · 12.0% · 12mo
- Down + closing
- —
- Monthly P&I
- —
- Monthly cashflow
- —
- DSCR
- —
- Eligible?
- —
Short-term bridge; refi at stabilization.
Rent comps 7 comps
| Address | Beds | Baths | Sqft | Rent | $/sqft | DOM | Units | Dist |
|---|---|---|---|---|---|---|---|---|
| 131 N Edgehill Ave Youngstown, OH | 3.0 | 1.0 | 1200 | $1,350 | $1.12 | 21d | 1 | 0.50mi |
| 155 N Roanoke Ave Youngstown, OH | 3.0 | 1.5 | 1632 | $1,500 | $0.92 | 21d | 1 | 0.57mi |
| 70 N Raccoon Rd Youngstown, OH | 1.0–2.0 | 1.0 | 709 | $975 | $1.38 | 13d | 1 | 0.63mi |
| 4494 Burkey Rd Youngstown, OH | 3.0 | 1.5 | 1596 | $1,700 | $1.07 | 43d | 1 | 0.86mi |
| 4815 Westchester Dr Unit 4896-05 Austintown, OH | 2.0 | 1.5 | 1200 | $1,025 | $0.85 | 13d | 1 | 1.17mi |
| 4661 New Hampshire Ct Austintown, OH | 3.0 | 1.0–1.5 | 795 | $1,325 | $1.67 | 13d | 1 | 1.26mi |
| 2624 Oakwood Ave Unit 2632 Youngstown, OH | 3.0 | 1.0 | 1064 | $850 | $0.80 | 21d | 1 | 1.39mi |
Listing history 2 events
-
2026-05-21$115,000 Active
-
2024-02-01soldstatus $90,000
ⓘ Source: listings_history table (triggers on properties + properties_extension) + one-shot
backfill from property_details.listing_events for pre-trigger history.
Tax reassessment forecast OH · Partial reset (capped growth)
- Current annual tax
- $1,732 · $144/mo
- Projected year-2 tax
- $1,763 · $147/mo
- Expected delta
- +$31/yr (+$3/mo · 1.8%)
ⓘ Screening estimate from a state-policy table — verify with the county assessor before closing.
Climate risk First Street
- Flood 1/10 Low FEMA zone X (unshaded) · 0% chance over 30 yrs
- Wildfire 1/10 Low
- Heat 3/10 Moderate 7 d/yr ≥98°F today · 17 d/yr by 30 yrs out
- Wind 1/10 Low
- Air quality 2/10 Low 1 unhealthy d/yr today · 2 by 30 yrs out
Nearby sold comps map
Loading sold comps map…
Walkable amenities ~0.75 mi
Loading nearby amenities…
Taxation est. · year 1
- Rental income
- $15,651
- − Mortgage interest
- −$6,442
- − Property taxes
- −$1,732
- − Insurance
- −$575
- − Repairs & maintenance
- −$1,252
- − Management
- −$1,252
- − Depreciation
- −$3,345
- Taxable income
- $1,053
- Est. tax owed @ 24.0%
- −$253
- After-tax cash flow
- $2,568/yr
For passive investors: Depreciation is non-cash, so a rental often shows a tax loss while cash-flowing — sheltering income. Rental losses are passive: they offset passive income freely, and up to $25,000/yr can offset ordinary (W-2) income if you actively participate and your MAGI is under $100k (phasing out to $0 by $150k); unused losses carry forward. On sale, claimed depreciation is recaptured at up to 25%, and gains may owe capital-gains tax (a 1031 exchange can defer both). Figures are a year-1 estimate at your 24.0% rate — not tax advice; consult a CPA.
Schools (NCES district)
- District
- Austintown Local Schools
- NCES district ID
- 3904829
- Math proficiency
- 56% ▼ -12.00%
- Reading proficiency
- 65% ▼ -7.00%
- Median HH income
- $45,129
- Composite
- 50.99/100
- National rank
- #1778
- State rank
- #290 of 656 in OH
Livability — Austintown
- Score
- 73/100
- State rank
- #322
- US rank
- #5290
Category grades
Schools grade is shown separately in the Schools card above.
Census & demographics
- Census place
- Austintown, OH
- County
- Mahoning · 224,175 people
- City population
- 27,740
- Metro
- Youngstown-Warren, OH
- Population (ZIP)
- 27,740
- Household income
- $52,831
- Rent vs Own
- Severe rent burden
- 10.9
Population outlook (Mahoning County) Hauer SSP2
- Today (2025)
- 223,932 people
- By 2030
- 218,387 · -2.5%
- By 2040
- 205,367 · -8.3%
- By 2050
- 193,606 · -13.5%
- By 2075
- 173,694 · -22.4%
- By 2100
- 151,147 · -32.5%
Race, ethnicity, and origin ACS 2023
- Neighborhood character
- Predominantly White (83%)
- Race & ethnicity
- White 83% Black 8% Hispanic / Latino 5% Two or more races 4%
- Common ancestry
- Romanian 3% Slovak 2% Lithuanian 1%
- Foreign-born
- 2%
- Languages at home
- 96% English-only · Spanish 2% Other Indo-European 1%
Political lean MEDSL · Mahoning
- 2024 margin
- Lean R (+9.4) · D 44.9% · R 54.4%
- 2008→2024 swing
- -36.1pp toward R · 2008: 26.6pp · 2024: -9.4pp
- All cycles
- 2024: R+9.4 2020: R+1.9 2016: D+3.0 2012: D+27.7 2008: D+26.6
Not yet ingested
- Civics
- —
Market trends
- HPI YoY
- ▼ -81.64%
- Current HPI
- 228.0895
- Rent YoY
- —
- Metro
- —
- State GDP YoY
- ▲ 1.98%
- F500 in state
- 48
Industry mix (Fortune 500 HQ in OH)
| Industry | F500 HQs | Revenue |
|---|---|---|
| Insurance | 3 | $145B |
|
||
| Industrial Machinery | 3 | $49B |
|
||
| Financial Services | 3 | $24B |
|
||
| Consumer Goods | 2 | $93B |
|
||
| Aerospace / Defense | 2 | $47B |
|
||
| Utilities | 2 | $33B |
|
||
Price history
+27.8% since first listed2 events — show timeline
- 2026-05-21 Listed $115,000 MLSNOW
- 2024-02-01 Sold (Public Records) $90,000 Public Records
Property tax history
+5.9%/yrLatest (2025): $1,732 · +4.4% YoY. Source: county tax records.
Cash-flow waterfall
monthlySold comps — $/sqft
last 12 mo · ≤1 miLoading sold comps…