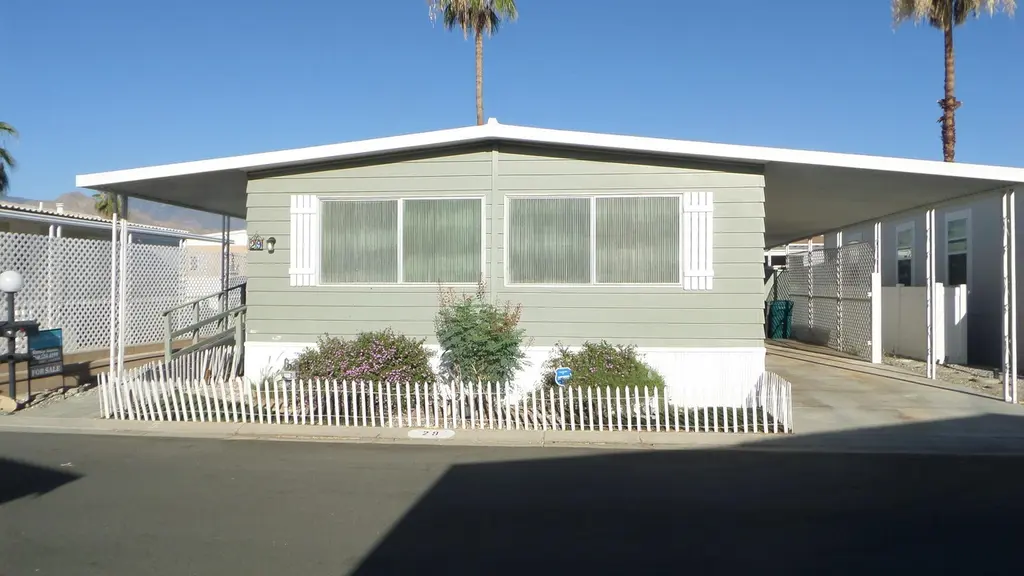
29 Mecca Dr · Cathedral City, CA
Flood risk 1/10 · Minimal
- FEMA flood zone
- X
- Chance of flooding over 30 yrs
- 0.0%
- Est. flood insurance / yr
- $507 – $1,088
Fire risk 4/10 · Minor
- Est. fire insurance / yr
- $659 – $1,223
Heat risk 9/10 · Severe
- Hot days now (above 113°F)
- 7 days/yr
- Hot days in 30 yrs
- 20 days/yr
Wind risk 1/10 · Minimal
- Chance of severe wind over 30 yrs
- —
Air-quality risk 5/10 · Moderate
- Unhealthy air days now
- 6 days/yr
- Unhealthy air days in 30 yrs
- 8 days/yr
Risk factors via First Street. Map © Google.
Why this score? — see what drove the B+ grade
The composite is a weighted blend of 9 inputs, each scored 0–100. Each bar is that input's sub-score; the figure is the points it added to the 100-point composite (weight × sub-score).
- Cash flow +30.0/30.0
- ARV discount +14.0/15.0
- 1% rule +10.0/10.0
- DSCR +10.0/10.0
- Rent growth +3.3/5.0
- Livability +3.3/5.0
- Schools +2.7/10.0
- Condition / age +2.2/5.0
- Appreciation +0.0/10.0
$94,900
🖨 Deal sheet 📄 Offer letter ✓ Due diligence
Listing remarks MLS
Don't miss this opportunity to become part of caliente Sands Mobile Home Park. it's a very friendly and diverse group of people that live there. There is also a very nice dog park, community spa and swimming pool. The park is conveniently located close to grocery storers, restaurants, theaters. And has great views of our mountains. This home is located toward the back of the park on a nice quit street. It has been modified to be wheelchair accessible and user friendly. The doorways are all wide. No hallways in the home. Bathrooms are open and have accessible sinks. The larger of 2 bathrooms has a garden tub with seating on the edge. Both bedrooms are very large with plenty of storage space. The kitchen has been updated and is bright and airy. The entire interior of the home has been painted. It has new laminate flooring throughout. There is an extended ramp on the left side of the home for easy access with a non-motorized wheelchair. The central air-conditioning is only 2 years old. And there is also a newer swamp cooler in the main living space. There are grab bars installed in the bathrooms. The outside of the home has been recently painted. This is a great opportunity for someone who is looking for a wheelchair assessable home to move right in. The land lease is the lease from the park that is 694.69 per month. This is the only lease.
Key facts
- Nice laundry room
- Private entrances
- Updated kitchen
Tags
Property features AI
Finance
- Other: Property sold as-is; Handicap access acknowledged; Rent control and pet restrictions apply; Short-term rentals not allowed; Will not consider lease
- Financial info: Land is a lease; Annual land lease amount $8,640; Rental restrictions apply; Listing terms: Cash; Sale type: Standard; Possession at close of escrow
- HOA & community: No monthly association fee; Senior community with clubhouse area, dog park and pickleball courts; Not a gated community
Exterior
- Parking: Attached carport; 2 total parking spaces (2 carport spaces)
- Security: No security features listed
- Utilities: Water served by a water district (C. V. W. D.); Sewer connected and paid; No PUD
- Home design: Double-wide mobile/manufactured home; Single-story (ground level); Pier jacks foundation; Manufactured in 1974; Aluminum skirting; Mobile home will remain; Located in a senior park (Caliente Sands)
- Construction: Assessor-recorded year built; Pier jacks foundation; Aluminum skirting
- Exterior features: Covered patio; Ramp to main level (disability access); Drip irrigation; Mountain view; Leisure and front door face south; Property in need of cosmetic repair; Detached property
Interior
- Kitchen: Refrigerator; Gas range, gas oven, gas cooktop; Dishwasher
- Bedrooms: All bedrooms on the ground level
- Flooring: Laminate
- Bathrooms: 1 full bathroom with shower stall and tub with jets
- Heating & cooling: Natural gas heating with forced air; Central air; Evaporative cooling; Ceiling fans
- Interior features: Blinds and drapes; Ground-level entry with steps; Unfurnished; Family room and great room
- Laundry & utility: Washer and dryer; Gas water heater
Neighborhood map
What this means for you Summary
Snapshot
- This is a 2-bed/2.0-bath manufactured listed at $95k. Condition is rated fair.
Deal economics
- At list price, monthly cash flow is $1k ($17k/yr) — positive.
- The deal already cash-flows at list — no discount required.
- Meets the 1% rule at list price ($3k rent vs $95k).
- Cap rate 24.7% vs local median 5.1% in Cathedral City — top-decile yield for the area; either an underpriced asset or a hidden risk that comps aren't pricing in. Stress-test before assuming the spread holds.
Location & tenants
- Location reads 66/100 on livability (#344 in CA) — a middle-class / working-renter tenant base. Strengths: commute A+, housing B+; Watch: employment D+, schools F, amenities D-.
- Palm Springs Unified (suburban): math 21% / reading 42% proficiency, ranked #328 of 517 in CA (top 63%) — families likely to look elsewhere, expect single-tenant / working-renter base with shorter leases; 73% free/reduced lunch — lower-income household profile, screen leases tightly.
- Market conditions: Rents rising (+3.2%/yr); 525 active listings in the ZIP; 40 comparable units currently listed for rent nearby; rentals at typical pace (median 25d on market — plan ~3-4 weeks tenant-placement turnaround); 45% of comp listings sitting > 30 days — soft ceiling on asking rent; 9,195 units permitted in Riverside County in 2024 (1,512 in 5+ unit buildings).
- This rent runs 44% of the median local income ($74k/yr) — at the standard rent-burdened threshold; future hikes will face affordability resistance.
Forward outlook
- Local home prices are declining (-3.0%/yr); year-one equity from $656 of loan paydown is wiped out by about $3k of value loss. Plan a longer hold.
- Riverside County population projected at +22% by 2050 — long-run rental-demand tailwind backs the buy-and-hold thesis.
- At projected returns (-3.0% appreciation + 3.2% rent growth), your $27k cash investment doubles in ~2 years — after that, you're playing with house money.
Negotiation context
- Only 9 days on market — expect competitive offers; lowballing is unlikely to land.
- 2 sale attempts since 3y ago with the ask held roughly flat each time — persistent listings suggest the price (not the market) is what's stuck; bring a comps-based counter.
Risks & watch-outs
- Climate carrying-cost: extreme-heat days projected 7→20/yr by 2055 (HVAC capex compounding) — expect insurance premiums to compound above CPI over the hold.
Questions for the listing agent
- Have any recent inspections been done? Can we get a copy of the seller's disclosures and any deferred-maintenance estimates?
- Built in 1974 — when were the roof, HVAC, electrical panel, plumbing, and water heater last replaced?
- Is there a deadline driving the sale (1031 exchange, divorce, estate, relocation)? That informs how much negotiation room exists.
- Schools are F-rated, which usually means shorter tenancies and higher turnover. Who's the typical renter profile here, and what's been the actual vacancy rate?
- What's the average days-on-market for RENTAL listings here right now (not sales)? A rising rental-DOM trend means longer vacancies and softer asking-rent achievability than the comps imply.
- What's the recent tenant-quality profile in this submarket — average credit score on applications, eviction rate, late-payment / NSF rate, and stable-employment percentage? A property-management company in the area should have these aggregated.
- How much new for-sale + rental construction is in the pipeline within 1–3 miles? Heavy new supply typically softens prices + rents 12–24 months out; constrained supply supports both.
Investment metrics
- 1% rule
- 2.82% ✓
- Cap rate
- 24.69%
- Cash-on-cash
- 65.72%
- DSCR
- 3.92
- GRM
- 3.0
CMA / ARV
- ARV (on-the-fly)
- $110,880
- Comps found
- 12
Show comp detail 12 sales within ~0.75 mi
| Address | Dist | Beds/Ba | Sqft | Sold | Price | $/sf | Match |
|---|---|---|---|---|---|---|---|
| 24 Mesa View Dr | 0.04mi | 2/2.0 | 1,440 (0%) | 2mo | $68,000 | $47 | 96 |
| 257 Wolf | 0.23mi | 2/2.0 | 1,440 (0%) | 3mo | $75,000 | $52 | 87 |
| 392 Standing Bear | 0.34mi | 2/2.0 | 1,368 (-5%) | 2mo | $113,000 | $83 | 74 |
| 67 Paseo Laredo North | 0.61mi | 2/2.0 | 1,440 (0%) | 1mo | $55,000 | $38 | 71 |
| 126 Via Valverde | 0.58mi | 2/2.0 | 1,440 (0%) | 2mo | $179,500 | $125 | 71 |
| 153 Estrada Way | 0.62mi | 2/2.0 | 1,440 (0%) | 1mo | $46,500 | $32 | 70 |
| 244 Settles Dr | 0.64mi | 2/2.0 | 1,440 (0%) | 1mo | $135,000 | $94 | 70 |
| 89 Armenia Dr | 0.54mi | 2/2.0 | 1,416 (-2%) | 3mo | $177,000 | $125 | 69 |
| 229 Calle Leandro | 0.75mi | 2/2.0 | 1,440 (0%) | 3mo | $90,000 | $63 | 63 |
| 162 Hilligoss Dr | 0.67mi | 2/2.0 | 1,504 (+4%) | 3mo | $66,000 | $44 | 59 |
| 234 Settles Dr | 0.70mi | 2/2.0 | 1,512 (+5%) | 3mo | $117,000 | $77 | 57 |
| 314 Armenia Dr | 0.51mi | 2/2.0 | 1,647 (+14%) | 3mo | $169,900 | $103 | 50 |
Match score weights: distance 35% · size 25% · config 20% · recency 20%. Top-matched comps best support the ARV.
Projected returns pro-forma
-3.0% appreciation · 3.22% rent growth · sell at horizon
- IRR
- 65.2%
- Equity multiple
- 3.93×
- Total profit
- $77,942
- Equity at exit
- $14,150
- IRR
- 69.6%
- Equity multiple
- 8.14×
- Total profit
- $189,826
- Equity at exit
- $8,205
Cash invested: $26,572 (down + closing). Projections, not guarantees.
Landlord ↔ Tenant lean methodology
- Overall (STATE)
- 18 Strongly Tenant-Friendly
- State California
- 18 Strongly Tenant-Friendly · D+13
- County
- — inherits STATE
- City
- — inherits STATE
ZIP-level market 92234
- Home prices YoY
- -27.7%
- Rents YoY
- 3.2%
- Active inventory
- 525
- Price-to-rent
- 3.0×
Monthly cashflow live
- Estimated rent
- $2,672 high interval (Pro) →
- Mortgage (P&I)
- −$498
- Tax est. 1.5%
- −$119 /mo · $1,424/yr
- Insurance
- −$40
- HOA
- −$0
- Vacancy / Maint / Mgmt
- −$561
- Net cashflow
- $1,455
Break-even live
UW: 25.0% down · 7.5% · 30yr · 1.5% tax · 5.0% vac · 8.0% maint · 8.0% mgmt
Financing live
Cash to close
- Down payment
- $23,725
- Closing costs
- $2,847
- Reserves months
- —
- Total cash needed
- —
Loan-product check · same deal, 3 products live
Conventional
25% down · 7.5% · 30yr
- Down + closing
- —
- Monthly P&I
- —
- Monthly cashflow
- —
- DSCR
- —
- Eligible?
- —
Personal DTI + credit; lowest rate.
DSCR
20% down · 8.5% · 30yr
- Down + closing
- —
- Monthly P&I
- —
- Monthly cashflow
- —
- DSCR
- —
- Eligible?
- —
No personal income docs; deal must DSCR.
Hard money
10% down · 12.0% · 12mo
- Down + closing
- —
- Monthly P&I
- —
- Monthly cashflow
- —
- DSCR
- —
- Eligible?
- —
Short-term bridge; refi at stabilization.
Rent comps 40 comps
| Address | Beds | Baths | Sqft | Rent | $/sqft | DOM | Units | Dist |
|---|---|---|---|---|---|---|---|---|
| 69200 Nilda Dr Cathedral City, CA | 3.0 | 2.0 | 1330 | $2,495 | $1.88 | 22d | 1 | 0.03mi |
| 34750 Marcia Rd Unit 02 Cathedral City, CA | 3.0 | 2.0 | 1325 | $2,000 | $1.51 | 18d | 1 | 0.18mi |
| 68859 Paseo Real Cathedral City, CA | 2.0 | 2.0 | 1406 | $3,960 | $2.82 | 15d | 1 | 0.30mi |
| 68859 Paseo Real Cathedral City, CA | 2.0 | 2.0 | 1406 | $3,960 | $2.82 | 44d | 1 | 0.30mi |
| 35615 Paseo Circulo E Cathedral City, CA | 1.0 | 2.0 | 1029 | $2,250 | $2.19 | 44d | 1 | 0.34mi |
| 69180 Victoria Dr #8 Cathedral City, CA | 3.0 | 2.0 | 1230 | $1,995 | $1.62 | 3d | 1 | 0.37mi |
| 68882 Calle Mula Cathedral City, CA | 2.0 | 2.0 | 1714 | $2,500 | $1.46 | 20d | 1 | 0.43mi |
| 69155 Dinah Shore Dr Cathedral City, CA | 2.0 | 2.0 | 1100 | $1,795 | $1.63 | 44d | 1 | 0.51mi |
| 69155 Dinah Shore Dr Apt 20 Cathedral City, CA | 2.0 | 2.0 | 1200 | $2,050 | $1.71 | 44d | 1 | 0.52mi |
| 36040 Avenida de las Montanas Unit E Cathedral City, CA | 2.0 | 2.0 | 1220 | $3,200 | $2.62 | 44d | 1 | 0.53mi |
| 35200 Cathedral Canyon Dr Unit H64 Cathedral City, CA | 2.0 | 2.0 | 1375 | $2,500 | $1.82 | 44d | 1 | 0.57mi |
| 69603 Heather Way Rancho Mirage, CA | 3.0 | 2.0 | 1218 | $2,300 | $1.89 | 44d | 1 | 0.59mi |
| 152 Estrada Way #152 Cathedral City, CA | 2.0 | 2.0 | 1500 | $2,200 | $1.47 | 44d | 1 | 0.60mi |
| 69646 Antonia Way Rancho Mirage, CA | 2.0 | 2.0 | 966 | $2,450 | $2.54 | 18d | 1 | 0.60mi |
| 159 Estrada Way Cathedral City, CA | 3.0 | 2.0 | 1800 | $2,850 | $1.58 | 44d | 1 | 0.62mi |
| 34361 Denise Way Rancho Mirage, CA | 3.0 | 2.0 | 1400 | $2,800 | $2.00 | 44d | 1 | 0.63mi |
| 35200 Cathedral Canyon Dr Unit B10 Cathedral City, CA | 2.0 | 2.0 | 1384 | $2,600 | $1.88 | 44d | 1 | 0.64mi |
| 68615 Paseo Soria Cathedral City, CA | 2.0 | 2.0 | 1462 | $3,500 | $2.39 | 8d | 1 | 0.64mi |
| 34073 Emily Way Rancho Mirage, CA | 2.0 | 2.0 | 966 | $2,100 | $2.17 | 18d | 1 | 0.70mi |
| 34073 Emily Way Rancho Mirage, CA | 2.0 | 2.0 | 966 | $2,100 | $2.17 | 22d | 1 | 0.70mi |
| 34071 Denise Way Rancho Mirage, CA | 3.0 | 2.0 | 1218 | $2,599 | $2.13 | 24d | 1 | 0.72mi |
| 34197 Calle Mora Cathedral City, CA | 2.0 | 2.0 | 1171 | $2,300 | $1.96 | 22d | 1 | 0.80mi |
| 34197 Calle Mora Cathedral City, CA | 2.0 | 2.0 | 1171 | $2,300 | $1.96 | 13d | 1 | 0.80mi |
| 34197 Calle Mora Cathedral City, CA | 2.0 | 2.0 | 1171 | $2,300 | $1.96 | 10d | 1 | 0.80mi |
| 68368 Calle Leon Cathedral City, CA | 2.0 | 2.0 | 1406 | $3,790 | $2.70 | 44d | 1 | 0.91mi |
| 68368 Calle Leon Cathedral City, CA | 2.0 | 2.0 | 1406 | $3,790 | $2.70 | 15d | 1 | 0.91mi |
| 68153 Lakeland Dr Cathedral City, CA | 2.0 | 2.0 | 1255 | $2,500 | $1.99 | 24d | 1 | 0.92mi |
| 33255 Date Palm Dr Cathedral City, CA | 2.0 | 2.0 | 1050 | $1,795 | $1.71 | 44d | 1 | 0.92mi |
| 250 S Paseo Laredo Cathedral City, CA | 2.0 | 2.0 | 1600 | $1,800 | $1.12 | 12d | 1 | 0.99mi |
| 251 S Paseo Laredo Unit 251 Cathedral City, CA | 1.0 | 2.0 | 1440 | $2,550 | $1.77 | 24d | 1 | 1.01mi |
| 251 S Paseo Laredo Cathedral City, CA | 2.0 | 2.0 | 1440 | $2,400 | $1.67 | 44d | 1 | 1.01mi |
| 33892 Sky Blue Water Trl Cathedral City, CA | 3.0 | 2.0 | 1352 | $2,800 | $2.07 | 4d | 1 | 1.05mi |
| 33495 Cathedral Canyon Dr Cathedral City, CA | 2.0 | 1.0 | 1100 | $2,200 | $2.00 | 44d | 1 | 1.09mi |
| 33495 Cathedral Canyon Dr Unit B Cathedral City, CA | 2.0 | 1.0 | 1100 | $2,100 | $1.91 | 44d | 1 | 1.09mi |
| 35082 Mission Hills Dr Rancho Mirage, CA | 2.0 | 2.5 | 1624 | $3,250 | $2.00 | 12d | 1 | 1.17mi |
| 35090 Mission Hills Dr Rancho Mirage, CA | 2.0 | 2.0 | 1596 | $3,950 | $2.47 | 24d | 1 | 1.17mi |
| 8 Mission Ct Rancho Mirage, CA | 2.0 | 2.0 | 1540 | $2,500 | $1.62 | 18d | 1 | 1.18mi |
| 35054 Mission Hills Dr Rancho Mirage, CA | 2.0 | 2.0 | 1396 | $2,549 | $1.83 | 4d | 1 | 1.19mi |
| 38 Mission Ct Rancho Mirage, CA | 3.0 | 3.0 | 1382 | $3,500 | $2.53 | 44d | 1 | 1.21mi |
| 35 Mission Ct Rancho Mirage, CA | 3.0 | 2.0 | 1382 | $4,125 | $2.98 | 44d | 1 | 1.23mi |
Listing history 8 events
-
2026-06-18days on market $94,900 Active 9 DOM
-
2026-06-17days on market $94,900 Active 8 DOM
-
2026-06-16days on market $94,900 Active 7 DOM
-
2026-06-15days on market $94,900 Active 6 DOM
-
2026-06-13days on market $94,900 Active 4 DOM
-
2026-06-13days on market $94,900 Active 3 DOM
-
2026-06-10remarks 699-char remark
-
2026-06-10$94,900 Active 1 DOM
ⓘ Source: listings_history table (triggers on properties + properties_extension) + one-shot
backfill from property_details.listing_events for pre-trigger history.
Climate risk First Street
- Flood 1/10 Low FEMA zone X · 0% chance over 30 yrs
- Wildfire 4/10 Moderate
- Heat 9/10 Extreme 7 d/yr ≥113°F today · 20 d/yr by 30 yrs out
- Wind 1/10 Low
- Air quality 5/10 Major 6 unhealthy d/yr today · 8 by 30 yrs out
Nearby sold comps map
Loading sold comps map…
Walkable amenities ~0.75 mi
Loading nearby amenities…
Taxation est. · year 1
- Rental income
- $32,067
- − Mortgage interest
- −$5,316
- − Property taxes
- −$1,424
- − Insurance
- −$474
- − Repairs & maintenance
- −$2,565
- − Management
- −$2,565
- − Depreciation
- −$2,761
- Taxable income
- $16,962
- Est. tax owed @ 24.0%
- −$4,071
- After-tax cash flow
- $13,392/yr
For passive investors: Depreciation is non-cash, so a rental often shows a tax loss while cash-flowing — sheltering income. Rental losses are passive: they offset passive income freely, and up to $25,000/yr can offset ordinary (W-2) income if you actively participate and your MAGI is under $100k (phasing out to $0 by $150k); unused losses carry forward. On sale, claimed depreciation is recaptured at up to 25%, and gains may owe capital-gains tax (a 1031 exchange can defer both). Figures are a year-1 estimate at your 24.0% rate — not tax advice; consult a CPA.
Condition & rehab AI · 12 photos
This manufactured home is in fair condition with good systems and flooring. It requires minor repairs and maintenance to improve its curb appeal and value.
Repairs flagged
- Minor exterior lighting — light fixture on front porch is broken
- Minor landscaping — some plants appear overgrown
Value-add opportunities
- Both paint exterior — enhances curb appeal and value
- Both replace broken light fixture — improves safety and aesthetics
Renovation cost estimate screening
| Repair item | Severity | Est. cost |
|---|---|---|
| exterior lighting · light fixture on front porch is broken | Minor | $500–3,000 |
| landscaping · some plants appear overgrown | Minor | $500–3,000 |
| Total estimated repair cost · 2 items | $1,000–6,000 |
Value-add ROI direction
- Both paint exterior — enhances curb appeal and value ↑
- Both replace broken light fixture — improves safety and aesthetics ↑
ⓘ Cost ranges are severity-bucket heuristics (US national rule-of-thumb). Get contractor quotes + a written scope before underwriting a rehab budget.
Schools (NCES district)
- District
- Palm Springs Unified
- NCES district ID
- 0629550
- Math proficiency
- 21% ▼ -7.00%
- Reading proficiency
- 42% ▬ 0.00%
- Median HH income
- $43,638
- Composite
- 26.76/100
- National rank
- #7131
- State rank
- #328 of 517 in CA
Livability — Cathedral City
- Score
- 66/100
- State rank
- #344
- US rank
- #11749
Category grades
Schools grade is shown separately in the Schools card above.
Census & demographics
- Census place
- Cathedral City, CA
- County
- Riverside County · 2,287,001 people
- City population
- 52,267
- Metro
- Riverside-San Bernardino-Ontario, CA
- Population (ZIP)
- 52,267
- Household income
- $73,572
- Rent vs Own
- Severe rent burden
- 1682.0
Population outlook (Riverside County) Hauer SSP2
- Today (2025)
- 2,664,475 people
- By 2030
- 2,802,692 · +5.2%
- By 2040
- 3,050,904 · +14.5%
- By 2050
- 3,256,783 · +22.2%
- By 2075
- 3,655,058 · +37.2%
- By 2100
- 3,766,594 · +41.4%
Race, ethnicity, and origin ACS 2023
- Neighborhood character
- Diverse neighborhood (Simpson 0.56)
- Race & ethnicity
- Hispanic / Latino 59% White 30% Two or more races 27% Asian 6% Native American 2% Black 2%
- Hispanic origin (detail)
- Mexican 51%
- Common ancestry
- Lithuanian 2% Romanian 1% Italian 1%
- Foreign-born
- 28% · Canada, Vietnam
- Languages at home
- 48% English-only · Spanish 46% Tagalog/Filipino 3% Other Asian/Pacific 1%
Political lean MEDSL · Riverside
- 2024 margin
- Toss-up / Even · D 48.0% · R 49.3% · Other 2.6%
- 2008→2024 swing
- -3.6pp toward R · 2008: 2.3pp · 2024: -1.3pp
- All cycles
- 2024: R+1.3 2020: D+8.0 2016: D+4.3 2012: R+0.4 2008: D+2.3
Not yet ingested
- Civics
- —
Market trends
- HPI YoY
- ▼ -136.57%
- Current HPI
- 356.9845
- Rent YoY
- ▲ 3.22%
- Metro
- Riverside-San Bernardino-Ontario, CA
- State GDP YoY
- ▲ 3.21%
- F500 in state
- 116
Industry mix (Fortune 500 HQ in CA)
| Industry | F500 HQs | Revenue |
|---|---|---|
| Technology | 27 | $1,492B |
|
||
| Financial Services | 3 | $174B |
|
||
| Retail | 3 | $44B |
|
||
| Insurance | 3 | $26B |
|
||
| Media / Entertainment | 2 | $115B |
|
||
| Pharmaceuticals / Biotech | 2 | $62B |
|
||
Price history
-9.2% since first listed4 events — show timeline
- 2026-06-08 Listed $94,900 GPSMLS
- 2023-04-25 Sold (MLS) $104,500 GPSMLS
- 2023-03-27 Contingent — GPSMLS
- 2023-02-16 Listed $104,500 GPSMLS
Cash-flow waterfall
monthlySold comps — $/sqft
last 12 mo · ≤1 miLoading sold comps…