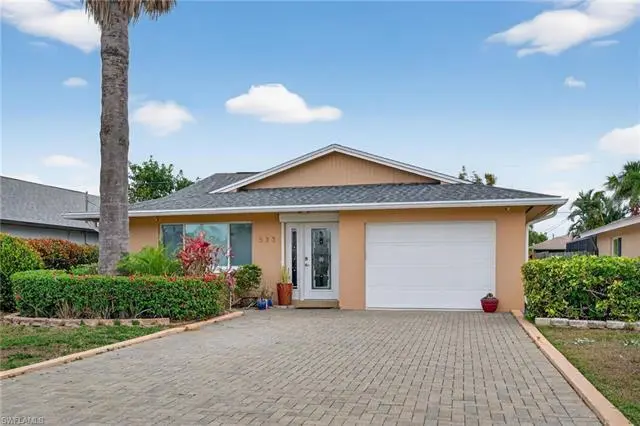
533 98th Ave N · Naples Park, FL
Flood risk 8/10 · Major
- FEMA flood zone
- X (shaded)
- Chance of flooding over 30 yrs
- 0.97%
- Est. flood insurance / yr
- $507 – $1,088
Fire risk 2/10 · Minimal
- Est. fire insurance / yr
- $947 – $1,759
Heat risk 10/10 · Severe
- Hot days now (above 107°F)
- 7 days/yr
- Hot days in 30 yrs
- 31 days/yr
Wind risk 10/10 · Severe
- Chance of severe wind over 30 yrs
- 99.0%
Air-quality risk 2/10 · Minimal
- Unhealthy air days now
- 1 days/yr
- Unhealthy air days in 30 yrs
- 1 days/yr
Risk factors via First Street. Map © Google.
Why this score? — see what drove the D grade
The composite is a weighted blend of 9 inputs, each scored 0–100. Each bar is that input's sub-score; the figure is the points it added to the 100-point composite (weight × sub-score).
- Cash flow +11.8/30.0
- ARV discount +7.5/15.0
- Schools +5.0/10.0
- Rent growth +4.7/5.0
- DSCR +3.5/10.0
- Livability +3.2/5.0
- 1% rule +2.7/10.0
- Condition / age +2.5/5.0
- Appreciation +0.0/10.0
$900,000
🖨 Deal sheet 📄 Offer letter ✓ Due diligence
Listing remarks
BEACH LIVING AT IT'S BEST: SUN-FUN & TOES IN THE SAND! THE MOST COVETED 500 BLOCK of Naples Park and WOW only 15 MINUTE WALK TO NAPLES FAMOUS "VANDERBILT" BEACH! This STUNNING HOME IS A VERY RARE PROPERTY, COMPLETELY REMODELED ($200,000+/-) POOL HOME is a TWO SEPARATE LIVING BUILDINGS with DOUBLE the Income Potential! MAIN HOUSE has a GARAGE & an Attached STUDIO APARTMENT w/ a Private Entrance (Grandfathered in). MAIN HOUSE: LIGHT-BRIGHT & SUNNY ALL YEAR ROUND and with an open floor plan the Great Room is Perfect for Entertaining Family & friends. There are 2 Owner's Suites w/ En-suite Bathrooms & a 3rd Bedroom w/ Half Bathroom & PRIVATE COURTYA
Key facts
- Newer ac
- Custom lap pool
- Newer roof
Tags
Property features AI
Finance
- Other: Property located in Naples Park development; Lot is regular and landscaped with pool/club view; Central irrigation system; County-maintained paved public road access
- HOA & community: Non-gated community; No HOA maintenance; No community amenities
Exterior
- Parking: Paved driveway with more than 2 parking spaces; Attached 1-car garage
- Security: Impact resistant doors; Impact resistant windows; Electric shutters
- Utilities: Central water; Central sewer; Cable available
- Home design: Residential single-family home; One-story (ranch) design; Rear exposure faces north
- Construction: Concrete block construction; Shingle roof; Built in 1985
- Exterior features: Deck; Fence; Automatic sprinkler system; Above-ground spa; In-ground heated pool (electric); Stucco exterior
Interior
- Kitchen: Cooktop (electric); Range; Dishwasher; Microwave; Refrigerator/freezer; Refrigerator with icemaker
- Bedrooms: 4 bedrooms; First-floor bedroom; Master bedroom on ground level; Two master suites; Split bedrooms
- Flooring: Tile flooring
- Bathrooms: 3 full bathrooms; 1 half bathroom; Master baths include tub/shower combos and separate showers
- Heating & cooling: Central electric heat; Central electric air conditioning; Ceiling fans
- Interior features: Built-in cabinets; Cable prewire; High-speed internet available; Pull-down attic stairs; Smoke detectors; Vaulted ceilings; Window coverings; Attached apartment/guest suite; Great room; Guest bath; Guest room; Screened lanai/porch; Breakfast bar; Dining (family); Eat-in kitchen; Partially furnished; Efficiency floor plan; Split bedroom layout
- Laundry & utility: Washer; Dryer; Laundry in residence
Neighborhood map
What this means for you Summary
Snapshot
- This is a 4-bed/3.5-bath other listed at $900k.
Deal economics
- At list price, monthly cash flow is $-319 ($-4k/yr) — negative.
- To cash-flow at today's rent, offer at most $844k (6.3% below list).
- To meet the 1% rule (rent ≥ 1% of price), the offer needs to be $695k (22.8% below list).
- Recommended offer: $695k (22.8% below list) — sets the bar for 1% rule.
Location & tenants
- Location reads 64/100 on livability (#696 in FL) — a middle-class / working-renter tenant base. Strengths: crime A+, housing A-, employment B+; Watch: health & safety D, schools F, amenities F.
- Collier (suburban): math 60% / reading 56% proficiency, ranked #16 of 73 in FL (top 22%) — acceptable for families but not a draw, mixed tenant base, ~2y average lease.
- Market conditions: Rents rising fast (+8.7%/yr); 679 active listings in the ZIP; 40 comparable units currently listed for rent nearby; rentals at typical pace (median 24d on market — plan ~3-4 weeks tenant-placement turnaround); high-income renter base; 3,520 units permitted in Collier County in 2024 (959 in 5+ unit buildings).
- At $6,948/mo this rent would consume 70% of the median local household income ($119k/yr) (locally 237% of renters already pay >50% of income on rent) — very limited rent-growth headroom before tenants either downsize or default.
Forward outlook
- Local home prices are declining (-3.0%/yr); year-one equity from $6k of loan paydown is wiped out by about $27k of value loss. Plan a longer hold.
- Collier County population projected at +30% by 2050 — long-run rental-demand tailwind backs the buy-and-hold thesis.
Negotiation context
- It's been on market 70 days — a 6% lower offer ($846k) is reasonable based on typical stale-listing flexibility.
- 7 sale attempts since 17y ago with the ask held roughly flat each time — persistent listings suggest the price (not the market) is what's stuck; bring a comps-based counter.
- Current owner paid $570k; list at $900k implies a 58% gain — meaningful room to come down on a strong offer.
Risks & watch-outs
- Watch-outs: flood insurance adds $66/mo.
- Climate carrying-cost: severe flood risk; severe wind risk, 99% chance of damaging wind over 30y; extreme-heat days projected 7→31/yr by 2055 (HVAC capex compounding) — expect insurance premiums to compound above CPI over the hold.
Questions for the listing agent
- What do current leases actually rent for vs. the listed asking? Can we see a recent rent roll and the last 12 months of T-12 income?
- It's been on market 70 days. Have you received any prior offers? Is the seller open to a 23% concession, seller financing, or rate buy-down credit?
- What's the actual annual flood-insurance premium (NFIP or private), and is the property in a SFHA with mandatory coverage?
- Why hasn't it sold? Are there any deal-killer items the seller is aware of (foundation, flood, title, zoning, code violations)?
- Is there a deadline driving the sale (1031 exchange, divorce, estate, relocation)? That informs how much negotiation room exists.
- Schools are F-rated, which usually means shorter tenancies and higher turnover. Who's the typical renter profile here, and what's been the actual vacancy rate?
- The area grade is low — what's the realistic commute time and amenity access for the typical tenant pool here? Any planned neighborhood developments (good or bad) we should know about?
- What's the average days-on-market for RENTAL listings here right now (not sales)? A rising rental-DOM trend means longer vacancies and softer asking-rent achievability than the comps imply.
- What's the recent tenant-quality profile in this submarket — average credit score on applications, eviction rate, late-payment / NSF rate, and stable-employment percentage? A property-management company in the area should have these aggregated.
- How much new for-sale + rental construction is in the pipeline within 1–3 miles? Heavy new supply typically softens prices + rents 12–24 months out; constrained supply supports both.
Investment metrics
- 1% rule
- 0.77% ✗
- Cap rate
- 5.96%
- Cash-on-cash
- -1.20%
- DSCR
- 0.95
- GRM
- 10.8
CMA / ARV
No comps found within radius.
Projected returns pro-forma
-3.0% appreciation · 8.0% rent growth · sell at horizon
- IRR
- -13.7%
- Equity multiple
- 0.49×
- Total profit
- $-129,579
- Equity at exit
- $134,193
- IRR
- 1.3%
- Equity multiple
- 1.11×
- Total profit
- $27,530
- Equity at exit
- $77,816
Cash invested: $252,000 (down + closing). Projections, not guarantees.
Landlord ↔ Tenant lean methodology
- Overall (STATE)
- 87 Strongly Landlord-Friendly
- State Florida
- 87 Strongly Landlord-Friendly · R+3
- County
- — inherits STATE
- City
- — inherits STATE
ZIP-level market 34108
- Rents YoY
- 8.7%
- Active inventory
- 679
- Price-to-rent
- 10.8×
Monthly cashflow live
- Estimated rent
- $6,948 medium interval (Pro) →
- Mortgage (P&I)
- −$4,720
- Tax from tax record
- −$647 /mo · $7,759/yr
- Insurance
- −$375
- Flood insurance flood zone
- −$66 /mo · $798/yr
- HOA
- −$0
- Vacancy / Maint / Mgmt
- −$1,459
- Net cashflow
- $-319
Break-even live
UW: 25.0% down · 7.5% · 30yr · 1.5% tax · 5.0% vac · 8.0% maint · 8.0% mgmt
Financing live
Cash to close
- Down payment
- $225,000
- Closing costs
- $27,000
- Reserves months
- —
- Total cash needed
- —
Loan-product check · same deal, 3 products live
Conventional
25% down · 7.5% · 30yr
- Down + closing
- —
- Monthly P&I
- —
- Monthly cashflow
- —
- DSCR
- —
- Eligible?
- —
Personal DTI + credit; lowest rate.
DSCR
20% down · 8.5% · 30yr
- Down + closing
- —
- Monthly P&I
- —
- Monthly cashflow
- —
- DSCR
- —
- Eligible?
- —
No personal income docs; deal must DSCR.
Hard money
10% down · 12.0% · 12mo
- Down + closing
- —
- Monthly P&I
- —
- Monthly cashflow
- —
- DSCR
- —
- Eligible?
- —
Short-term bridge; refi at stabilization.
Rent comps 40 comps
| Address | Beds | Baths | Sqft | Rent | $/sqft | DOM | Units | Dist |
|---|---|---|---|---|---|---|---|---|
| 517 98th Ave N Naples, FL | 3.0 | 2.0 | 1350 | $4,750 | $3.52 | 23d | 1 | 0.02mi |
| 551 97th Ave N Naples, FL | 4.0 | 3.0 | 2090 | $20,000 | $9.57 | 14d | 1 | 0.09mi |
| 470 Lagoon Ave Naples, FL | 3.0 | 3.0 | 2038 | $10,000 | $4.91 | 14d | 1 | 0.11mi |
| 552 97th Ave N Naples, FL | 3.0 | 2.0 | 1612 | $3,890 | $2.41 | 23d | 1 | 0.12mi |
| 482 Trade Winds Ave Naples, FL | 4.0 | 3.0 | 2467 | $19,500 | $7.90 | 23d | 1 | 0.13mi |
| 513 96th Ave N Naples, FL | 3.0 | 2.0 | 1770 | $15,000 | $8.47 | 23d | 1 | 0.13mi |
| 455 Bayside Ave Naples, FL | 3.0 | 3.0 | 2150 | $5,500 | $2.56 | 23d | 1 | 0.14mi |
| 598 100th Ave N Naples, FL | 3.0 | 2.0 | 2018 | $5,884 | $2.92 | 23d | 1 | 0.17mi |
| 562 96th Ave N Unit 1534821P Naples, FL | 3.0 | 2.0 | 1819 | $9,869 | $5.43 | 23d | 1 | 0.18mi |
| 575 101st Ave N Naples, FL | 4.0 | 2.0 | 1800 | $12,500 | $6.94 | 23d | 1 | 0.21mi |
| 521 102nd Ave N Naples, FL | 3.0 | 2.0 | 1432 | $5,000 | $3.49 | 14d | 1 | 0.25mi |
| 625 97th Ave N Naples, FL | 3.0 | 2.0 | 1496 | $3,800 | $2.54 | 23d | 1 | 0.25mi |
| 532 103rd Ave N Naples, FL | 3.0 | 2.0 | 1326 | $8,000 | $6.03 | 23d | 1 | 0.27mi |
| 523 103rd Ave N Naples, FL | 4.0 | 2.5 | 1974 | $5,200 | $2.63 | 23d | 1 | 0.30mi |
| 660 100th Ave N Unit 1404250P Naples, FL | 3.0 | 2.0 | 1571 | $6,068 | $3.86 | 14d | 1 | 0.33mi |
| 630 95th Ave N Unit A Naples, FL | 3.0 | 2.0 | 1411 | $2,995 | $2.12 | 23d | 1 | 0.34mi |
| 630 95th Ave N Unit S Naples, FL | 3.0 | 2.0 | 1411 | $5,500 | $3.90 | 23d | 1 | 0.34mi |
| 648 96th Ave N Naples, FL | 3.0 | 2.0 | 1768 | $12,000 | $6.79 | 23d | 1 | 0.34mi |
| 670 101st Ave N Naples, FL | 4.0 | 3.0 | 2208 | $15,000 | $6.79 | 23d | 1 | 0.37mi |
| 684 98th Ave N Naples, FL | 3.0 | 2.0 | 1702 | $4,500 | $2.64 | 14d | 1 | 0.38mi |
| 552 105th Ave N Naples, FL | 3.0 | 2.0 | 1614 | $7,500 | $4.65 | 23d | 1 | 0.39mi |
| 637 103rd Ave N Naples, FL | 3.0 | 2.0 | 1669 | $3,100 | $1.86 | 23d | 1 | 0.40mi |
| 572 105th Ave N Naples, FL | 3.0 | 2.0 | 1485 | $9,250 | $6.23 | 23d | 1 | 0.40mi |
| 690 100th Ave N Naples, FL | 3.0 | 2.0 | 1800 | $12,500 | $6.94 | 23d | 1 | 0.40mi |
| 645 103rd Ave N Unit 1534775P Naples, FL | 4.0 | 2.0 | 1840 | $8,513 | $4.63 | 21d | 1 | 0.41mi |
| 671 94th Ave N Naples, FL | 3.0 | 2.0 | 1464 | $6,800 | $4.64 | 23d | 1 | 0.43mi |
| 682 95th Ave N Naples, FL | 3.0 | 2.0 | 1600 | $12,500 | $7.81 | 23d | 1 | 0.44mi |
| 551 91st Ave N Unit 1504170P Naples, FL | 4.0 | 2.0 | 1679 | $8,133 | $4.84 | 23d | 1 | 0.45mi |
| 691 102nd Ave N Naples, FL | 3.0 | 2.0 | 1311 | $7,000 | $5.34 | 23d | 1 | 0.45mi |
| 630 105th Ave N Naples, FL | 4.0 | 2.0 | 2119 | $3,950 | $1.86 | 23d | 1 | 0.46mi |
| 510 106th Ave N Unit 1387169P Naples, FL | 4.0 | 2.0 | 1646 | $7,553 | $4.59 | 14d | 1 | 0.46mi |
| 650 93rd Ave N Unit 1073498P Naples, FL | 3.0 | 2.0 | 1442 | $5,136 | $3.56 | 14d | 1 | 0.46mi |
| 450 Launch Cir #602 Naples, FL | 3.0 | 2.0 | 1480 | $14,000 | $9.46 | 23d | 1 | 0.49mi |
| 450 Launch Cir #404 Naples, FL | 3.0 | 2.0 | 1635 | $3,000 | $1.83 | 23d | 1 | 0.49mi |
| 410 Flagship Dr #806 Naples, FL | 3.0 | 2.5 | 1979 | $15,400 | $7.78 | 23d | 1 | 0.49mi |
| 410 Flagship Dr #1104 Naples, FL | 3.0 | 3.5 | 2320 | $18,000 | $7.76 | 23d | 1 | 0.49mi |
| 410 Flagship Dr #605 Naples, FL | 3.0 | 3.0 | 1860 | $16,000 | $8.60 | 23d | 1 | 0.49mi |
| 410 Flagship Dr #1105 Naples, FL | 3.0 | 3.0 | 1860 | $15,000 | $8.06 | 23d | 1 | 0.49mi |
| 410 Flagship Dr #505 Naples, FL | 3.0 | 3.0 | 1860 | $4,000 | $2.15 | 23d | 1 | 0.49mi |
| 410 Flagship Dr #1101 Naples, FL | 3.0 | 2.5 | 1979 | $12,000 | $6.06 | 23d | 1 | 0.49mi |
Listing history 39 events
-
2026-06-18days on market $900,000 Active 70 DOM
-
2026-06-17days on market $900,000 Active 69 DOM
-
2026-06-16days on market $900,000 Active 68 DOM
-
2026-06-15days on market $900,000 Active 67 DOM
-
2026-06-14days on market $900,000 Active 65 DOM
-
2026-06-10days on market $900,000 Active 62 DOM
-
2026-06-09days on market $900,000 Active 61 DOM
-
2026-06-08days on market $900,000 Active 60 DOM
-
2026-06-07days on market $900,000 Active 59 DOM
-
2026-06-03days on market $900,000 Active 55 DOM
-
2026-06-02days on market $900,000 Active 54 DOM
-
2026-06-01days on market $900,000 Active 53 DOM
-
2026-05-31days on market $900,000 Active 52 DOM
-
2026-05-30days on market $900,000 Active 51 DOM
-
2026-04-09$900,000 Active
-
2025-12-01historical
-
2025-10-28price $900,000
-
2025-09-30price $950,000
-
2025-09-10$1,000,000 Active
-
2025-04-08historical
-
2025-03-07price $1,100,000
-
2025-01-09$1,150,000 Active
-
2018-12-04soldstatus $570,000
-
2018-11-20soldstatus $570,000 Sold
-
2018-10-11status Pending With Contingencies
-
2018-10-08$599,900 Active
-
2018-05-07historical
-
2018-03-05$625,000 Active
-
2017-11-20soldstatus $465,000
-
2017-10-04price $540,000
-
2014-06-06soldstatus $367,000
-
2014-06-05soldstatus $367,000
-
2014-06-05price $379,000
-
2014-03-07$367,000
-
2009-08-21soldstatus $233,000
-
2009-08-20soldstatus $233,000
-
2009-01-27$225,000
-
2005-07-18soldstatus $419,000
-
1986-08-01soldstatus $80,000
ⓘ Source: listings_history table (triggers on properties + properties_extension) + one-shot
backfill from property_details.listing_events for pre-trigger history.
Tax reassessment forecast FL · Resets to sale price
- Current annual tax
- $7,759 · $647/mo
- Projected year-2 tax
- $7,759 · $647/mo
- Expected delta
- $0/yr ($0/mo · 0.0%)
ⓘ Screening estimate from a state-policy table — verify with the county assessor before closing.
Climate risk First Street
- Flood 8/10 Severe FEMA zone X (shaded) · 97% chance over 30 yrs
- Wildfire 2/10 Low
- Heat 10/10 Extreme 7 d/yr ≥107°F today · 31 d/yr by 30 yrs out
- Wind 10/10 Extreme 99% chance of damaging wind over 30 yrs
- Air quality 2/10 Low 1 unhealthy d/yr today · 1 by 30 yrs out
Nearby sold comps map
Loading sold comps map…
Walkable amenities ~0.75 mi
Loading nearby amenities…
Taxation est. · year 1
- Rental income
- $83,375
- − Mortgage interest
- −$50,414
- − Property taxes
- −$7,759
- − Insurance
- −$5,298
- − Repairs & maintenance
- −$6,670
- − Management
- −$6,670
- − Depreciation
- −$26,182
- Taxable loss
- −$19,617
- Est. tax savings @ 24.0%
- +$4,708
- After-tax cash flow
- $882/yr
For passive investors: Depreciation is non-cash, so a rental often shows a tax loss while cash-flowing — sheltering income. Rental losses are passive: they offset passive income freely, and up to $25,000/yr can offset ordinary (W-2) income if you actively participate and your MAGI is under $100k (phasing out to $0 by $150k); unused losses carry forward. On sale, claimed depreciation is recaptured at up to 25%, and gains may owe capital-gains tax (a 1031 exchange can defer both). Figures are a year-1 estimate at your 24.0% rate — not tax advice; consult a CPA.
Schools (NCES district)
- District
- Collier
- NCES district ID
- 1200330
- Math proficiency
- 60% ▼ -4.00%
- Reading proficiency
- 56% ▼ -2.00%
- Median HH income
- $58,275
- Composite
- 50.23/100
- National rank
- #1892
- State rank
- #16 of 73 in FL
Livability — Naples Park
- Score
- 64/100
- State rank
- #696
- US rank
- #14564
Category grades
Schools grade is shown separately in the Schools card above.
Census & demographics
- Census place
- Naples Park, FL
- County
- Collier County · 396,295 people
- Metro
- Naples-Marco Island, FL
- Population (ZIP)
- 16,237
- Household income
- $119,212
- Rent vs Own
- Severe rent burden
- 237.0
Population outlook (Collier County) Hauer SSP2
- Today (2025)
- 420,858 people
- By 2030
- 450,054 · +6.9%
- By 2040
- 502,232 · +19.3%
- By 2050
- 544,932 · +29.5%
- By 2075
- 627,203 · +49.0%
- By 2100
- 659,015 · +56.6%
Race, ethnicity, and origin ACS 2023
- Neighborhood character
- Predominantly White (87%)
- Race & ethnicity
- White 87% Hispanic / Latino 8% Two or more races 7% Asian 1% Black 1%
- Hispanic origin (detail)
- Mexican 2% Cuban 3%
- Common ancestry
- Romanian 5% Lithuanian 3% Slovak 3%
- Foreign-born
- 16% · Canada, Dominican Republic, South Korea
- Languages at home
- 86% English-only · Spanish 6% Russian/Polish/Slavic 2% Other Indo-European 2%
Political lean MEDSL · Collier
- 2024 margin
- Solid R (+33.1) · D 33.1% · R 66.2%
- 2008→2024 swing
- -10.6pp toward R · 2008: -22.5pp · 2024: -33.1pp
- All cycles
- 2024: R+33.1 2020: R+24.7 2016: R+26.0 2012: R+30.1 2008: R+22.5
Not yet ingested
- Civics
- —
Market trends
- HPI YoY
- ▼ -587.97%
- Current HPI
- 275.1872
- Rent YoY
- ▲ 8.74%
- Metro
- Naples-Marco Island, FL
- State GDP YoY
- ▲ 3.28%
- F500 in state
- 36
Industry mix (Fortune 500 HQ in FL)
| Industry | F500 HQs | Revenue |
|---|---|---|
| Industrial Technology | 2 | $29B |
|
||
| Insurance | 2 | $17B |
|
||
| Retail | 1 | $60B |
|
||
| Technology Distribution | 1 | $58B |
|
||
| Homebuilding | 1 | $35B |
|
||
| Technology Manufacturing | 1 | $35B |
|
||
Price history
+1025.0% since first listed25 events — show timeline
- 2026-04-09 Listed $900,000 NAPLESMLS
- 2025-12-01 Listing Removed — FORTMLS
- 2025-10-28 Price Changed $900,000 FORTMLS
- 2025-09-30 Price Changed $950,000 FORTMLS
- 2025-09-10 Listed $1,000,000 FORTMLS
- 2025-04-08 Listing Removed — FORTMLS
- 2025-03-07 Price Changed $1,100,000 FORTMLS
- 2025-01-09 Listed $1,150,000 FORTMLS
- 2018-12-04 Sold (Public Records) $570,000 Public Records
- 2018-11-20 Sold (MLS) $570,000 FORTMLS
- 2018-10-11 Pending — FORTMLS
- 2018-10-08 Listed $599,900 FORTMLS
- 2018-05-07 Listing Removed — FORTMLS
- 2018-03-05 Listed $625,000 FORTMLS
- 2017-11-20 Sold (Public Records) $465,000 Public Records
- 2017-10-04 Price Changed $540,000 BEARMLS
- 2014-06-06 Sold (Public Records) $367,000 Public Records
- 2014-06-05 Price Changed $379,000 NAPLESMLS
- 2014-06-05 Sold (MLS) $367,000 NAPLESMLS
- 2014-03-07 Listed $367,000 NAPLESMLS
- 2009-08-21 Sold (Public Records) $233,000 Public Records
- 2009-08-20 Sold (MLS) $233,000 NAPLESMLS
- 2009-01-27 Listed $225,000 NAPLESMLS
- 2005-07-18 Sold (Public Records) $419,000 Public Records
- 1986-08-01 Sold (Public Records) $80,000 Public Records
Property tax history
+11.0%/yrLatest (2025): $7,759 · -3.3% YoY. Source: county tax records.
Cash-flow waterfall
monthlySold comps — $/sqft
last 12 mo · ≤1 miLoading sold comps…