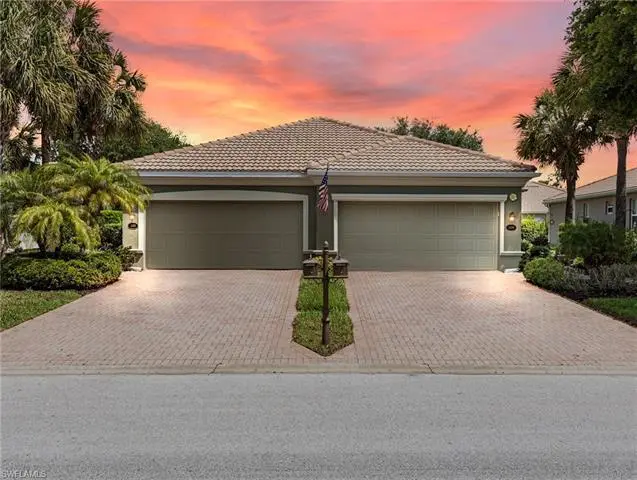
21393 Bella Terra Blvd · Estero, FL
Flood risk 1/10 · Minimal
- FEMA flood zone
- X (unshaded)
- Chance of flooding over 30 yrs
- 0.0%
- Est. flood insurance / yr
- $507 – $1,088
Fire risk 7/10 · Major
- Est. fire insurance / yr
- $947 – $1,759
Heat risk 9/10 · Severe
- Hot days now (above 107°F)
- 7 days/yr
- Hot days in 30 yrs
- 30 days/yr
Wind risk 10/10 · Severe
- Chance of severe wind over 30 yrs
- 99.0%
Air-quality risk 2/10 · Minimal
- Unhealthy air days now
- 2 days/yr
- Unhealthy air days in 30 yrs
- 2 days/yr
Risk factors via First Street. Map © Google.
Why this score? — see what drove the D grade
The composite is a weighted blend of 9 inputs, each scored 0–100. Each bar is that input's sub-score; the figure is the points it added to the 100-point composite (weight × sub-score).
- Cash flow +12.6/30.0
- ARV discount +7.7/15.0
- 1% rule +5.1/10.0
- Schools +4.1/10.0
- Livability +4.0/5.0
- Condition / age +4.0/5.0
- DSCR +3.7/10.0
- Rent growth +2.1/5.0
- Appreciation +0.0/10.0
$369,500
🖨 Deal sheet (PDF) 📄 Offer letter ✓ Due diligence
Listing remarks
Semi-attached villa with an extended lanai and tranquil nature views in both the front and back! Thoughtfully upgraded, this home features 3 bedrooms plus a versatile flex room ideal as a den, sitting room, or formal dining, 2 bathrooms, and an open concept layout with nearly 1,500 sq. ft. of living space. The updated kitchen offers white wood cabinetry, granite countertops, and upgraded appliances and neutral custom laminate flooring run throughout the home. Additional highlights include updated fans and lighting, bright white interior walls, and an expanded lanai that’s perfect for outdoor entertaining. An inviting option for those seeking a comfortable full-time residence or a sun
Key facts
- Nature views
- Flex room
- Updated kitchen
Tags
Property features AI
Finance
- Other: Zoning: RPD; Lot described as regular with total area 2119 (source: Property Appraiser Office); Restrictions include architectural controls, deeded restrictions, no commercial use, no RVs; Subdivision/association: BELLA TERRA (Sub condo E4)
- HOA & community: Mandatory HOA; HOA fee $751 quarterly; Master HOA fee $573 quarterly; One-time mandatory club fee of $1,500; One-time other fee of $3,695; Total annual recurring fees $5,296; Total one-time fees $5,585; Professional management; HOA maintenance covers cable, irrigation water, lawn/land maintenance, pest control (exterior), recreation facilities, reserves, security, street lights, street maintenance, and legal/accounting/manager services; Community amenities include clubhouse, community pool and spa, exercise room, tennis, pickleball, basketball, bocce, volleyball, play area, bike and jog paths
Exterior
- Parking: Attached 2-car garage; Deeded parking with 2+ spaces
- Security: Gated community; Community security included in HOA maintenance
- Utilities: Central water; Central sewer; Cable available
- Home design: Attached villa in a community (Villa Attached); 1-story / ranch style; Rear exposure faces northwest; Residential property in BELLA TERRA development
- Construction: Concrete block construction; Built in 2009; Stucco exterior; Tile roof; 1 story
- Exterior features: Private road; Automatic irrigation/sprinkler; Shutters for storm protection; Stucco exterior; Tile roof; Single-hung and sliding windows; Preserve view
Interior
- Kitchen: Range; Microwave; Dishwasher; Disposal; Refrigerator; Pantry
- Bedrooms: 3 bedrooms plus a den; Split bedroom layout
- Flooring: Laminate flooring
- Bathrooms: 2 full bathrooms; Master bath with dual sinks and shower (no tub)
- Heating & cooling: Central electric heat; Central electric air conditioning; Ceiling fans
- Interior features: Bar; Cable pre-wiring; Foyer; High-speed internet available; Pantry; Volume ceilings; Window coverings; Breakfast bar and dining (family); Great room floor plan; Den (study); Family room; Guest room; Guest bath; Screened lanai/porch
- Laundry & utility: Washer and dryer in residence; Auto garage door; Smoke detector
Neighborhood map
What this means for you Summary
Snapshot
- This is a 3-bed/2.0-bath single-family listed at $370k. Condition is rated good.
Deal economics
- At list price, monthly cash flow is $-49 ($-592/yr) — negative.
- To cash-flow at today's rent, offer at most $362k (1.9% below list).
- Meets the 1% rule at list price ($4k rent vs $370k).
- Recommended offer: $362k (1.9% below list) — sets the bar for cash-flow.
- Cap rate 6.1% vs local median 3.4% in Estero — top-decile yield for the area; either an underpriced asset or a hidden risk that comps aren't pricing in. Stress-test before assuming the spread holds.
Location & tenants
- Location reads 79/100 on livability (#149 in FL, #2,242 nationally) — a middle-class / working-renter tenant base. Strengths: crime A+, employment A+, housing A+; Watch: amenities F, commute F, cost of living D-.
- Lee (suburban): math 47% / reading 50% proficiency, ranked #42 of 73 in FL (top 58%) — families likely to look elsewhere, expect single-tenant / working-renter base with shorter leases.
- Zoned schools: Pinewoods Elementary School (math 81% / reading 74%, grade A, #163 of 2,144 statewide, top 8%, 1,089 students, 25% FRL); Lexington Middle School (math 55% / reading 54%, grade B-, #183 of 571 statewide, top 34%, 1,138 students, 44% FRL); South Fort Myers High School (math 23% / reading 30%, grade F, #489 of 667 statewide, top 74%, 1,917 students, 50% FRL) — zoned schools average 39% FRL vs 57% district-wide (18 pts lower); this property's tenant base skews higher-income than the district average.
- Market conditions: Rents soft (-1.4%/yr); 674 active listings in the ZIP; 2 comparable units currently listed for rent nearby; solid renter incomes; 15,411 units permitted in Lee County in 2024 (4,686 in 5+ unit buildings).
- This rent runs 44% of the median local income ($103k/yr) — at the standard rent-burdened threshold; future hikes will face affordability resistance.
Forward outlook
- Local home prices are declining (-3.0%/yr); year-one equity from $3k of loan paydown is wiped out by about $11k of value loss. Plan a longer hold.
- Lee County population projected at +44% by 2050 — long-run rental-demand tailwind backs the buy-and-hold thesis.
Negotiation context
- It's been on market 15 days — a 2% lower offer ($364k) is reasonable based on typical stale-listing flexibility.
Risks & watch-outs
- Climate carrying-cost: severe wind risk, 99% chance of damaging wind over 30y; major wildfire risk; extreme-heat days projected 7→30/yr by 2055 (HVAC capex compounding) — expect insurance premiums to compound above CPI over the hold.
Questions for the listing agent
- What do current leases actually rent for vs. the listed asking? Can we see a recent rent roll and the last 12 months of T-12 income?
- What does the HOA fee cover, when was the last increase, and are there any pending special assessments or reserve-fund shortfalls?
- Is there a deadline driving the sale (1031 exchange, divorce, estate, relocation)? That informs how much negotiation room exists.
- Schools are A-rated — typically a magnet for longer-tenancy family renters. What's the average tenant stay here, and is there a school-zone premium baked into asking?
- The area grade is low — what's the realistic commute time and amenity access for the typical tenant pool here? Any planned neighborhood developments (good or bad) we should know about?
- What's the average days-on-market for RENTAL listings here right now (not sales)? A rising rental-DOM trend means longer vacancies and softer asking-rent achievability than the comps imply.
- What's the recent tenant-quality profile in this submarket — average credit score on applications, eviction rate, late-payment / NSF rate, and stable-employment percentage? A property-management company in the area should have these aggregated.
- How much new for-sale + rental construction is in the pipeline within 1–3 miles? Heavy new supply typically softens prices + rents 12–24 months out; constrained supply supports both.
Investment metrics
- 1% rule
- 1.01% ✓
- Cap rate
- 6.13%
- Cash-on-cash
- -0.57%
- DSCR
- 0.97
- GRM
- 8.3
CMA / ARV
- ARV (on-the-fly)
- $371,254
- Comps found
- 2
Show comp detail 2 sales within ~0.75 mi
| Address | Dist | Beds/Ba | Sqft | Sold | Price | $/sf | Match |
|---|---|---|---|---|---|---|---|
| 21298 Bella Terra Blvd | 0.17mi | 2/2.0 (-1) | 1,564 (+10%) | 2mo | $345,000 | $221 | 68 |
| 13277 Boccala Ln | 0.17mi | 2/2.0 (-1) | 1,564 (+10%) | 15mo | $410,000 | $262 | 57 |
Match score weights: distance 35% · size 25% · config 20% · recency 20%. Top-matched comps best support the ARV.
Projected returns pro-forma
-3.0% appreciation · 0.0% rent growth · sell at horizon
- IRR
- -21.2%
- Equity multiple
- 0.29×
- Total profit
- $-73,617
- Equity at exit
- $55,094
- IRR
- -26.1%
- Equity multiple
- -0.05×
- Total profit
- $-109,046
- Equity at exit
- $31,948
Cash invested: $103,460 (down + closing). Projections, not guarantees.
Landlord ↔ Tenant lean methodology
- Overall (STATE)
- 87 Strongly Landlord-Friendly
- State Florida
- 87 Strongly Landlord-Friendly · R+3
- County
- — inherits STATE
- City
- — inherits STATE
ZIP-level market 33928
- Rents YoY
- -1.4%
- Active inventory
- 674
- Price-to-rent
- 8.3×
Monthly cashflow live
- Estimated rent
- $3,728 medium interval (Pro) →
- Mortgage (P&I)
- −$1,938
- Tax est. 1.5%
- −$462 /mo · $5,542/yr
- Insurance
- −$154
- HOA
- −$441
- Vacancy / Maint / Mgmt
- −$783
- Net cashflow
- $-49
Break-even live
Sensitivity live
| Price | -10% $206 | -5% $78 | +0% $-49 | +5% $-177 | +10% $-305 |
|---|---|---|---|---|---|
| Rent | -10% $-344 | -5% $-197 | +0% $-49 | +5% $98 | +10% $245 |
| Rate | -1.0pp $137 | -0.5pp $45 | base $-49 | +0.5pp $-145 | +1.0pp $-243 |
UW: 25.0% down · 7.5% · 30yr · 1.5% tax · 5.0% vac · 8.0% maint · 8.0% mgmt
Financing live
Cash to close
- Down payment
- $92,375
- Closing costs
- $11,085
- Reserves months
- —
- Total cash needed
- —
Loan-product check · same deal, 3 products live
Conventional
25% down · 7.5% · 30yr
- Down + closing
- —
- Monthly P&I
- —
- Monthly cashflow
- —
- DSCR
- —
- Eligible?
- —
Personal DTI + credit; lowest rate.
DSCR
20% down · 8.5% · 30yr
- Down + closing
- —
- Monthly P&I
- —
- Monthly cashflow
- —
- DSCR
- —
- Eligible?
- —
No personal income docs; deal must DSCR.
Hard money
10% down · 12.0% · 12mo
- Down + closing
- —
- Monthly P&I
- —
- Monthly cashflow
- —
- DSCR
- —
- Eligible?
- —
Short-term bridge; refi at stabilization.
Rent comps 2 comps
| Address | Beds | Baths | Sqft | Rent | $/sqft | DOM | Units | Dist |
|---|---|---|---|---|---|---|---|---|
| 13672 Troia Dr Estero, FL | 2.0 | 2.0 | 1669 | $5,200 | $3.12 | 25d | 1 | 1.00mi |
| 20552 Ardore Ln Estero, FL | 3.0 | 2.0 | 1705 | $3,000 | $1.76 | 25d | 1 | 1.09mi |
HOA detail
- Monthly dues
- $441 · $5,292/yr
Listing history 7 events
-
2026-06-08status $369,500 Pending 15 DOM
-
2026-06-07days on market $369,500 Active 15 DOM
-
2026-06-03days on market $369,500 Active 11 DOM
-
2026-06-02days on market $369,500 Active 10 DOM
-
2026-06-01days on market $369,500 Active 9 DOM
-
2026-05-31days on market $369,500 Active 8 DOM
-
2026-05-23$369,500 Active
ⓘ Source: listings_history table (triggers on properties + properties_extension) + one-shot
backfill from property_details.listing_events for pre-trigger history.
Climate risk First Street
- Flood 1/10 Low FEMA zone X (unshaded) · 0% chance over 30 yrs
- Wildfire 7/10 Severe
- Heat 9/10 Extreme 7 d/yr ≥107°F today · 30 d/yr by 30 yrs out
- Wind 10/10 Extreme 99% chance of damaging wind over 30 yrs
- Air quality 2/10 Low 2 unhealthy d/yr today · 2 by 30 yrs out
Nearby sold comps map
Loading sold comps map…
Walkable amenities ~0.75 mi
Loading nearby amenities…
Taxation est. · year 1
- Rental income
- $44,737
- − Mortgage interest
- −$20,698
- − Property taxes
- −$5,542
- − Insurance
- −$1,848
- − Repairs & maintenance
- −$3,579
- − Management
- −$3,579
- − HOA
- −$5,292
- − Depreciation
- −$10,749
- Taxable loss
- −$6,550
- Est. tax savings @ 24.0%
- +$1,572
- After-tax cash flow
- $980/yr
For passive investors: Depreciation is non-cash, so a rental often shows a tax loss while cash-flowing — sheltering income. Rental losses are passive: they offset passive income freely, and up to $25,000/yr can offset ordinary (W-2) income if you actively participate and your MAGI is under $100k (phasing out to $0 by $150k); unused losses carry forward. On sale, claimed depreciation is recaptured at up to 25%, and gains may owe capital-gains tax (a 1031 exchange can defer both). Figures are a year-1 estimate at your 24.0% rate — not tax advice; consult a CPA.
Condition & rehab AI · 30 photos
This well-maintained, updated single-family home with a spacious lanai and neutral interior is ready for move-in. It offers a good balance of curb appeal and interior comfort, making it an attractive option for both resale and rental.
Value-add opportunities
- Both landscaping — enhances curb appeal and outdoor living space
- Both furniture — adds comfort and functionality to the living spaces
Renovation cost estimate screening
Value-add ROI direction
- Both landscaping — enhances curb appeal and outdoor living space ↑
- Both furniture — adds comfort and functionality to the living spaces ↑
ⓘ Cost ranges are severity-bucket heuristics (US national rule-of-thumb). Get contractor quotes + a written scope before underwriting a rehab budget.
Schools (NCES district)
- District
- Lee
- NCES district ID
- 1201080
- Math proficiency
- 47% ▼ -11.00%
- Reading proficiency
- 50% ▼ -4.00%
- Median HH income
- $49,518
- Composite
- 41.49/100
- National rank
- #3458
- State rank
- #42 of 73 in FL
Livability — Estero
- Score
- 79/100
- State rank
- #149
- US rank
- #2242
Category grades
Schools grade is shown separately in the Schools card above.
Census & demographics
- Census place
- Estero, FL
- County
- Lee County · 788,662 people
- City population
- 31,926
- Metro
- Cape Coral-Fort Myers, FL
- Population (ZIP)
- 31,926
- Household income
- $102,624
- Rent vs Own
- Severe rent burden
- 606.0
Population outlook (Lee County) Hauer SSP2
- Today (2025)
- 871,946 people
- By 2030
- 955,468 · +9.6%
- By 2040
- 1,113,587 · +27.7%
- By 2050
- 1,256,891 · +44.1%
- By 2075
- 1,560,270 · +78.9%
- By 2100
- 1,726,848 · +98.0%
Race, ethnicity, and origin ACS 2023
- Neighborhood character
- Predominantly White (85%)
- Race & ethnicity
- White 85% Hispanic / Latino 8% Two or more races 7% Asian 3% Black 1%
- Hispanic origin (detail)
- Mexican 2% Puerto Rican 2% Cuban 1%
- Common ancestry
- Romanian 5% Lithuanian 3% Slovak 2%
- Foreign-born
- 11% · Canada, China, Jamaica
- Languages at home
- 90% English-only · Spanish 5% Other Indo-European 1% French/Haitian/Cajun 1%
Political lean MEDSL · Lee
- 2024 margin
- Strong R (+28.4) · D 35.5% · R 63.9%
- 2008→2024 swing
- -18.0pp toward R · 2008: -10.4pp · 2024: -28.4pp
- All cycles
- 2024: R+28.4 2020: R+19.2 2016: R+20.4 2012: R+16.6 2008: R+10.4
Not yet ingested
- Civics
- —
Market trends
- HPI YoY
- ▼ -109.49%
- Current HPI
- 197.5913
- Rent YoY
- ▼ -1.42%
- Metro
- Cape Coral-Fort Myers, FL
- State GDP YoY
- ▲ 3.28%
- F500 in state
- 36
Industry mix (Fortune 500 HQ in FL)
| Industry | F500 HQs | Revenue |
|---|---|---|
| Industrial Technology | 2 | $29B |
|
||
| Insurance | 2 | $17B |
|
||
| Retail | 1 | $60B |
|
||
| Technology Distribution | 1 | $58B |
|
||
| Homebuilding | 1 | $35B |
|
||
| Technology Manufacturing | 1 | $35B |
|
||
Price history
1 event — show timeline
- 2026-05-23 Listed $369,500 BEARMLS
Cash-flow waterfall
monthlySold comps — $/sqft
last 12 mo · ≤1 miLoading sold comps…