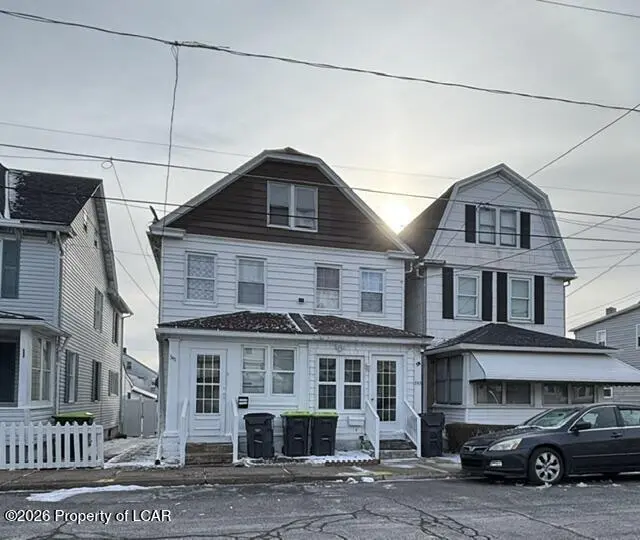
343 Adams St · Freeland, PA
Flood risk 1/10 · Minimal
- FEMA flood zone
- X (unshaded)
- Chance of flooding over 30 yrs
- 0.0%
- Est. flood insurance / yr
- $507 – $1,088
Fire risk 3/10 · Minor
- Est. fire insurance / yr
- $511 – $949
Heat risk 2/10 · Minimal
- Hot days now (above 90°F)
- 7 days/yr
- Hot days in 30 yrs
- 17 days/yr
Wind risk 4/10 · Minor
- Chance of severe wind over 30 yrs
- 8.0%
Air-quality risk 2/10 · Minimal
- Unhealthy air days now
- 1 days/yr
- Unhealthy air days in 30 yrs
- 2 days/yr
Risk factors via First Street. Map © Google.
Why this score? — see what drove the C+ grade
The composite is a weighted blend of 9 inputs, each scored 0–100. Each bar is that input's sub-score; the figure is the points it added to the 100-point composite (weight × sub-score).
- Cash flow +21.2/30.0
- ARV discount +11.9/15.0
- Appreciation +10.0/10.0
- DSCR +6.8/10.0
- 1% rule +4.8/10.0
- Livability +3.1/5.0
- Rent growth +2.5/5.0
- Condition / age +2.5/5.0
- Schools +2.0/10.0
$147,900
🖨 Deal sheet 📄 Offer letter ✓ Due diligence
Listing remarks MLS
Nicely kept 3 Bedrooms, with newer gas boiler and attic storage. Enclosed front porch and parking on rear yard.
Key facts
- Attic storage
- Parking on rear yard
- Newer gas boiler
Tags
Neighborhood map
What this means for you Summary
Snapshot
- This is a 3-bed/1.0-bath single-family listed at $148k.
Deal economics
- At list price, monthly cash flow is $215 ($3k/yr) — positive.
- The deal already cash-flows at list — no discount required.
- To meet the 1% rule (rent ≥ 1% of price), the offer needs to be $145k (2.0% below list).
- Recommended offer: $135k (9.0% below list) — sets the bar for market timing.
- Cap rate 8.0% vs local median 6.3% in Freeland — meaningfully above typical; check what's discounted (condition, days-on-market, listing class) to confirm the premium yield is real.
Location & tenants
- Location reads 61/100 on livability (#1,409 in PA) — a middle-class / working-renter tenant base. Strengths: cost of living A+, crime A, housing A-; Watch: schools F, amenities F, commute F.
- Hazleton Area SD (suburban): math 18% / reading 30% proficiency, ranked #476 of 539 in PA (top 88%) — low school quality limits family demand, transient renter base, plan for 1-2y turnover.
- Market conditions: 43 active listings in the ZIP; 1 comparable units currently listed for rent nearby; 349 units permitted in Luzerne County in 2024 (16 in 5+ unit buildings).
Forward outlook
- In year one you build about $16k of equity ($1k loan paydown + $15k appreciation (10.0% local appreciation)).
- Luzerne County population projected at +4% by 2050 — modest demand growth; plan on rents tracking national, not racing it.
- At projected returns (10.0% appreciation + 3.0% rent growth), your $41k cash investment doubles in ~3 years — after that, you're playing with house money.
- By year 3, paydown + projected appreciation supports a ~$40k cash-out refi (75% LTV) — recoverable capital for the next deal without selling this one.
Negotiation context
- It's been on market 91 days — a 9% lower offer ($135k) is reasonable based on typical stale-listing flexibility.
- 3 sale attempts since 12y ago with the ask held roughly flat each time — persistent listings suggest the price (not the market) is what's stuck; bring a comps-based counter.
- Current owner paid $35k; list at $148k implies a 323% gain — meaningful room to come down on a strong offer.
Risks & watch-outs
- Watch-outs: built in 1930 — expect roof / HVAC / electrical / plumbing capex.
Questions for the listing agent
- It's been on market 91 days. Have you received any prior offers? Is the seller open to a 9% concession, seller financing, or rate buy-down credit?
- Built in 1930 — when were the roof, HVAC, electrical panel, plumbing, and water heater last replaced?
- Why hasn't it sold? Are there any deal-killer items the seller is aware of (foundation, flood, title, zoning, code violations)?
- Is there a deadline driving the sale (1031 exchange, divorce, estate, relocation)? That informs how much negotiation room exists.
- Schools are F-rated, which usually means shorter tenancies and higher turnover. Who's the typical renter profile here, and what's been the actual vacancy rate?
- What's the average days-on-market for RENTAL listings here right now (not sales)? A rising rental-DOM trend means longer vacancies and softer asking-rent achievability than the comps imply.
- What's the recent tenant-quality profile in this submarket — average credit score on applications, eviction rate, late-payment / NSF rate, and stable-employment percentage? A property-management company in the area should have these aggregated.
- How much new for-sale + rental construction is in the pipeline within 1–3 miles? Heavy new supply typically softens prices + rents 12–24 months out; constrained supply supports both.
Investment metrics
- 1% rule
- 0.98% ✗
- Cap rate
- 8.03%
- Cash-on-cash
- 6.22%
- DSCR
- 1.28
- GRM
- 8.5
CMA / ARV
- ARV (median comp)
- $163,772
- List price
- $147,900
- Delta
- -9.69%
- Verdict
- FAIR
- Comps
- 20 within 1.0 mi
Show comp detail 12 sales within ~0.75 mi
| Address | Dist | Beds/Ba | Sqft | Sold | Price | $/sf | Match |
|---|---|---|---|---|---|---|---|
| 635 Vine St | 0.38mi | 3/1.5 | 1,438 (-2%) | 3mo | $145,000 | $101 | 75 |
| 505 Cedar St | 0.38mi | 3/1.5 | 1,504 (+3%) | 6mo | $212,500 | $141 | 70 |
| 957 Chestnut St | 0.49mi | 2/1.0 (-1) | 1,489 (+2%) | 0mo | $73,825 | $50 | 69 |
| 909 Birkbeck St | 0.38mi | 3/1.0 | 1,320 (-10%) | 0mo | $110,000 | $83 | 66 |
| 169 Alvin St | 0.50mi | 3/1.0 | 1,392 (-5%) | 5mo | $189,900 | $136 | 64 |
| 611 Washington St | 0.20mi | 3/1.0 | 1,248 (-15%) | 3mo | $119,900 | $96 | 64 |
| 315 Alvin St | 0.52mi | 4/1.0 (+1) | 1,498 (+2%) | 5mo | $130,000 | $87 | 63 |
| 710 Walnut St St | 0.31mi | 3/1.0 | 1,260 (-14%) | 8mo | $105,000 | $83 | 56 |
| 437 Alvin St | 0.56mi | 4/1.5 (+1) | 1,558 (+7%) | 1mo | $191,000 | $123 | 55 |
| 714 Ingham St | 0.41mi | 3/1.0 | 1,248 (-15%) | 2mo | $95,000 | $76 | 55 |
| 942 Burton St | 0.44mi | 3/1.0 | 1,260 (-14%) | 3mo | $75,000 | $60 | 54 |
| 1130 Centre St | 0.61mi | 3/1.5 | 1,680 (+15%) | 6mo | $294,900 | $176 | 40 |
Match score weights: distance 35% · size 25% · config 20% · recency 20%. Top-matched comps best support the ARV.
Projected returns pro-forma
10.0% appreciation · 3.0% rent growth · sell at horizon
- IRR
- 28.8%
- Equity multiple
- 3.27×
- Total profit
- $94,178
- Equity at exit
- $133,240
- IRR
- 25.0%
- Equity multiple
- 7.44×
- Total profit
- $266,527
- Equity at exit
- $287,337
Cash invested: $41,412 (down + closing). Projections, not guarantees.
Landlord ↔ Tenant lean methodology
- Overall (STATE)
- 62 Landlord-Friendly
- State Pennsylvania
- 62 Landlord-Friendly · EVEN
- County
- — inherits STATE
- City
- — inherits STATE
ZIP-level market 18224
- Home prices YoY
- 9.2%
- Active inventory
- 43
- Price-to-rent
- 8.5×
Monthly cashflow live
- Estimated rent
- $1,450 medium interval (Pro) →
- Mortgage (P&I)
- −$776
- Tax from tax record
- −$94 /mo · $1,125/yr
- Insurance
- −$62
- HOA
- −$0
- Vacancy / Maint / Mgmt
- −$304
- Net cashflow
- $215
Break-even live
UW: 25.0% down · 7.5% · 30yr · 1.5% tax · 5.0% vac · 8.0% maint · 8.0% mgmt
Financing live
Cash to close
- Down payment
- $36,975
- Closing costs
- $4,437
- Reserves months
- —
- Total cash needed
- —
Loan-product check · same deal, 3 products live
Conventional
25% down · 7.5% · 30yr
- Down + closing
- —
- Monthly P&I
- —
- Monthly cashflow
- —
- DSCR
- —
- Eligible?
- —
Personal DTI + credit; lowest rate.
DSCR
20% down · 8.5% · 30yr
- Down + closing
- —
- Monthly P&I
- —
- Monthly cashflow
- —
- DSCR
- —
- Eligible?
- —
No personal income docs; deal must DSCR.
Hard money
10% down · 12.0% · 12mo
- Down + closing
- —
- Monthly P&I
- —
- Monthly cashflow
- —
- DSCR
- —
- Eligible?
- —
Short-term bridge; refi at stabilization.
Rent comps 1 comps
| Address | Beds | Baths | Sqft | Rent | $/sqft | DOM | Units | Dist |
|---|---|---|---|---|---|---|---|---|
| 109 Terrace Rd Freeland, PA | 3.0 | 1.0 | 1150 | $1,450 | $1.26 | 21d | 1 | 0.62mi |
Listing history 20 events
-
2026-06-19days on market $147,900 Active 91 DOM
-
2026-06-18days on market $147,900 Active 90 DOM
-
2026-06-17days on market $147,900 Active 89 DOM
-
2026-06-16days on market $147,900 Active 88 DOM
-
2026-06-15days on market $147,900 Active 87 DOM
-
2026-06-14days on market $147,900 Active 85 DOM
-
2026-06-12days on market $147,900 Active 84 DOM
-
2026-06-09days on market $147,900 Active 81 DOM
-
2026-06-08days on market $147,900 Active 80 DOM
-
2026-06-07days on market $147,900 Active 79 DOM
-
2026-06-02days on market $147,900 Active 74 DOM
-
2026-06-01days on market $147,900 Active 73 DOM
-
2026-05-31days on market $147,900 Active 72 DOM
-
2026-05-30days on market $147,900 Active 71 DOM
-
2026-03-17$150,000 Active 111-char remark
Show marketing remark (111 chars)
Nicely kept 3 Bedrooms, with newer gas boiler and attic storage. Enclosed front porch and parking on rear yard.
-
2018-08-01soldstatus $35,000 256-char remark
Show marketing remark (256 chars)
Newer Kitchen, 3 Bedroom, Very economical Coal Heat, 1 bath on 2nd floor, possible 3rd floor 4th & 5th bedroom, Separate attic storage, Area nice fenced yard for children or pets. Additional parking spot on the back of the house, enclose front porch.
-
2018-03-26$37,900 256-char remark
Show marketing remark (256 chars)
Newer Kitchen, 3 Bedroom, Very economical Coal Heat, 1 bath on 2nd floor, possible 3rd floor 4th & 5th bedroom, Separate attic storage, Area nice fenced yard for children or pets. Additional parking spot on the back of the house, enclose front porch.
-
2017-02-03soldstatus $24,000
-
2014-08-24$26,900
-
2006-03-13soldstatus $45,000
ⓘ Source: listings_history table (triggers on properties + properties_extension) + one-shot
backfill from property_details.listing_events for pre-trigger history.
Tax reassessment forecast PA · Partial reset (capped growth)
- Current annual tax
- $1,125 · $94/mo
- Projected year-2 tax
- $1,731 · $144/mo
- Expected delta
- +$606/yr (+$50/mo · 53.8%)
ⓘ Screening estimate from a state-policy table — verify with the county assessor before closing.
Climate risk First Street
- Flood 1/10 Low FEMA zone X (unshaded) · 0% chance over 30 yrs
- Wildfire 3/10 Moderate
- Heat 2/10 Low 7 d/yr ≥90°F today · 17 d/yr by 30 yrs out
- Wind 4/10 Moderate 8% chance of damaging wind over 30 yrs
- Air quality 2/10 Low 1 unhealthy d/yr today · 2 by 30 yrs out
Nearby sold comps map
Loading sold comps map…
Walkable amenities ~0.75 mi
Loading nearby amenities…
Taxation est. · year 1
- Rental income
- $17,400
- − Mortgage interest
- −$8,285
- − Property taxes
- −$1,125
- − Insurance
- −$740
- − Repairs & maintenance
- −$1,392
- − Management
- −$1,392
- − Depreciation
- −$4,303
- Taxable income
- $164
- Est. tax owed @ 24.0%
- −$39
- After-tax cash flow
- $2,535/yr
For passive investors: Depreciation is non-cash, so a rental often shows a tax loss while cash-flowing — sheltering income. Rental losses are passive: they offset passive income freely, and up to $25,000/yr can offset ordinary (W-2) income if you actively participate and your MAGI is under $100k (phasing out to $0 by $150k); unused losses carry forward. On sale, claimed depreciation is recaptured at up to 25%, and gains may owe capital-gains tax (a 1031 exchange can defer both). Figures are a year-1 estimate at your 24.0% rate — not tax advice; consult a CPA.
Schools (NCES district)
- District
- Hazleton Area SD
- NCES district ID
- 4211700
- Math proficiency
- 18% ▼ -3.00%
- Reading proficiency
- 30% ▼ -15.00%
- Median HH income
- $42,247
- Composite
- 20.44/100
- National rank
- #8582
- State rank
- #476 of 539 in PA
Livability — Freeland
- Score
- 61/100
- State rank
- #1409
- US rank
- #17813
Category grades
Schools grade is shown separately in the Schools card above.
Census & demographics
- Census place
- Freeland, PA
- City population
- 5,954
- Population (ZIP)
- 5,954
Population outlook (Luzerne County) Hauer SSP2
- Today (2025)
- 319,505 people
- By 2030
- 319,943 · +0.1%
- By 2040
- 322,643 · +1.0%
- By 2050
- 330,817 · +3.5%
- By 2075
- 379,145 · +18.7%
- By 2100
- 431,908 · +35.2%
Race, ethnicity, and origin ACS 2023
- Neighborhood character
- Predominantly White (85%)
- Race & ethnicity
- White 85% Hispanic / Latino 12% Two or more races 6%
- Hispanic origin (detail)
- Puerto Rican 8% Dominican 3%
- Common ancestry
- Romanian 13% Scotch-Irish 4% Iranian 2%
- Foreign-born
- 3% · Canada
- Languages at home
- 87% English-only · Spanish 10% Russian/Polish/Slavic 1%
Political lean MEDSL · Luzerne
- 2024 margin
- R (+19.2) · D 40.0% · R 59.2%
- 2008→2024 swing
- -27.6pp toward R · 2008: 8.4pp · 2024: -19.2pp
- All cycles
- 2024: R+19.2 2020: R+14.4 2016: R+19.6 2012: D+4.8 2008: D+8.4
Not yet ingested
- Civics
- —
Market trends
- HPI YoY
- ▲ 22.89%
- Current HPI
- 270.8055
- Rent YoY
- —
- Metro
- —
- State GDP YoY
- ▲ 1.68%
- F500 in state
- 34
Industry mix (Fortune 500 HQ in PA)
| Industry | F500 HQs | Revenue |
|---|---|---|
| Healthcare | 2 | $309B |
|
||
| Insurance | 2 | $27B |
|
||
| Telecommunications / Media | 1 | $124B |
|
||
| Industrial Distribution | 1 | $22B |
|
||
| Financial Services | 1 | $20B |
|
||
| Chemicals / Materials | 1 | $18B |
|
||
Price history
+233.3% since first listed6 events — show timeline
- 2026-03-17 Listed $150,000 LCAR
- 2018-08-01 Sold (MLS) $35,000 LCAR
- 2018-03-26 Listed $37,900 LCAR
- 2017-02-03 Sold (MLS) $24,000 LCAR
- 2014-08-24 Listed $26,900 LCAR
- 2006-03-13 Sold (Public Records) $45,000 Public Records
Property tax history
+2.9%/yrLatest (2026): $1,125 · +3.8% YoY. Source: county tax records.
Cash-flow waterfall
monthlySold comps — $/sqft
last 12 mo · ≤1 miLoading sold comps…