 Multi-family
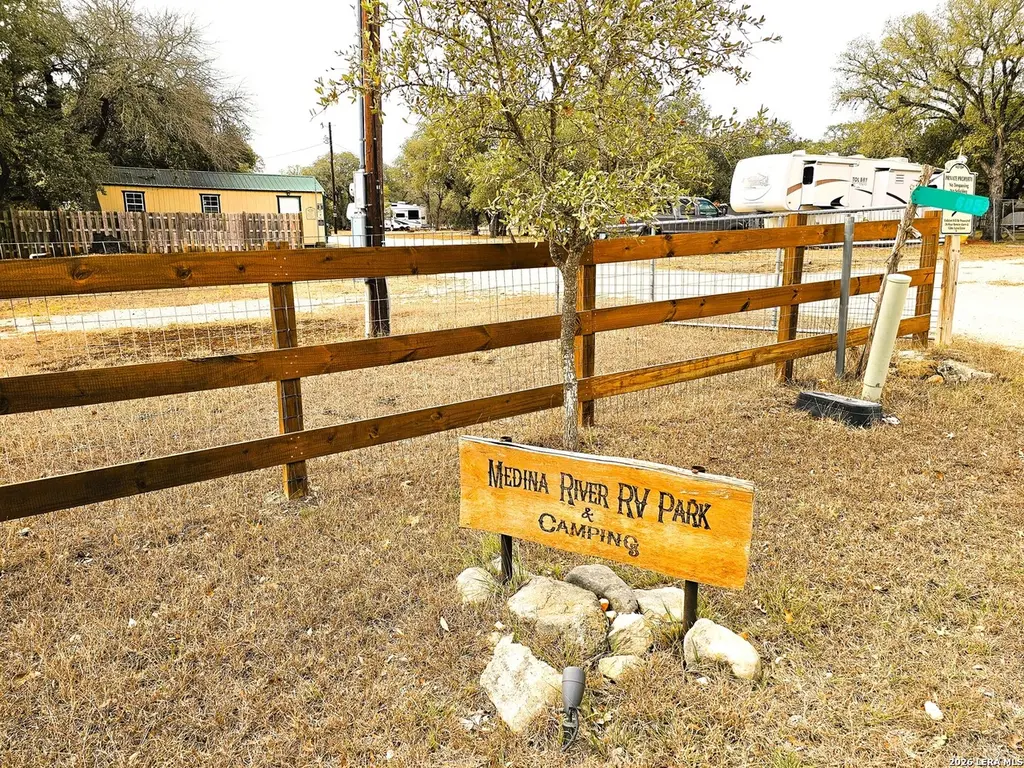
605 Lakeshore Ln · Lake Medina Shores, TX
Flood risk 1/10 · Minimal
- FEMA flood zone
- X (unshaded)
- Chance of flooding over 30 yrs
- 0.0%
- Est. flood insurance / yr
- $507 – $1,088
Fire risk 4/10 · Minor
- Est. fire insurance / yr
- $1,222 – $2,270
Heat risk 7/10 · Major
- Hot days now (above 107°F)
- 7 days/yr
- Hot days in 30 yrs
- 22 days/yr
Wind risk 6/10 · Moderate
- Chance of severe wind over 30 yrs
- 62.0%
Air-quality risk 1/10 · Minimal
- Unhealthy air days now
- 0 days/yr
- Unhealthy air days in 30 yrs
- 0 days/yr
Risk factors via First Street. Map © Google.
Why this score? — see what drove the B- grade
The composite is a weighted blend of 9 inputs, each scored 0–100. Each bar is that input's sub-score; the figure is the points it added to the 100-point composite (weight × sub-score).
- Cash flow +29.8/30.0
- DSCR +10.0/10.0
- 1% rule +8.4/10.0
- ARV discount +7.5/15.0
- Schools +3.1/10.0
- Livability +2.8/5.0
- Rent growth +2.5/5.0
- Condition / age +2.5/5.0
- Appreciation +0.0/10.0
$469,900
🖨 Deal sheet 📄 Offer letter ✓ Due diligence
Multi-family units
County records classify this as Multi-Family (5+ Unit). Listing-text estimate: 1 unit. estimate disagrees with records
5+ unit building — per-unit beds/baths from public records are typically unavailable; the breakdown below (if shown) is an estimate from the listing text.
Listing remarks MLS
2.65 acres with 2 septics, 2 covered carports on concrete, well with system water available. Plumbed for RV park. 5 units available for immediate occupancy with 2 undeveloped acres for expansion. Ready to build or ready to rent.
Key facts
- Utility moat
- Manufactured home
- Expansion potential
Tags
Property features AI
Finance
- Other: 24 total rental units; Typical unit rent listed at $435; Many units occupied and handicap accessible; % Vacancy rate listed at 36%
- Financial info: Gross annual income approximately $67,575; Net operating income approximately $44,008; Annual operating expenses approximately $23,567; Operating expenses include taxes, insurance, maintenance, management, licenses/permits, all utilities, equipment, services, miscellaneous and other (see remarks); Down payment resource not indicated
- HOA & community: Mandatory HOA; HOA fee $120 annually; Association transfer fee $50
Exterior
- Parking: Pad parking (multiple units have assigned pad spaces)
- Security: Security system
- Utilities: Separate electric meters for units; Separate water meters for units; Common water and electric meters present; Electric service: BEC; Gas: Private; Water: City and septic; Sewer: Septic; Garbage service: Apache
- Home design: Multi-unit property (24 units total); Approximate age: 9 years; Metal roof; Other exterior materials (see remarks); Other foundation (see remarks)
- Construction: Metal roof; Other foundation (see remarks)
- Exterior features: Patio slab; Covered patio; Mature trees; Detached quarters; Common utility room; Workshop; Garage apartment; Waterfront improvements and access; Partially wooded; Level lot; Lake Medina frontage
Interior
- Flooring: Laminate flooring
- Heating & cooling: Electric heat; Window/wall A/C; Other heating (see remarks)
- Interior features: Security system; Other interior features available (see remarks)
Neighborhood map
What this means for you Summary
Snapshot
- This is a multifamily listed at $470k.
Deal economics
- At list price, monthly cash flow is $2k ($21k/yr) — positive.
- The deal already cash-flows at list — no discount required.
- Meets the 1% rule at list price ($6k rent vs $470k).
- Recommended offer: $414k (12.0% below list) — sets the bar for market timing.
- Cap rate 10.7% vs local median 4.8% in Lake Medina Shores — top-decile yield for the area; either an underpriced asset or a hidden risk that comps aren't pricing in. Stress-test before assuming the spread holds.
Location & tenants
- Location reads 56/100 on livability (#1,318 in TX) — a working-class tenant base; expect higher turnover. Strengths: cost of living A+, housing A+, crime A-; Watch: employment D+, amenities F, commute F.
- Bandera ISD (rural): math 30% / reading 41% proficiency, ranked #500 of 826 in TX (top 60%) — families likely to look elsewhere, expect single-tenant / working-renter base with shorter leases.
- Zoned schools: Alkek El (math 32% / reading 34%, grade F, #2,208 of 4,322 statewide, top 52%, 630 students, 61% FRL); Bandera H S (math 22% / reading 46%, grade F, #1,002 of 1,632 statewide, top 62%, 713 students, 48% FRL).
- Market conditions: 531 active listings in the ZIP; 8 comparable units currently listed for rent nearby; rentals lingering (median 44d on market — plan ~5-8 weeks vacancy on turnover, expect pricing pressure); 50% of comp listings sitting > 30 days — soft ceiling on asking rent; 6 units permitted in Bandera County in 2024 (0 in 5+ unit buildings).
Forward outlook
- Local home prices are declining (-3.0%/yr); year-one equity from $3k of loan paydown is wiped out by about $14k of value loss. Plan a longer hold.
- At projected returns (-3.0% appreciation + 3.0% rent growth), your $132k cash investment doubles in ~8 years — after that, you're playing with house money.
Negotiation context
- It's been on market 125 days — a 12% lower offer ($414k) is reasonable based on typical stale-listing flexibility.
- 2 sale attempts since 12y ago with the ask held roughly flat each time — persistent listings suggest the price (not the market) is what's stuck; bring a comps-based counter.
Risks & watch-outs
- Climate carrying-cost: major wind risk, 62% chance of damaging wind over 30y; extreme-heat days projected 7→22/yr by 2055 (HVAC capex compounding) — expect insurance premiums to compound above CPI over the hold.
Questions for the listing agent
- It's been on market 125 days. Have you received any prior offers? Is the seller open to a 12% concession, seller financing, or rate buy-down credit?
- What does the HOA fee cover, when was the last increase, and are there any pending special assessments or reserve-fund shortfalls?
- Why hasn't it sold? Are there any deal-killer items the seller is aware of (foundation, flood, title, zoning, code violations)?
- Is there a deadline driving the sale (1031 exchange, divorce, estate, relocation)? That informs how much negotiation room exists.
- Schools are F-rated, which usually means shorter tenancies and higher turnover. Who's the typical renter profile here, and what's been the actual vacancy rate?
- What's the average days-on-market for RENTAL listings here right now (not sales)? A rising rental-DOM trend means longer vacancies and softer asking-rent achievability than the comps imply.
- What's the recent tenant-quality profile in this submarket — average credit score on applications, eviction rate, late-payment / NSF rate, and stable-employment percentage? A property-management company in the area should have these aggregated.
- How much new apartment / multifamily construction is in the pipeline within 1–3 miles? Heavy new supply (>2% of stock underway) typically softens rents 12–24 months out; light construction supports rent growth.
Investment metrics
- 1% rule
- 1.34% ✓
- Cap rate
- 10.70%
- Cash-on-cash
- 15.73%
- DSCR
- 1.70
- GRM
- 6.2
CMA / ARV
No comps found within radius.
Projected returns pro-forma
-3.0% appreciation · 3.0% rent growth · sell at horizon
- IRR
- 6.6%
- Equity multiple
- 1.26×
- Total profit
- $33,833
- Equity at exit
- $70,064
- IRR
- 16.0%
- Equity multiple
- 2.30×
- Total profit
- $171,356
- Equity at exit
- $40,628
Cash invested: $131,572 (down + closing). Projections, not guarantees.
Landlord ↔ Tenant lean methodology
- Overall (STATE)
- 87 Strongly Landlord-Friendly
- State Texas
- 87 Strongly Landlord-Friendly · R+5
- County
- — inherits STATE
- City
- — inherits STATE
ZIP-level market 78003
- Home prices YoY
- -14.3%
- Active inventory
- 531
- Price-to-rent
- 31.0×
Monthly cashflow live
- Estimated rent
- $6,307 high interval (Pro) →
- Mortgage (P&I)
- −$2,464
- Tax est. 1.5%
- −$587 /mo · $7,048/yr
- Insurance
- −$196
- HOA
- −$10
- Vacancy / Maint / Mgmt
- −$1,324
- Net cashflow
- $1,725
Break-even live
5-unit breakdown (identical units grouped — click to expand)
| Units | Beds | Baths | Est. rent |
|---|---|---|---|
| 5× units | 0 | 0 | $6,305 |
| #1 | 0 | 0 | $1,261 |
| #2 | 0 | 0 | $1,261 |
| #3 | 0 | 0 | $1,261 |
| #4 | 0 | 0 | $1,261 |
| #5 | 0 | 0 | $1,261 |
| Total (5 units) | $6,307 | ||
UW: 25.0% down · 7.5% · 30yr · 1.5% tax · 5.0% vac · 8.0% maint · 8.0% mgmt
Financing live
Cash to close
- Down payment
- $117,475
- Closing costs
- $14,097
- Reserves months
- —
- Total cash needed
- —
Loan-product check · same deal, 3 products live
Conventional
25% down · 7.5% · 30yr
- Down + closing
- —
- Monthly P&I
- —
- Monthly cashflow
- —
- DSCR
- —
- Eligible?
- —
Personal DTI + credit; lowest rate.
DSCR
20% down · 8.5% · 30yr
- Down + closing
- —
- Monthly P&I
- —
- Monthly cashflow
- —
- DSCR
- —
- Eligible?
- —
No personal income docs; deal must DSCR.
Hard money
10% down · 12.0% · 12mo
- Down + closing
- —
- Monthly P&I
- —
- Monthly cashflow
- —
- DSCR
- —
- Eligible?
- —
Short-term bridge; refi at stabilization.
Rent comps 8 comps
| Address | Beds | Baths | Sqft | Rent | $/sqft | DOM | Units | Dist |
|---|---|---|---|---|---|---|---|---|
| 535 Oak Lawn Dr Unit 4 Bandera, TX | 2.0 | 1.0 | 800 | $1,175 | $1.47 | 24d | 1 | 0.22mi |
| 551 Oak Lawn Dr Unit 2 Bandera, TX | 3.0 | 2.0 | 1200 | $1,250 | $1.04 | 43d | 1 | 0.23mi |
| 149 Vint Bonner Dr Unit 149V Bandera, TX | 3.0 | 2.0 | 1250 | $1,150 | $0.92 | 24d | 1 | 0.58mi |
| 241 Brushy Creek Trl Bandera, TX | 3.0 | 2.0 | 1200 | $1,495 | $1.25 | 7d | 1 | 0.93mi |
| 161 Water St Unit B Pipe Creek, TX | 2.0 | 1.0 | 900 | $1,000 | $1.11 | 43d | 1 | 1.31mi |
| 161 Water St Unit A Pipe Creek, TX | 3.0 | 2.0 | 1120 | $1,200 | $1.07 | 43d | 1 | 1.31mi |
| 1110 Grandview Cir Bandera, TX | 2.0 | 2.0 | 1125 | $1,750 | $1.56 | 43d | 1 | 1.42mi |
| 146 Cedar St Pipe Creek, TX | 2.0 | 1.5 | 1092 | $1,695 | $1.55 | 7d | 1 | 1.49mi |
HOA detail
- Monthly dues
- $10 · $120/yr
- Likely covers
- water
Listing history 19 events
-
2026-06-18days on market $469,900 Active 125 DOM
-
2026-06-17days on market $469,900 Active 124 DOM
-
2026-06-16days on market $469,900 Active 123 DOM
-
2026-06-15days on market $469,900 Active 122 DOM
-
2026-06-13days on market $469,900 Active 120 DOM
-
2026-06-09days on market $469,900 Active 116 DOM
-
2026-06-07days on market $469,900 Active 114 DOM
-
2026-06-04days on market $469,900 Active 111 DOM
-
2026-06-03days on market $469,900 Active 110 DOM
-
2026-06-02days on market $469,900 Active 109 DOM
-
2026-06-01days on market $469,900 Active 108 DOM
-
2026-05-31days on market $469,900 Active 107 DOM
-
2026-02-13$469,900 New
-
2020-10-26soldstatus
-
2017-10-30soldstatus Sold 230-char remark
Show marketing remark (230 chars)
2.65 acres with 2 septics, 2 covered carports on concrete, well with system water available. Plumbed for RV park. 5 units available for immediate occupancy with 2 undeveloped acres for expansion. Ready to build or ready to rent.
-
2017-08-17status Pending 230-char remark
Show marketing remark (230 chars)
2.65 acres with 2 septics, 2 covered carports on concrete, well with system water available. Plumbed for RV park. 5 units available for immediate occupancy with 2 undeveloped acres for expansion. Ready to build or ready to rent.
-
2017-07-06historical Active Option 230-char remark
Show marketing remark (230 chars)
2.65 acres with 2 septics, 2 covered carports on concrete, well with system water available. Plumbed for RV park. 5 units available for immediate occupancy with 2 undeveloped acres for expansion. Ready to build or ready to rent.
-
2017-05-27price $75,000 230-char remark
Show marketing remark (230 chars)
2.65 acres with 2 septics, 2 covered carports on concrete, well with system water available. Plumbed for RV park. 5 units available for immediate occupancy with 2 undeveloped acres for expansion. Ready to build or ready to rent.
-
2014-10-01$99,000 New 230-char remark
Show marketing remark (230 chars)
2.65 acres with 2 septics, 2 covered carports on concrete, well with system water available. Plumbed for RV park. 5 units available for immediate occupancy with 2 undeveloped acres for expansion. Ready to build or ready to rent.
ⓘ Source: listings_history table (triggers on properties + properties_extension) + one-shot
backfill from property_details.listing_events for pre-trigger history.
Climate risk First Street
- Flood 1/10 Low FEMA zone X (unshaded) · 0% chance over 30 yrs
- Wildfire 4/10 Moderate
- Heat 7/10 Severe 7 d/yr ≥107°F today · 22 d/yr by 30 yrs out
- Wind 6/10 Major 62% chance of damaging wind over 30 yrs
- Air quality 1/10 Low 0 unhealthy d/yr today · 0 by 30 yrs out
Nearby sold comps map
Loading sold comps map…
Walkable amenities ~0.75 mi
Loading nearby amenities…
Taxation est. · year 1
- Rental income
- $75,684
- − Mortgage interest
- −$26,322
- − Property taxes
- −$7,048
- − Insurance
- −$2,350
- − Repairs & maintenance
- −$6,055
- − Management
- −$6,055
- − HOA
- −$120
- − Depreciation
- −$13,670
- Taxable income
- $14,065
- Est. tax owed @ 24.0%
- −$3,376
- After-tax cash flow
- $17,326/yr
For passive investors: Depreciation is non-cash, so a rental often shows a tax loss while cash-flowing — sheltering income. Rental losses are passive: they offset passive income freely, and up to $25,000/yr can offset ordinary (W-2) income if you actively participate and your MAGI is under $100k (phasing out to $0 by $150k); unused losses carry forward. On sale, claimed depreciation is recaptured at up to 25%, and gains may owe capital-gains tax (a 1031 exchange can defer both). Figures are a year-1 estimate at your 24.0% rate — not tax advice; consult a CPA.
Schools (NCES district)
- District
- Bandera ISD
- NCES district ID
- 4809360
- Math proficiency
- 30% ▼ -7.00%
- Reading proficiency
- 41% ▼ -3.00%
- Median HH income
- $48,771
- Composite
- 30.61/100
- National rank
- #6194
- State rank
- #500 of 826 in TX
Livability — Lake Medina Shores
- Score
- 56/100
- State rank
- #1318
- US rank
- #22715
Category grades
Schools grade is shown separately in the Schools card above.
Census & demographics
- Census place
- Lake Medina Shores, TX
- Population (ZIP)
- 9,594
Population outlook (Bandera County) Hauer SSP2
- Today (2025)
- 22,614 people
- By 2030
- 23,102 · +2.2%
- By 2040
- 23,489 · +3.9%
- By 2050
- 23,264 · +2.9%
- By 2075
- 23,607 · +4.4%
- By 2100
- 22,265 · -1.5%
Race, ethnicity, and origin ACS 2023
- Neighborhood character
- Predominantly White (74%)
- Race & ethnicity
- White 74% Hispanic / Latino 21% Two or more races 15% Native American 1%
- Hispanic origin (detail)
- Mexican 17%
- Common ancestry
- Lithuanian 3% Serbian 3% Romanian 2%
- Foreign-born
- 4% · Canada, Jamaica
- Languages at home
- 85% English-only · Spanish 14% German/W. Germanic 1%
Political lean MEDSL · Bandera
- 2024 margin
- Solid R (+61.9) · D 18.6% · R 80.5%
- 2008→2024 swing
- -11.5pp toward R · 2008: -50.4pp · 2024: -61.9pp
- All cycles
- 2024: R+61.9 2020: R+59.4 2016: R+63.0 2012: R+59.0 2008: R+50.4
Not yet ingested
- Civics
- —
Market trends
- HPI YoY
- ▼ -35.80%
- Current HPI
- 215.0687
- Rent YoY
- —
- Metro
- —
- State GDP YoY
- ▲ 3.95%
- F500 in state
- 110
Industry mix (Fortune 500 HQ in TX)
| Industry | F500 HQs | Revenue |
|---|---|---|
| Energy | 16 | $1,198B |
|
||
| Technology | 5 | $198B |
|
||
| Engineering / Construction | 4 | $72B |
|
||
| Energy Services | 3 | $60B |
|
||
| Utilities | 3 | $41B |
|
||
| Healthcare | 2 | $330B |
|
||
Price history
+374.6% since first listed7 events — show timeline
- 2026-02-13 Listed $469,900 LERA
- 2020-10-26 Sold (Public Records) — Public Records
- 2017-10-30 Sold (MLS) — LERA
- 2017-08-17 Pending — LERA
- 2017-07-06 Contingent — LERA
- 2017-05-27 Price Changed $75,000 LERA
- 2014-10-01 Listed $99,000 LERA
Property tax history
+4.4%/yrLatest (2025): $205 · +20.0% YoY. Source: county tax records.
Cash-flow waterfall
monthlySold comps — $/sqft
last 12 mo · ≤1 miLoading sold comps…