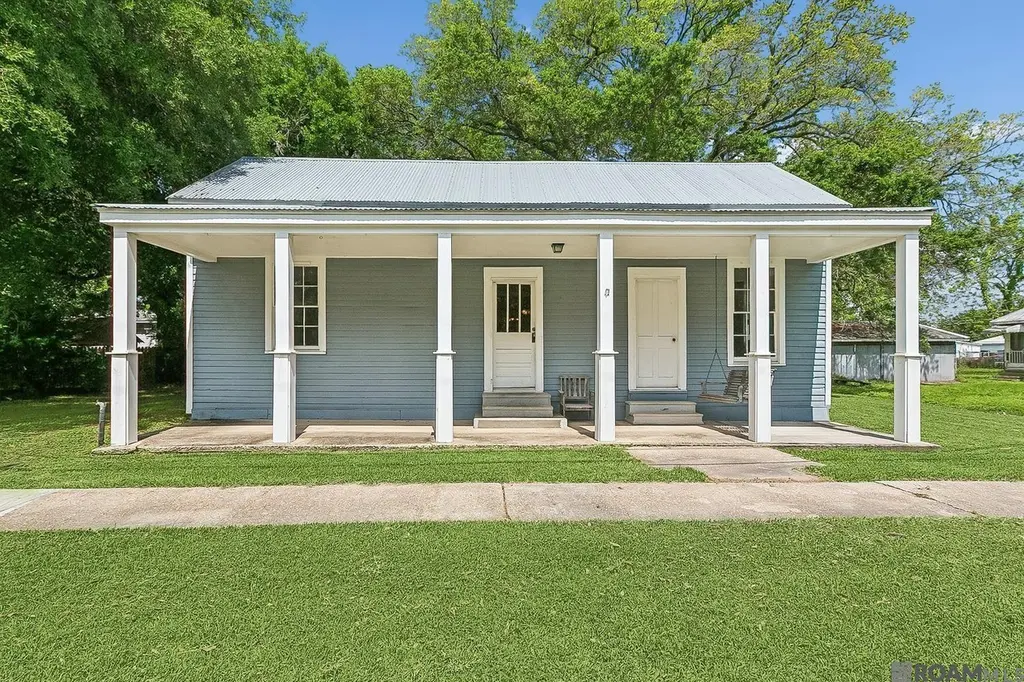
2378 Cypress St · Lutcher, LA
Flood risk 1/10 · Minimal
- FEMA flood zone
- X (shaded)
- Chance of flooding over 30 yrs
- 0.0%
- Est. flood insurance / yr
- $507 – $1,088
Fire risk 1/10 · Minimal
- Est. fire insurance / yr
- $1,269 – $2,357
Heat risk 9/10 · Severe
- Hot days now (above 108°F)
- 7 days/yr
- Hot days in 30 yrs
- 22 days/yr
Wind risk 9/10 · Severe
- Chance of severe wind over 30 yrs
- 99.0%
Air-quality risk 2/10 · Minimal
- Unhealthy air days now
- 1 days/yr
- Unhealthy air days in 30 yrs
- 1 days/yr
Risk factors via First Street. Map © Google.
Why this score? — see what drove the C grade
The composite is a weighted blend of 9 inputs, each scored 0–100. Each bar is that input's sub-score; the figure is the points it added to the 100-point composite (weight × sub-score).
- Cash flow +17.1/30.0
- ARV discount +15.0/15.0
- Appreciation +7.0/10.0
- DSCR +5.3/10.0
- 1% rule +3.7/10.0
- Livability +3.4/5.0
- Schools +3.1/10.0
- Rent growth +2.5/5.0
- Condition / age +2.5/5.0
$139,000
🖨 Deal sheet 📄 Offer letter ✓ Due diligence
Listing remarks MLS
Charming three bedroom, two bathroom home in Lutcher offering right under 1500 square feet of well maintained living space. Perfect for a primary residence or investment opportunity, with a strong rental history generating 1250 monthly with the current owner. Located in a convenient area with access to local schools and amenities. An excellent choice for buyers seeking either a comfortable home or a solid investment property.
Key facts
- 0.31 acre lot
- 4 parking spots
- Built 1902
Property features AI
Finance
- Other: Located in the Lutcher & Moore subdivision; Directions: from Lutcher Ave, turn down Fifth St then down Cypress
Exterior
- Parking: Carport with 4 spaces; Total of 4 parking spaces
- Utilities: Public water; Public sewer
- Home design: Detached single-family residence; One story
- Construction: Wood siding construction
- Exterior features: Lot approximately 0.31 acres (93 x 147); Covered carport; Driveway
Interior
- Bedrooms: Single-story home
- Bathrooms: 2 full bathrooms
- Heating & cooling: Wall furnace; Window unit(s) for cooling
- Interior features: Window cooling units; Wall furnace heating
Neighborhood map
What this means for you Summary
Snapshot
- This is a 3-bed/2.0-bath single-family listed at $139k.
Deal economics
- At list price, monthly cash flow is $96 ($1k/yr) — positive.
- The deal already cash-flows at list — no discount required.
- To meet the 1% rule (rent ≥ 1% of price), the offer needs to be $121k (13.1% below list).
- Recommended offer: $121k (13.1% below list) — sets the bar for 1% rule.
Location & tenants
- Location reads 68/100 on livability (#98 in LA) — a middle-class / working-renter tenant base. Strengths: cost of living A+, housing A+, schools B+; Watch: amenities F, commute F, health & safety F.
- St. James Parish (town): math 31% / reading 41% proficiency, ranked #30 of 98 in LA (top 31%) — families likely to look elsewhere, expect single-tenant / working-renter base with shorter leases; 67% free/reduced lunch — lower-income household profile, screen leases tightly.
- Market conditions: 15 active listings in the ZIP; 64 units permitted in St. James Parish in 2024 (0 in 5+ unit buildings).
Forward outlook
- In year one you build about $6k of equity ($961 loan paydown + $6k appreciation (4.0% local appreciation)).
- St. James County population projected at -20% by 2050 — secular population decline; favor cash flow + early exit over multi-decade hold.
- At projected returns (4.0% appreciation + 3.0% rent growth), your $39k cash investment doubles in ~5 years — after that, you're playing with house money.
- By year 6, paydown + projected appreciation supports a ~$34k cash-out refi (75% LTV) — recoverable capital for the next deal without selling this one.
Negotiation context
- It's been on market 43 days — a 3% lower offer ($135k) is reasonable based on typical stale-listing flexibility.
- 4 sale attempts since 16y ago with the ask held roughly flat each time — persistent listings suggest the price (not the market) is what's stuck; bring a comps-based counter.
- Current owner paid $93k; 49% above their basis — modest negotiation headroom, anchor on the comps not their cost.
Risks & watch-outs
- Watch-outs: built in 1902 — expect roof / HVAC / electrical / plumbing capex.
- Climate carrying-cost: severe wind risk, 99% chance of damaging wind over 30y; extreme-heat days projected 7→22/yr by 2055 (HVAC capex compounding) — expect insurance premiums to compound above CPI over the hold.
Questions for the listing agent
- It's been on market 43 days. Have you received any prior offers? Is the seller open to a 13% concession, seller financing, or rate buy-down credit?
- Built in 1902 — when were the roof, HVAC, electrical panel, plumbing, and water heater last replaced?
- Is there a deadline driving the sale (1031 exchange, divorce, estate, relocation)? That informs how much negotiation room exists.
- Schools are B-rated — typically a magnet for longer-tenancy family renters. What's the average tenant stay here, and is there a school-zone premium baked into asking?
- What's the average days-on-market for RENTAL listings here right now (not sales)? A rising rental-DOM trend means longer vacancies and softer asking-rent achievability than the comps imply.
- What's the recent tenant-quality profile in this submarket — average credit score on applications, eviction rate, late-payment / NSF rate, and stable-employment percentage? A property-management company in the area should have these aggregated.
- How much new for-sale + rental construction is in the pipeline within 1–3 miles? Heavy new supply typically softens prices + rents 12–24 months out; constrained supply supports both.
Investment metrics
- 1% rule
- 0.87% ✗
- Cap rate
- 7.12%
- Cash-on-cash
- 2.96%
- DSCR
- 1.13
- GRM
- 9.6
CMA / ARV
- ARV (median comp)
- $177,469
- List price
- $139,000
- Delta
- -21.68%
- Verdict
- UNDERPRICED
- Comps
- 20 within 1.0 mi
Show comp detail 11 sales within ~0.75 mi
| Address | Dist | Beds/Ba | Sqft | Sold | Price | $/sf | Match |
|---|---|---|---|---|---|---|---|
| 1179 Desoto Dr | 0.38mi | 3/2.0 | 1,449 (-5%) | 0mo | $230,000 | $159 | 74 |
| 2220 S Central Ave | 0.37mi | 3/2.0 | 1,600 (+5%) | 2mo | $198,000 | $124 | 73 |
| 1355 3rd St | 0.19mi | 3/2.0 | 1,418 (-7%) | 23mo | $170,000 | $120 | 60 |
| 1871 George Street St | 0.48mi | 3/2.0 | 1,653 (+9%) | 4mo | $207,000 | $125 | 60 |
| 2301 N King Ave | 0.30mi | 3/2.0 | 1,325 (-13%) | 8mo | $31,500 | $24 | 58 |
| 1617 3rd St | 0.56mi | 3/2.0 | 1,648 (+8%) | 11mo | $194,900 | $118 | 51 |
| 342 N Airline Ave | 0.70mi | 3/2.0 | 1,542 (+1%) | 18mo | $229,000 | $149 | 50 |
| 2169 S Albert St | 0.43mi | 3/1.0 | 1,435 (-6%) | 23mo | $145,000 | $101 | 48 |
| 222 S Fir St | 0.68mi | 3/2.0 | 1,338 (-12%) | 1mo | $85,000 | $64 | 47 |
| 177 N Airline Ave | 0.58mi | 2/2.0 (-1) | 1,354 (-11%) | 3mo | $215,000 | $159 | 47 |
| 1217 Desoto Dr | 0.32mi | 3/2.0 | 1,320 (-13%) | 24mo | $175,000 | $133 | 43 |
Match score weights: distance 35% · size 25% · config 20% · recency 20%. Top-matched comps best support the ARV.
Projected returns pro-forma
3.97% appreciation · 3.0% rent growth · sell at horizon
- IRR
- 12.8%
- Equity multiple
- 1.77×
- Total profit
- $30,119
- Equity at exit
- $70,266
- IRR
- 14.2%
- Equity multiple
- 3.31×
- Total profit
- $89,950
- Equity at exit
- $114,760
Cash invested: $38,920 (down + closing). Projections, not guarantees.
Landlord ↔ Tenant lean methodology
- Overall (STATE)
- 90 Strongly Landlord-Friendly
- State Louisiana
- 90 Strongly Landlord-Friendly · R+12
- County
- — inherits STATE
- City
- — inherits STATE
ZIP-level market 70071
- Home prices YoY
- 3.5%
- Active inventory
- 15
- Price-to-rent
- 9.6×
Monthly cashflow live
- Estimated rent
- $1,208 medium interval (Pro) →
- Mortgage (P&I)
- −$729
- Tax from tax record
- −$71 /mo · $855/yr
- Insurance
- −$58
- HOA
- −$0
- Vacancy / Maint / Mgmt
- −$254
- Net cashflow
- $96
Break-even live
UW: 25.0% down · 7.5% · 30yr · 1.5% tax · 5.0% vac · 8.0% maint · 8.0% mgmt
Financing live
Cash to close
- Down payment
- $34,750
- Closing costs
- $4,170
- Reserves months
- —
- Total cash needed
- —
Loan-product check · same deal, 3 products live
Conventional
25% down · 7.5% · 30yr
- Down + closing
- —
- Monthly P&I
- —
- Monthly cashflow
- —
- DSCR
- —
- Eligible?
- —
Personal DTI + credit; lowest rate.
DSCR
20% down · 8.5% · 30yr
- Down + closing
- —
- Monthly P&I
- —
- Monthly cashflow
- —
- DSCR
- —
- Eligible?
- —
No personal income docs; deal must DSCR.
Hard money
10% down · 12.0% · 12mo
- Down + closing
- —
- Monthly P&I
- —
- Monthly cashflow
- —
- DSCR
- —
- Eligible?
- —
Short-term bridge; refi at stabilization.
Listing history 23 events
-
2026-06-19days on market $139,000 Active 43 DOM
-
2026-06-18days on market $139,000 Active 42 DOM
-
2026-06-17days on market $139,000 Active 41 DOM
-
2026-06-16days on market $139,000 Active 40 DOM
-
2026-06-15days on market $139,000 Active 39 DOM
-
2026-06-14days on market $139,000 Active 37 DOM
-
2026-06-13pricedays on market $139,000 Active 36 DOM
-
2026-06-10days on market $145,000 Active 34 DOM
Show marketing remark (429 chars)
Charming three bedroom, two bathroom home in Lutcher offering right under 1500 square feet of well maintained living space. Perfect for a primary residence or investment opportunity, with a strong rental history generating 1250 monthly with the current owner. Located in a convenient area with access to local schools and amenities. An excellent choice for buyers seeking either a comfortable home or a solid investment property.
-
2026-06-09days on market $145,000 Active 33 DOM
-
2026-06-08days on market $145,000 Active 32 DOM
-
2026-06-07days on market $145,000 Active 31 DOM
-
2026-06-05days on market $145,000 Active 28 DOM
-
2026-06-02days on market $145,000 Active 26 DOM
-
2026-06-01days on market $145,000 Active 25 DOM
-
2026-05-31days on market $145,000 Active 24 DOM
-
2026-05-30days on market $145,000 Active 23 DOM
-
2026-05-07$145,000 Active 429-char remark
Show marketing remark (429 chars)
Charming three bedroom, two bathroom home in Lutcher offering right under 1500 square feet of well maintained living space. Perfect for a primary residence or investment opportunity, with a strong rental history generating 1250 monthly with the current owner. Located in a convenient area with access to local schools and amenities. An excellent choice for buyers seeking either a comfortable home or a solid investment property.
-
2022-08-22soldstatus $93,000
-
2010-08-02soldstatus $85,000
-
2010-07-30soldstatus $85,000
Show marketing remark (188 chars)
Home has open kitchen and dining area with living room, 3 bedrooms, 2 baths and an office. Large front and rear porch with a 1 car carport and a 9x20 storage(attached to home) in the rear.
-
2010-01-20$89,900
Show marketing remark (188 chars)
Home has open kitchen and dining area with living room, 3 bedrooms, 2 baths and an office. Large front and rear porch with a 1 car carport and a 9x20 storage(attached to home) in the rear.
-
2010-01-20$89,900
Show marketing remark (188 chars)
Home has open kitchen and dining area with living room, 3 bedrooms, 2 baths and an office. Large front and rear porch with a 1 car carport and a 9x20 storage(attached to home) in the rear.
ⓘ Source: listings_history table (triggers on properties + properties_extension) + one-shot
backfill from property_details.listing_events for pre-trigger history.
Tax reassessment forecast LA · Resets to sale price
- Current annual tax
- $855 · $71/mo
- Projected year-2 tax
- $855 · $71/mo
- Expected delta
- $0/yr ($0/mo · 0.0%)
ⓘ Screening estimate from a state-policy table — verify with the county assessor before closing.
Climate risk First Street
- Flood 1/10 Low FEMA zone X (shaded) · 0% chance over 30 yrs
- Wildfire 1/10 Low
- Heat 9/10 Extreme 7 d/yr ≥108°F today · 22 d/yr by 30 yrs out
- Wind 9/10 Extreme 99% chance of damaging wind over 30 yrs
- Air quality 2/10 Low 1 unhealthy d/yr today · 1 by 30 yrs out
Nearby sold comps map
Loading sold comps map…
Walkable amenities ~0.75 mi
Loading nearby amenities…
Taxation est. · year 1
- Rental income
- $14,493
- − Mortgage interest
- −$7,786
- − Property taxes
- −$855
- − Insurance
- −$695
- − Repairs & maintenance
- −$1,159
- − Management
- −$1,159
- − Depreciation
- −$4,044
- Taxable loss
- −$1,205
- Est. tax savings @ 24.0%
- +$289
- After-tax cash flow
- $1,442/yr
For passive investors: Depreciation is non-cash, so a rental often shows a tax loss while cash-flowing — sheltering income. Rental losses are passive: they offset passive income freely, and up to $25,000/yr can offset ordinary (W-2) income if you actively participate and your MAGI is under $100k (phasing out to $0 by $150k); unused losses carry forward. On sale, claimed depreciation is recaptured at up to 25%, and gains may owe capital-gains tax (a 1031 exchange can defer both). Figures are a year-1 estimate at your 24.0% rate — not tax advice; consult a CPA.
Schools (NCES district)
- District
- St. James Parish
- NCES district ID
- 2201500
- Math proficiency
- 31% ▼ -44.00%
- Reading proficiency
- 41% ▼ -38.00%
- Median HH income
- $51,020
- Composite
- 31.24/100
- National rank
- #6031
- State rank
- #30 of 98 in LA
Livability — Lutcher
- Score
- 68/100
- State rank
- #98
- US rank
- #9911
Category grades
Schools grade is shown separately in the Schools card above.
Census & demographics
- Census place
- Lutcher, LA
- City population
- 3,123
- Population (ZIP)
- 3,123
Population outlook (St. James County) Hauer SSP2
- Today (2025)
- 20,741 people
- By 2030
- 20,140 · -2.9%
- By 2040
- 18,560 · -10.5%
- By 2050
- 16,673 · -19.6%
- By 2075
- 12,535 · -39.6%
- By 2100
- 8,610 · -58.5%
Race, ethnicity, and origin ACS 2023
- Neighborhood character
- Majority White (58%)
- Race & ethnicity
- White 58% Black 38% Hispanic / Latino 3%
- Common ancestry
- Lithuanian 14% Slovak 1% Portuguese 1%
- Foreign-born
- 6% · Canada
- Languages at home
- 99% English-only · Spanish 1%
Political lean MEDSL · St. James
- 2024 margin
- Toss-up / Even · D 49.1% · R 50.1%
- 2008→2024 swing
- -13.4pp toward R · 2008: 12.4pp · 2024: -0.9pp
- All cycles
- 2024: R+0.9 2020: D+4.4 2016: D+8.0 2012: D+14.9 2008: D+12.4
Not yet ingested
- Civics
- —
Market trends
- HPI YoY
- ▲ 3.97%
- Current HPI
- 118.976
- Rent YoY
- —
- Metro
- —
- State GDP YoY
- ▲ 3.29%
- F500 in state
- 10
Industry mix (Fortune 500 HQ in LA)
| Industry | F500 HQs | Revenue |
|---|---|---|
| Telecommunications | 2 | $23B |
|
||
| Utilities | 1 | $12B |
|
||
| Wholesale / Distribution | 1 | $5B |
|
||
| Advertising | 1 | $2B |
|
||
Price history
+54.6% since first listed9 events — show timeline
- 2026-06-10 Price Changed $139,000 AcadianaMLS
- 2026-06-10 Price Changed $139,000 GBRMLS
- 2026-05-07 Listed $145,000 GBRMLS
- 2026-05-07 Listed $145,000 AcadianaMLS
- 2022-08-22 Sold (Public Records) $93,000 Public Records
- 2010-08-02 Sold (Public Records) $85,000 Public Records
- 2010-07-30 Sold (MLS) — GSREIN
- 2010-01-20 Listed $89,900 AcadianaMLS
- 2010-01-20 Listed $89,900 GSREIN
Property tax history
+0.4%/yrLatest (2025): $855 · +0.0% YoY. Source: county tax records.
Cash-flow waterfall
monthlySold comps — $/sqft
last 12 mo · ≤1 miLoading sold comps…