 Multi-family
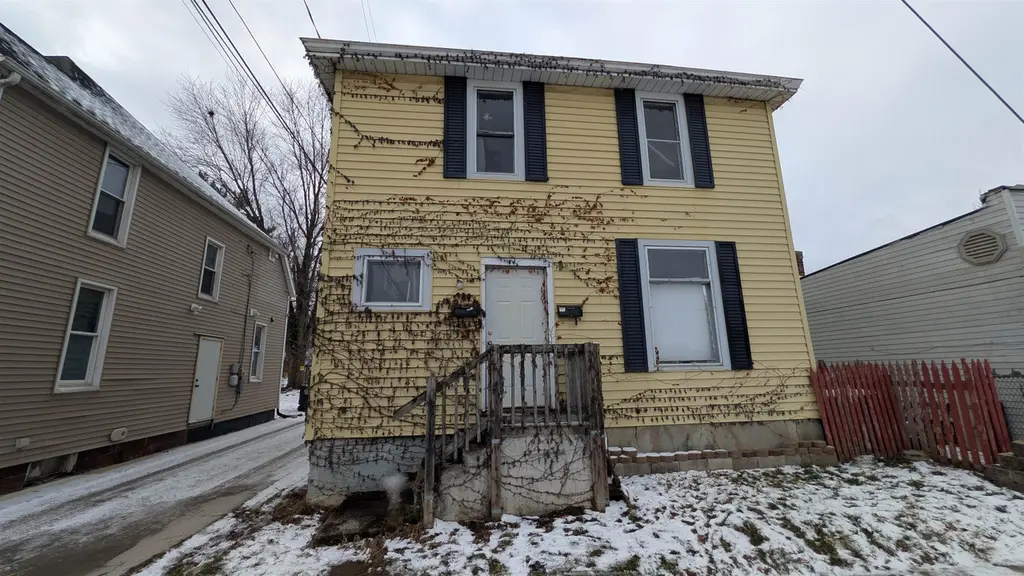
1317 N Harrison St · Fort Wayne, IN
Flood risk 3/10 · Minor
- FEMA flood zone
- X
- Chance of flooding over 30 yrs
- 0.1%
- Est. flood insurance / yr
- $473 – $860
Fire risk 1/10 · Minimal
- Est. fire insurance / yr
- $717 – $1,331
Heat risk 3/10 · Minor
- Hot days now (above 100°F)
- 7 days/yr
- Hot days in 30 yrs
- 17 days/yr
Wind risk 2/10 · Minimal
- Chance of severe wind over 30 yrs
- —
Air-quality risk 3/10 · Minor
- Unhealthy air days now
- 2 days/yr
- Unhealthy air days in 30 yrs
- 3 days/yr
Risk factors via First Street. Map © Google.
Why this score? — see what drove the B- grade
The composite is a weighted blend of 9 inputs, each scored 0–100. Each bar is that input's sub-score; the figure is the points it added to the 100-point composite (weight × sub-score).
- Cash flow +30.0/30.0
- 1% rule +10.0/10.0
- DSCR +10.0/10.0
- Rent growth +4.2/5.0
- Livability +4.2/5.0
- ARV discount +3.6/15.0
- Condition / age +2.5/5.0
- Schools +2.2/10.0
- Appreciation +0.0/10.0
$125,000
🖨 Deal sheet 📄 Offer letter ✓ Due diligence
Multi-family units
County records classify this as Multi-Family (2-4 Unit). Listing-text estimate: 1 unit. estimate disagrees with records
Listing remarks MLS
Come See this Excellent investment opportunity! Currently set up for a duplex, the property is zoned for up to three units. The property is incredibly close in proximity to Promenade Park and other New Downtown Developments! The property offers a convenient location, easy access to local amenities, parks, and more! The home needs a lot of updates, but also has many possibilities!
Key facts
- 1,302 sq ft lot
- Built 1900
- Listed 154 days
Tags
Neighborhood map
What this means for you Summary
Snapshot
- This is a 3-bed/3.0-bath multifamily listed at $125k.
Deal economics
- At list price, monthly cash flow is $976 ($12k/yr) — positive.
- The deal already cash-flows at list — no discount required.
- Meets the 1% rule at list price ($2k rent vs $125k).
- Recommended offer: $110k (12.0% below list) — sets the bar for market timing.
- Cap rate 15.7% vs local median 4.8% in Fort Wayne — top-decile yield for the area; either an underpriced asset or a hidden risk that comps aren't pricing in. Stress-test before assuming the spread holds.
Location & tenants
- Location reads 84/100 on livability (#6 in IN, #676 nationally) — a professional / high-income tenant draw. Strengths: amenities A+, commute A+, cost of living A+; Watch: crime C-, schools D+, employment D+.
- Fort Wayne Community Schools (urban): math 22% / reading 29% proficiency, ranked #263 of 301 in IN (top 87%) — low school quality limits family demand, transient renter base, plan for 1-2y turnover; 60% free/reduced lunch — lower-income household profile, screen leases tightly.
- Market conditions: Rents rising fast (+7.0%/yr); 87 active listings in the ZIP; 28 comparable units currently listed for rent nearby; rentals at typical pace (median 21d on market — plan ~3-4 weeks tenant-placement turnaround); 46% of comp listings sitting > 30 days — soft ceiling on asking rent; 1,861 units permitted in Allen County in 2024 (576 in 5+ unit buildings).
- At $2,165/mo this rent would consume 49% of the median local household income ($53k/yr) (locally 625% of renters already pay >50% of income on rent) — very limited rent-growth headroom before tenants either downsize or default.
Forward outlook
- Local home prices are declining (-3.0%/yr); year-one equity from $864 of loan paydown is wiped out by about $4k of value loss. Plan a longer hold.
- Allen County population projected at +10% by 2050 — modest demand growth; plan on rents tracking national, not racing it.
- At projected returns (-3.0% appreciation + 7.0% rent growth), your $35k cash investment doubles in ~4 years — after that, you're playing with house money.
Negotiation context
- It's been on market 154 days — a 12% lower offer ($110k) is reasonable based on typical stale-listing flexibility.
Risks & watch-outs
- Watch-outs: built in 1900 — expect roof / HVAC / electrical / plumbing capex.
Questions for the listing agent
- It's been on market 154 days. Have you received any prior offers? Is the seller open to a 12% concession, seller financing, or rate buy-down credit?
- Built in 1900 — when were the roof, HVAC, electrical panel, plumbing, and water heater last replaced?
- Why hasn't it sold? Are there any deal-killer items the seller is aware of (foundation, flood, title, zoning, code violations)?
- Is there a deadline driving the sale (1031 exchange, divorce, estate, relocation)? That informs how much negotiation room exists.
- Schools are D-rated, which usually means shorter tenancies and higher turnover. Who's the typical renter profile here, and what's been the actual vacancy rate?
- What's the average days-on-market for RENTAL listings here right now (not sales)? A rising rental-DOM trend means longer vacancies and softer asking-rent achievability than the comps imply.
- What's the recent tenant-quality profile in this submarket — average credit score on applications, eviction rate, late-payment / NSF rate, and stable-employment percentage? A property-management company in the area should have these aggregated.
- How much new apartment / multifamily construction is in the pipeline within 1–3 miles? Heavy new supply (>2% of stock underway) typically softens rents 12–24 months out; light construction supports rent growth.
Investment metrics
- 1% rule
- 1.73% ✓
- Cap rate
- 15.66%
- Cash-on-cash
- 33.46%
- DSCR
- 2.49
- GRM
- 4.8
CMA / ARV
- ARV (median comp)
- $114,914
- List price
- $125,000
- Delta
- 8.78%
- Verdict
- FAIR
- Comps
- 20 within 1.0 mi
Show comp detail 8 sales within ~0.75 mi
| Address | Dist | Beds/Ba | Sqft | Sold | Price | $/sf | Match |
|---|---|---|---|---|---|---|---|
| 1331 Spy Run Ave | 0.41mi | 4/4.0 (+1) | 1,608 (+4%) | 6mo | $235,000 | $146 | 61 |
| 1602 Geller St | 0.39mi | 2/2.0 (-1) | 1,604 (+4%) | 9mo | $145,000 | $90 | 60 |
| 1014 Huffman St | 0.67mi | 2/2.0 (-1) | 1,562 (+1%) | 4mo | $159,999 | $102 | 56 |
| 712 Putnam St | 0.56mi | 3/2.0 | 1,630 (+5%) | 7mo | $120,000 | $74 | 55 |
| 1723 Andrew St | 0.57mi | 3/1.5 | 1,408 (-9%) | 15mo | $179,900 | $128 | 40 |
| 928 Putnam St | 0.68mi | 4/2.0 (+1) | 1,640 (+6%) | 14mo | $165,000 | $101 | 38 |
| 1419 Saint Marys Ave | 0.66mi | 4/2.5 (+1) | 1,612 (+4%) | 21mo | $135,000 | $84 | 38 |
| 1006 W 4th St | 0.61mi | 4/3.0 (+1) | 1,440 (-7%) | 23mo | $153,100 | $106 | 36 |
Match score weights: distance 35% · size 25% · config 20% · recency 20%. Top-matched comps best support the ARV.
Projected returns pro-forma
-3.0% appreciation · 6.98% rent growth · sell at horizon
- IRR
- 32.8%
- Equity multiple
- 2.45×
- Total profit
- $50,869
- Equity at exit
- $18,638
- IRR
- 41.8%
- Equity multiple
- 5.69×
- Total profit
- $164,306
- Equity at exit
- $10,808
Cash invested: $35,000 (down + closing). Projections, not guarantees.
Landlord ↔ Tenant lean methodology
- Overall (STATE)
- 90 Strongly Landlord-Friendly
- State Indiana
- 90 Strongly Landlord-Friendly · R+11
- County
- — inherits STATE
- City
- — inherits STATE
ZIP-level market 46808
- Rents YoY
- 7.0%
- Active inventory
- 87
- Price-to-rent
- 9.6×
Monthly cashflow live
- Estimated rent
- $2,165 high interval (Pro) →
- Mortgage (P&I)
- −$656
- Tax from tax record
- −$27 /mo · $322/yr
- Insurance
- −$52
- HOA
- −$0
- Vacancy / Maint / Mgmt
- −$455
- Net cashflow
- $976
Break-even live
2-unit breakdown (identical units grouped — click to expand)
| Units | Beds | Baths | Est. rent |
|---|---|---|---|
| 2× units | 2 | 1 | $2,166 |
| #1 | 2 | 1 | $1,083 |
| #2 | 2 | 1 | $1,083 |
| Total (2 units) | $2,165 | ||
UW: 25.0% down · 7.5% · 30yr · 1.5% tax · 5.0% vac · 8.0% maint · 8.0% mgmt
Financing live
Cash to close
- Down payment
- $31,250
- Closing costs
- $3,750
- Reserves months
- —
- Total cash needed
- —
Loan-product check · same deal, 3 products live
Conventional
25% down · 7.5% · 30yr
- Down + closing
- —
- Monthly P&I
- —
- Monthly cashflow
- —
- DSCR
- —
- Eligible?
- —
Personal DTI + credit; lowest rate.
DSCR
20% down · 8.5% · 30yr
- Down + closing
- —
- Monthly P&I
- —
- Monthly cashflow
- —
- DSCR
- —
- Eligible?
- —
No personal income docs; deal must DSCR.
Hard money
10% down · 12.0% · 12mo
- Down + closing
- —
- Monthly P&I
- —
- Monthly cashflow
- —
- DSCR
- —
- Eligible?
- —
Short-term bridge; refi at stabilization.
Rent comps 28 comps
| Address | Beds | Baths | Sqft | Rent | $/sqft | DOM | Units | Dist |
|---|---|---|---|---|---|---|---|---|
| 739 W 4th St Fort Wayne, IN | 4.0 | 2.0 | 1750 | $1,995 | $1.14 | 13d | 1 | 0.49mi |
| 702 Archer Ave Fort Wayne, IN | 3.0 | 1.5 | 1273 | $1,499 | $1.18 | 44d | 1 | 0.63mi |
| 835 Van Buren St Fort Wayne, IN | 2.0 | 1.0–2.0 | 750 | $1,995 | $2.66 | 13d | 29 | 0.69mi |
| 805 Edgewater Ave Fort Wayne, IN | 3.0 | 1.0 | 1075 | $1,550 | $1.44 | 13d | 1 | 0.75mi |
| 807 Edgewater Ave Fort Wayne, IN | 3.0 | 1.0 | 1075 | $1,450 | $1.35 | 21d | 1 | 0.76mi |
| 2315 Terrace Rd Fort Wayne, IN | 3.0 | 1.0 | 1466 | $1,600 | $1.09 | 43d | 1 | 0.79mi |
| 901 W Wayne St Unit 3 Fort Wayne, IN | 2.0 | 2.0 | 1312 | $1,700 | $1.30 | 43d | 1 | 0.80mi |
| 2403 N Clinton St Fort Wayne, IN | 3.0 | 2.0 | 1666 | $1,750 | $1.05 | 43d | 1 | 0.82mi |
| 1250 Ewing St Fort Wayne, IN | 2.0 | 1.0–2.0 | 980 | $2,081 | $2.12 | 21d | 24 | 0.82mi |
| 1516 Bayer Ave Fort Wayne, IN | 4.0 | 2.0 | 1280 | $1,299 | $1.01 | 13d | 1 | 0.90mi |
| 1502 3rd St Fort Wayne, IN | 3.0 | 1.5 | 1344 | $1,650 | $1.23 | 13d | 1 | 0.93mi |
| 603 Lavina St Fort Wayne, IN | 3.0 | 2.0 | 1872 | $1,899 | $1.01 | 43d | 1 | 0.94mi |
| 1132 S Hanna St Unit 1 Fort Wayne, IN | 4.0 | 1.5 | 1656 | $1,600 | $0.97 | 43d | 1 | 0.97mi |
| 1726 Tecumseh St Fort Wayne, IN | 3.0 | 1.0 | 1280 | $1,350 | $1.05 | 13d | 1 | 0.98mi |
| 877 Lavina St Fort Wayne, IN | 1.0–3.0 | 1.0–2.0 | 997 | $2,980 | $2.99 | 43d | 17 | 0.99mi |
| 1118 Rockhill St Fort Wayne, IN | 3.0 | 3.0 | 1790 | $2,300 | $1.28 | 43d | 1 | 1.00mi |
| 1206 Columbia Ave Unit 2 Fort Wayne, IN | 2.0 | 2.0 | 1118 | $995 | $0.89 | 43d | 1 | 1.04mi |
| 1626 Howell St Unit 201 Fort Wayne, IN | 3.0 | 2.0 | 1200 | $1,700 | $1.42 | 21d | 1 | 1.04mi |
| 915 Garden St Fort Wayne, IN | 2.0 | 2.0 | 1275 | $1,650 | $1.29 | 13d | 1 | 1.04mi |
| 919 Madison St Fort Wayne, IN | 2.0 | 1.0 | 1332 | $995 | $0.75 | 43d | 1 | 1.11mi |
| 1721 3rd St Fort Wayne, IN | 3.0 | 1.0 | 1584 | $1,195 | $0.75 | 43d | 1 | 1.16mi |
| 607 Curdes Ave Fort Wayne, IN | 3.0 | 1.5 | 1072 | $1,450 | $1.35 | 21d | 1 | 1.19mi |
| 217 W Masterson Ave Fort Wayne, IN | 2.0 | 1.0 | 1100 | $995 | $0.90 | 21d | 1 | 1.23mi |
| 1131 E Lewis St Fort Wayne, IN | 4.0 | 2.0 | 1476 | $1,950 | $1.32 | 13d | 1 | 1.28mi |
| 1104 Stophlet St Fort Wayne, IN | 3.0 | 1.5 | 1288 | $1,400 | $1.09 | 13d | 1 | 1.29mi |
| 1915 Ellen Ave Fort Wayne, IN | 2.0 | 1.0 | 1100 | $950 | $0.86 | 13d | 1 | 1.37mi |
| 2118 Webster St Fort Wayne, IN | 4.0 | 1.0 | 2200 | $1,175 | $0.53 | 43d | 1 | 1.40mi |
| 1501 E Lewis St Fort Wayne, IN | 4.0 | 1.0 | 2000 | $1,450 | $0.72 | 43d | 1 | 1.50mi |
Listing history 16 events
-
2026-06-18days on market $125,000 Active 154 DOM
-
2026-06-17days on market $125,000 Active 153 DOM
-
2026-06-16days on market $125,000 Active 152 DOM
-
2026-06-15days on market $125,000 Active 151 DOM
-
2026-06-14days on market $125,000 Active 149 DOM
-
2026-06-10days on market $125,000 Active 146 DOM
-
2026-06-09days on market $125,000 Active 145 DOM
-
2026-06-08days on market $125,000 Active 144 DOM
-
2026-06-07days on market $125,000 Active 143 DOM
-
2026-06-03days on market $125,000 Active 139 DOM
-
2026-06-02days on market $125,000 Active 138 DOM
-
2026-06-01days on market $125,000 Active 137 DOM
-
2026-05-31days on market $125,000 Active 136 DOM
-
2026-05-30days on market $125,000 Active 135 DOM
-
2026-04-14price $125,000 382-char remark
Show marketing remark (382 chars)
Come See this Excellent investment opportunity! Currently set up for a duplex, the property is zoned for up to three units. The property is incredibly close in proximity to Promenade Park and other New Downtown Developments! The property offers a convenient location, easy access to local amenities, parks, and more! The home needs a lot of updates, but also has many possibilities!
-
2026-01-15$140,000 Active 382-char remark
Show marketing remark (382 chars)
Come See this Excellent investment opportunity! Currently set up for a duplex, the property is zoned for up to three units. The property is incredibly close in proximity to Promenade Park and other New Downtown Developments! The property offers a convenient location, easy access to local amenities, parks, and more! The home needs a lot of updates, but also has many possibilities!
ⓘ Source: listings_history table (triggers on properties + properties_extension) + one-shot
backfill from property_details.listing_events for pre-trigger history.
Tax reassessment forecast IN · Partial reset (capped growth)
- Current annual tax
- $322 · $27/mo
- Projected year-2 tax
- $692 · $58/mo
- Expected delta
- +$370/yr (+$31/mo · 114.8%)
ⓘ Screening estimate from a state-policy table — verify with the county assessor before closing.
Climate risk First Street
- Flood 3/10 Moderate FEMA zone X · 10% chance over 30 yrs
- Wildfire 1/10 Low
- Heat 3/10 Moderate 7 d/yr ≥100°F today · 17 d/yr by 30 yrs out
- Wind 2/10 Low
- Air quality 3/10 Moderate 2 unhealthy d/yr today · 3 by 30 yrs out
Nearby sold comps map
Loading sold comps map…
Walkable amenities ~0.75 mi
Loading nearby amenities…
Taxation est. · year 1
- Rental income
- $25,980
- − Mortgage interest
- −$7,002
- − Property taxes
- −$322
- − Insurance
- −$625
- − Repairs & maintenance
- −$2,078
- − Management
- −$2,078
- − Depreciation
- −$3,636
- Taxable income
- $10,238
- Est. tax owed @ 24.0%
- −$2,457
- After-tax cash flow
- $9,254/yr
For passive investors: Depreciation is non-cash, so a rental often shows a tax loss while cash-flowing — sheltering income. Rental losses are passive: they offset passive income freely, and up to $25,000/yr can offset ordinary (W-2) income if you actively participate and your MAGI is under $100k (phasing out to $0 by $150k); unused losses carry forward. On sale, claimed depreciation is recaptured at up to 25%, and gains may owe capital-gains tax (a 1031 exchange can defer both). Figures are a year-1 estimate at your 24.0% rate — not tax advice; consult a CPA.
Schools (NCES district)
- District
- Fort Wayne Community Schools
- NCES district ID
- 1803630
- Math proficiency
- 22% ▼ -11.00%
- Reading proficiency
- 29% ▼ -7.00%
- Median HH income
- $41,951
- Composite
- 21.68/100
- National rank
- #8275
- State rank
- #263 of 301 in IN
Livability — Fort Wayne
- Score
- 84/100
- State rank
- #6
- US rank
- #676
Category grades
Schools grade is shown separately in the Schools card above.
Census & demographics
- Census place
- Fort Wayne, IN
- County
- Allen County · 326,813 people
- City population
- 326,813
- Metro
- Fort Wayne, IN
- Population (ZIP)
- 19,684
- Household income
- $53,359
- Rent vs Own
- Severe rent burden
- 625.0
Population outlook (Allen County) Hauer SSP2
- Today (2025)
- 394,020 people
- By 2030
- 405,128 · +2.8%
- By 2040
- 423,476 · +7.5%
- By 2050
- 435,137 · +10.4%
- By 2075
- 450,293 · +14.3%
- By 2100
- 424,101 · +7.6%
Race, ethnicity, and origin ACS 2023
- Neighborhood character
- Predominantly White (71%)
- Race & ethnicity
- White 71% Hispanic / Latino 13% Two or more races 9% Black 9% Asian 2%
- Hispanic origin (detail)
- Mexican 10% Puerto Rican 2%
- Common ancestry
- Romanian 3% Lithuanian 2% Slovak 2%
- Foreign-born
- 7% · Canada, Philippines, South Korea
- Languages at home
- 86% English-only · Spanish 10% Korean 2% Other Asian/Pacific 1%
Political lean MEDSL · Allen
- 2024 margin
- R (+12.5) · D 42.9% · R 55.4% · Other 1.7%
- 2008→2024 swing
- -8.1pp toward R · 2008: -4.3pp · 2024: -12.5pp
- All cycles
- 2024: R+12.5 2020: R+11.2 2016: R+19.6 2012: R+16.8 2008: R+4.3
Not yet ingested
- Civics
- —
Market trends
- HPI YoY
- ▼ -288.51%
- Current HPI
- 239.6115
- Rent YoY
- ▲ 6.98%
- Metro
- Fort Wayne, IN
- State GDP YoY
- ▲ 2.90%
- F500 in state
- 18
Industry mix (Fortune 500 HQ in IN)
| Industry | F500 HQs | Revenue |
|---|---|---|
| Industrial Machinery | 2 | $37B |
|
||
| Healthcare | 1 | $177B |
|
||
| Pharmaceuticals | 1 | $45B |
|
||
| Metals / Steel | 1 | $18B |
|
||
| Agriculture | 1 | $17B |
|
||
| Packaging | 1 | $12B |
|
||
Price history
-10.7% since first listed2 events — show timeline
- 2026-04-14 Price Changed $125,000 IRMLS
- 2026-01-15 Listed $140,000 IRMLS
Property tax history
+4.2%/yrLatest (2024): $322 · +0.0% YoY. Source: county tax records.
Cash-flow waterfall
monthlySold comps — $/sqft
last 12 mo · ≤1 miLoading sold comps…